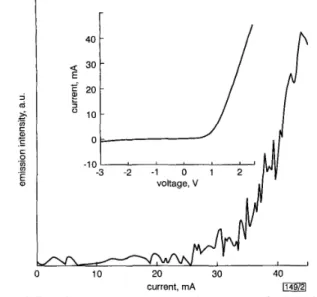
Results: An emission spectrum resulting from electrical current injection through the pn junction is shown in Fig. l(i), together with a PL spectrum (Fig. I(ii)). An emission peaking at -390nm is observed for both spectra. No other emission band is observed in the wavelength range 350-800nm. This UV emission band is thought to originate from excitons or electron hole plasma in ZnO because the peak position of the observed emission is fairly close to that of PL in ZnO, and no PL is observed for SCOs.
rectangular window
5 KUDO,A., YANAGI, H., UEDA, K., HOSONO, H., KAWAZOE, H., and YANO, Y : ‘Fabrication of transparent p-n heterojunction thin film diodes based on entirely on oxide semiconductors’, Appl. Phys. Lett., 1999, 75, pp. 2851-2853
6 OHTA, H., ORITA, M., TANJI, H., KAWAZOE, H., and HOSONO, H.: ‘Heteroepitaxial growth of zinc oxide single crystal thin films on
(1 11) plane YSZ by pulsed laser deposition’. Mat. Res. Soc. Symp. Proc., 1999, Vol. 570, pp. 309-313 Blackman window I zoomed in DFT -1 0 -3 -2 -1 0 1 2 voltage, V zoomed in DFT
nP
1
I
median filterfuse both ionograms 1
V
I I 10 20 30 40 median filter1
1
determine all edges
select significant and true weak edges current, mA
Fig. 2 Typical current-emission intensity characteristics of p-SrCuZ02/ n-ZnO LED
Threshold current is -30mA; turn-on voltage is -1 .OV Inset: typical I-V characteristic
Fig. 2 shows the emission intensity against injection current. The tendency is similar to that of the current-voltage curve for the pn junction, as shown in the inset to the Figure, except that the threshold current (30mA) is significantly higher in the emission. The external efficiency of the emission is typically of the order of 0.01%. The low efficiency is most likely due to the degraded qual- ity of the SrCu202 films deposited at low temperatures to avoid chemical reaction at the SCOiZnO interface. Efforts to improve the device structure and fabrication processes are currently in progress, with the goal of increased efficiency. A concurrent study of EL spectra as a function of injected current is also in progress. Acknowledgments: The authors would like to thank H. Kosuga of HOYA Corporation for assistance with reactive ion etching. 0 IEE 2000
Electronics Letters Online No: 20000726 DOI: lO.l049/el:20000726
H. Ohta, K. Kawamura, M. Orita, M. Hirano, N. Sarukura and H. Hosono (Hosono Project of Transparent ElectroActive Materials, E R A TO, Jupan Science and Technology corporation, KSP C-1232, 3-2- I , Sulcado, Takutsu-ku, Kawusaki-shi, 213-0012, Japan)
N. Sarukura: Also with Institute of Molecular Science, 38 Nishigonaka, Myodaiji, Okazaki 444-8585, Japan
H. Hosono: Also with Materials and Structures Laboratory, Tokyo Institute of Technology, Nagatsuta, Midori-ku, Yokohama 226-8503, Japan
7 February 2000
Ref er en ces
1 KAWAZOE, H., YASUKAWA. M., HYODO, H., KURITA, M., YANAGI, H.,
and HOSONO, H.: ‘P-type electrical conduction in transparent thin films of CuAIO,’, Nuture, 1997, 389, pp. 939-942
KUDO, A., YANAGI, H., HOSONO. H., and KAWAZOE, H.: ‘SrCuzOI: A p - type conductive oxide with wide band gap’, Appl. Phys. Let?., 1998,
13, pp. 220-222
3 THOMAS, D.G.: ‘The exciton spectrum of zinc oxide’, J. Plzys. Chem. Solids, 1960, 15, pp. 86-96
4 THOMAS, B.w., and WALSH, D.: ‘Metal-insulator-semiconductor electroluminescent diodes in single-crystal zinc oxide’, Electron. 2
Lett., 1973, 9, pp. 362-363
Algorithm for high quality ionograms
F. Arikan, S. Salous and 0. Arikan
A new ionogram algorithm, which is highly successful in generating robust and sharp digital ionograms free of artefacts and processing noise, is presented. An important feature of the algorithm is the distortionless zooming capability, which allows the user to concentrate only on the desired magnetoionic components of the ionogram.
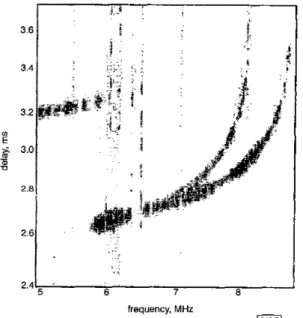
Framework of ionogram algorithm: The algorithm for clean and sharp ionogram generation is presented in Fig. 1. The first step is to express the received chirp signal in the time-frequency plane. For this purpose, smaller data sequences will be extracted from the signal vector with an allowance of overlapping samples. The standard procedure in obtaining ionograms is to apply a rectangu- lar window to the extracted data samples, pass them through a fast Fourier transform (FFT) algorithm and subsequently arrange the sequences in the time-frequency plane [3, 41. The rectangular window is used despite its high sidelobe levels (the first sidelobe level is only 13.5dB down from the mainlobe) since it has the nar- rowest first null beamwidth compared with the other window functions [4]. To reduce the effects of sidelobes on the detection of echoes, other windows such as the Blackman window are used (its first sidelobe level is -57dB down from the mainlobe level). How- ever, the mainlobe beamwidth of the Blackman window is three times that of the rectangular window. Thus it is desirable to com- bine the best of these two window functions, i.e. a sharp mainlobe and low spillovers. Therefore the extracted data samples are passed through both rectangular and Blackman windows sepa- rately. To transform the windowed signal sequences into the fre- quency domain, a discrete Fourier transform (DFT) is used. The advantages of using the DFT as opposed to a conventional FFT are two-fold. First, the DFT can be represented as a non-recursive chup filter and thus this will lead to real-time computations of the DFT on a single chip. The second advantage of implementing the DFT as a chup filter (i.e. a chirp z-transform) is the ability to con- centrate or zoom into a desired section of the ionogram without any distortion. Fig. 2 shows the zoomed-in Blackman windowed and median filtered ionogram to observe the 1F2-layer ordinary and extraordinary waves.
the median filter length, and the threshold levels used in determin- ing the significant and insignificant signal transitions and statisti- cal thresholding routine. To increase the resolution in the investigated spectral interval, the window length should be chosen to be as wide as possible, yet the analysed signal segment has to have negligible spectral variations inside the window. Choosing this window to be longer than its optimum length not only causes blurring in the estimated ionogram but also makes it difficult to resolve rapid variations around the critical frequency. Thus the choice of the optimum length is based on the restrictions of the ionospheric physics and it is set to 512 in the off-line analysis of the ionograms presented in this Letter. The optimum choice of the number of overlapping samples (which is set to 50% overlap in this analysis) is related to the window length and its value can be modified according to the characteristics of the operating link. If this parameter increases more than its optimum value, the resolu- tion in the frequency axis decreases. The thresholds in the edge detection and statistical thresholding routines are also set accord- ing to the off-line analysis of ionograms. The decisions of signifi- cant or insignificant signal transitions are based on an expert point of view. Even if some insignificant traces are left after the edge detection routine is run, the statistical thresholding algorithm eliminates the leftover insignificant artefacts. All these parameters can be set once optimised over a specific link, and they can be adopted in the automatic selection of the parameters in an on-line analysis. Generally, once the parameters are set in an optimum or quasi-optimum manner, the ionogram algorithm is very robust to variations in the ionospheric conditions and high quality iono- grams can still be generated.
3 6 3 4 3.2 10 E
g.
3.0 - m U 2.8 2.6 2.4L ’I
6 7 8 frequency, MHzFig. 2 Blackman windowed, median filtered and zoomed ionogram to observe IF2-layer ordinary and extraordinary waves
13428]
The third step of the ionogram generation is to discriminate between significant and insignificant signal transitions and to elim- inate the insighcant signal components. The significant edges of the Blackman windowed and median fdtered periodogram are determined using Canny’s edge detection method. This method is quite robust to noise components and is highly successful in detecting true weak edges. After determining the locations of sig- nificant signal transitions, the median filtered Blackman windowed and rectangular windowed spectrum estimates are fused to obtain a sharp periodogram with negligible ringing. As a fmal step, a sta- tistical thresholding method is used to partially eliminate the left- over artefacts and noise-like components. Fig. 3 presents a sharp and clean fused ionogram.
The success of this new ionogram algorithm is mostly deter- mined by the proper choice of parameters such as the window length, the number of overlapping samples, the length of the DFT,
3.5
1
2 2.0I
r - 1.5 7 8 1.0 I 61342/31
frequency, MHzFig. 3 Fused ionogram, sharp und free of noise and artefacts
Conclusion; An alternative digital ionogram algorithm, which is based on recent digital signal processing techniques, is presented. The performance of this new ionogram algorithm has been veri- fied with H F chirp sounder data collected from an oblique midlat- itude path. The presented algorithm is highly successful in obtaining robust and sharp ionograms free of artefacts and processing noise. This algorithm can also be modified to be used in real time (on-line) applications.
0 IEE 2000
Electronics Letters Online No: 20000725 DOI: 10.1049/el:20000725
10 April 2000
F. Arikan (Department of Electrical and Electronics Engineering, Hacettepe University, Beytepe, 06532, Ankara, Turkey)
E-mail: [email protected]
S. Salous (Department of Electrical Engineering and Electronics, UMIST, PO Box 88, Manchester M60 I Q D , United Kingdom) 0. Arikan (Department of Electrical and Electronics Engineering, Bilkent University, Bilkent, 06533 Ankara, Turkey)
References
1 GOODMAN, J.M.: ‘HF communications-science and technology’ (Van Nostrand Reinhold, New York, NY, 1992)
2 SALOUS; s.: 'On the potential applicability of auto-regressive spectral estimation to HF chirp sounders', J. Atmospheric Solar- Terrestrial Phys., 1997, 59, (15), pp. 1961-1972
SALOUS, s.: 'FMCW channel sounder with digital processing for measuring the coherence of wideband HF radio links', IEE Proc. F, 1986, 133, (5), pp. 456-462
4 FANTE, R.L.: 'Signal analysis and estimation' (John Wiley and Sons, New York, NY, 1988)
3
Efficient wideband digital correlation
B.R. Carlson and P.E.
DewdneyA method is described for digital correlation of very wideband signals from a radio interferometer. The intent of the method is to achieve maximum spectral resolution at minimum cost. Data are digitally filtered and decimated into lower rate sub-bands which are separately cross-correlated and integrated before being seamlessly stitched together to yield the wideband spectrum. Simulation results are presented to enable a comparison to be
made of this method with results obtained using a full band correlator.
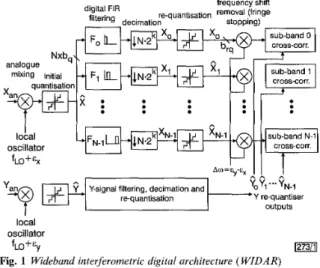
Introduction: The use of high-speed samplers with clock rates that exceed those of downstream cross-correlation hardware requires a sub-rate demultiplexing scheme. Time-division demultiplexing methods have been developed, but in such methods many cross- correlations must be performed per spectral channel. In a large interferometer array, this adds significant cost to the system or reduces the number of spectral channels that could be available. On the other hand, frequency-division demultiplexing schemes have the advantage that only one cross-correlation must be per- formed for each spectral channel. Analogue filters have been used to split the wideband into sub-bands, but it has been difficult to 'stitch' the results together to yield the wideband spectrum because of the variability of the filters. In this Letter, a digital method based on the wideband interferometric digital architecture (WIDAR), is described and simulation results presented that per- mit the seamless stitching of bands. The wideband is sampled, split into sub-bands with digital filters, cross-correlated, and then stitched together. A block diagram for the WIDAR is shown in Fig. 1. A scheme is also described that acts incombination to effect fully digital sub-sample delay interpolation, which is required in order to achieve precision delay compensation [l].
frequency shift (fringe digital FIR filtering de , re-quantisation cimation stopping) sub-band 0 analogue
.
.
I
local oscillator fLO+EX , . - A A YoY,...?"-l * Y re-quantiser outputs local fLO+Ey 1273/11 oscillatorFig. 1 Wideband interferometric digital architecture ( WZDAR)
Filtering and decimution: A digital FIR fdter has a predictable amplitude and phase response. The amplitude response is the Fou- rier transform of its tap coefficients provided that the internal word-length of the realised filter is suficiently long. For a cosine- symmetric FIR, the phase is linear. If the integer sample delay through the filter is removed, then the phase is essentially zero down to the -15dB point in the transition band of a bandpass filter. These are the important qualities of filters for this applica- tion.
ELECTRONICS LETTERS 25th May 2000 Vol.
36
If the sampler output is time-demultiplexed by a factor of N, then decimation of the output of a particular FIR filter by the same factor (or 2k .
N;
k = 0, 1, ...) yields an efficient parallel architecture that must only operate at the decimated sample rate. Normally k = 0 but could be nonzero if it is desired to split the band into smaller sub-bands than the demultiplexing factor. For simplicity, k = 0 for the rest of the discussion. If the FIR filter has tap coeficients producing a bandpass of UN of the full band aligned to sub-band boundaries of n/N (n = 0, 1, ..., N-l), then decimation by a factor of N will yield a baseband signal with bandwidth and sample rate reduced by a factor of N [2]. If n is odd, then the signal will have the opposite frequency sense and can be corrected by changing the sign of alternate samples. Any finite-length FIR fdter will have a finite transition band. After decimation, the transition band outside the sub-band boundaries will alias with opposite frequency sense. False correlation of the aliased component will occur unless caused to decorrelate.26 r
221
180 64 128 192 256 320 384 448 51 2 576 640 704 768 832 896 960 1024 1273/21 Fig. 2 Amplitude of reference full bund and W I D A R correlation results (i) WIDAR correlation: Normalised broadband noise RMS: 0.00832 (ii) Reference fullband correlation: normalised broadband noise RMS: 0.00827
General configuration: Original sample rate: 4Gsample/s; 500 X lo6
samples simulated; identical noise generator seeds; Hanning windowing WIDAR configuration: 16 sub-bands; FIR filters: 1023 tap, cosine symmetric; 10 bit internal wordsize with block floating point; original quantisation: 4 bit; re-quantisation: 4 bit
-141 " " ' ' 1 " " " " ' frequency, bin 2.0 1.2 - - ti-2.01 ' ' ' ' ' ' ' ' ' ' ' ' ' ' ' '
5
a D 3 3 15 B 9 -3 -9 -15!J 64 128 192 256 3O; 384 448 5;2 5;6 Si0 704 768 8 i 2 896 9601024 frequency, bin b 1273/31Fig. 3 Percentage difference between full band and W I D A R correlation U Identical noise generator seeds
h Dillerent noise generator seeds
1.0 0.6 - -
2
-0.6 - e!-1.0 " ' " " " " " ' " a 0.6 r" 0.2 Q -0.2 -0.6 frequency, bin b 1273/41Fig. 4 Phase difference between full band and W I D A R correlation
U Identical noise generator seeds
b Different noise generator seeds
Correlation and power correction: With the WIDAR, false correla- tion can be prevented if the local oscillator in each interferometer element has a unique (perhaps artificially imposed) frequency shift
E that is removed after decimation. Since the frequency sense of