iN TE m M C TG R A L iN vE ^T ^O A T iO H
c a
:
b e
f l o w
f a t t e f u l
A THESES SUBM ITTED TO TH E Q .AC U LT7G FM AN AC FSlEIfT
AML GMADUATE SCHOOL OF B U SIN E SS A FU IN JSTRATIO H
OF B IL K S N T U N IVERSITT
:
h
f a k t i a l
f u l f i l l m e n t
o f
t e e
r e q u i r e m e n t s
FOR THE DEGREE OF
iFJ
A u M I r ) Iii> F EI/LA ^
INTERSECTORAL INVESTIGATION OF CASH FLOW PA TTER N S
A THESIS SUBM ITTED TO THE FACULTY OF M ANAGEM ENT
AND GRADUATE SCHOOL OF BUSINESS A D M IN ISTRA TIO N
OF BILK EN T UNIVERSITY
IN PARTIAL FULFILLM ENT OF TH E REQUIREM ENTS
FO R THE DEGREE OF
M ASTER OF BUSINESS ADM INISTRATION
BY
M EHM ET VOLKAN SERTTAS
SEPTEM BER 1995
K F
■
CI S
I certify that I have read this thesis and in my opinion it is fully adequate, in scope and
quality, as a thesis for the degree o f M aster o f Business Administration.
V
' ^
Assistant Professor Dr. Can Simga MUGAN
I certify that I have read this thesis and in my opinion it is fully adequate, in scope and
quality, as s thesis for the degree o f Master o f Business Administration.
Asso. Professor Dr. Erdal EREL
I certify that I have read this thesis and in my opinion it is fully adequate, in scope and
quality, as a thesis for the degree o f Master o f Business Administration.
Assistant Professor Dr. Gülnur MURADOGLU
7
/
/ '
Approved for the Graduate School o f Business Adhjinistration
ABSTRACT
INTERSECTORAL IN V ESTIGATIONS OF CASH FLOW PATTERNS
BY
M EHM ET VOLK A N SERTTAS
SU PE R V ISO R : ASS. PROF. CAN SIMGA MUGAN
SEPTEM BER 1995
Companies from two different industries, cement and textile, are selected and analyzed by
means o f cash flow patterns in order to find out whether there exists a similarity between
the tw o sectors. Investigation o f the intersectoral cash flow patterns o f the two domestic
industries constitutes 26 companies whose securities are currently traded in Istanbul Stock
Exchange M arket ( ISE ). 13 out o f 26 companies are belong to cement sector and rest are
belong to textile sector.
Data are analyzed and calculated in spreadsheet program that is provided by ISE. The type
o f the files in the spreadsheet program is Lotus 123 Wk. Data covers the period 1990 -
1994 ( annually).
These cash flow patterns are searched using the subsections o f cash flow from operational,
cash flow from investment, and cash flow from financing activities.
Although the result o f this study shows that there is not a similarity between the two
industries in term s o f cash flow patterns, it gives an insight for the financial and economical
prospects o f cement and textile industries.
ÖZET
SEKTÖREL NAKİT AKIM MODELLERİNİN ARAŞTIRILMASI
M EHM ET VOLKAN SERTTAŞ
DANIŞMAN: YRD DOÇ CAN ŞIMGA MUGAN
EYLÜL 1995
Tekstil ve çimento sektörlerinden seçilen firmaların nakit akım tablolan incelenmiş, ve
bu iki sektör için birbirine benzeyen herhangi bir model olup olmadığı araştırılmıştır.
İlgili iki sektörden seçilen firma sayısı 26 olup bu firmalar halihazırda İstanbul Menkul
Kıymetler Borsası’nda ( İMKB ) kotelı olarak işlem görmektedir. Bu 26 firmanm 13’ü
tekstil kalanı çimento sektörüne aittir
Analizde kullanılan datalar İMKB tarafindan verilen Lotus 123 WK spreadsheet
program ı içerisinde hesaplanmıştır. Elde edilen datalar 1990’dan 1994’e kadardır.
İlgili nakit akım modelleri firmalann esas faaliyetlerinden, yatırımlarından, ve finansal
aktivitelerinden meydana gelir.
Ortaya çıkan sonuç iki endüstri nakit akım modelleri arasmda bir benzerlik kurulmasına
imkan sağlamamasına rağmen, incelenen dönemler için bu sektörlerin ekonomik ve
finansal durumları ve gelişimleri hakkmda bilgi vermektedir.
ACKNOW LEDGM ENTS
I would like to thank to Assistant Professor Can Sitnga Mugan for her supervisions, kind
interest, patience, and constructive comments throughout the study. I am also grateful to
the whole examining committee members for their contributions.
I also thank to the Alev M umcu from ISE for her efforts in gathering and organizing the
necessary data.
TABLE OF CONTENTS
ABSTRACT
i
OZET
ii
ACKNOW LEDGM ENTS
iii
TABLE OF CONTENTS
iv
I. INTRODUCTION
1
II. LITERATURE REVIEW ON CASH FLOWS
2
III. PREPARATION OF CASH FLOW STATEM ENTS
8
IV. M ETHODOLOGY
15
V. DATA AND W ORKSHEET
21
VI. RESULTS
28
VII. CONCLUSION
29
REFERENCES
31
APPENDICES
32
A P P E N D IX !
33
APPENDEX.2
34
ADANA CIM ENTO
35
AFYON CIM ENTO
36
AKCIM ENTO
37
ASLAN CIM ENTO
38
BATI ANADOLU CIM ENTO
39
BOLU CIM ENTO
40
CIM SA
41
CIM ENTAS
42
ÇANAKKALE CIM ENTO
43
KONYA CIM ENTO
44
M ARDİN CIM ENTO
45
N IG D E CIM ENTO
46
UNYE CIM ENTO
47
A K A L
t e k s t i l
48
A K SA A K R IL IK
49
DERIM OD
50
K O YTAS
t e k s t i l
51
LUKS
k a d i f e
52
OKAN
t e k s t i l
53
PO LY LEN SENTETİK
54
IV
SIFAS
s e n t e t i k
SOKSA
SÖNM EZ F.
s e n t e t i k
İPLİK
SOKTAS
Y U N SA
55
56
57
58
59
I. INTRODUCTION
Cash, universally acknowledged to be the most liquid assets, represents the beginning as
well as the end o f accounting cycle. It affords an enterprise the greatest degree o f liquidity
and flexibility o f choice. Profit oriented activities o f a firm need cash in order to be
converted in to different kinds o f assets. Operating results are definitively and finally
realized after the collection process returns the cash to the company such that a new cycle
which is expected to have profitable potential can begin.
Analysts o f financial statements, investors, and other users have complained that the
increasing intricacy o f the accrual accounting system masks real cash flows from
operations and widens their divergence fi’om reported income. There is a com m on belief
that not only operating cash inflows regarded as ultimate validators o f profitability but also
cash, not net income, that must be used to repay loans, to replace and expand the stock o f
plant and eqmpment in use, and to pay dividends.
For bankers and financial analysts, earnings and cash flow generating ability o f a borrow er
are very important factors in financial statement and credit analysis. Undoubtedly, business
can not survive without generating cash flow fi"om operating activities for long time.
Analysis o f cash flow statements can provide valuable information to m arket and to
financial users. The components o f the cash flow statement provide important feedback for
bankruptcy predictions, loan risk, and stock m arket valuation. Cash flow statements assists
in evaluating the liquidity, financial flexibility, and solvency o f an enterprise.
Yet, it may be argued that the statement o f cash flows is one o f the most important
financial statements, particularly in light o f the num ber o f companies facing the 1990s with
debt-laden balance sheets and whose solvency are in question. Understanding the statement
o f cash flows is o f growing importance as the entities faces more with debt burden. Debt
is repaid by cash, thus cash flows are paramoimt importance.
n . LITERATURE REVIEW ON CASH FLOWS
During the 1980's there was an increasing interest on cash flow reporting. A t 1984, The
Financial Executives Institute ( FEI ) has stated that cash flow measures are useful for
evaluating operating, financing, and investing activities o f a business entity. The US
Financial Accounting Standards Board ( FASB ) in its statement No 5 ( 1984 ) stated that
a full set o f financial statements for a period should show cash flows during the period.
Also, the Canadian Institute o f Chartered Accoimtants' ( CICA ) statement 1540 ( 1985 )
and Statement o f Financial Standards No 95 ( 1987 ) require statement o f cash flows as
part o f a full set o f financial statements for all companies in place o f a statement o f changes
in financial position. ( Charitou and Ketz, 1991 ).
The proposed statement mentioned above specifies that cash flows should be classified as
operating, investing, and financing activities. These requirements are to be based on the
behef that past cash flows as well as earnings are useful for assessing future cash flows, and
the cash flow statement presents different information from that provided in the other
financial statements ( Charitou and Ketz, 1991 ).
FASB and CICA mentioned that the focus o f the statement as changes in financial
positions should be cash flows rather than working capital since users o f the financial
statements have argued the relevance o f the concept o f working capital. By definition.
working capital includes non-m onetary assets and a working capital-based statement does
not provide very useful information for assessing the futm e cash flows. Hence, positive or
negative working capital does not necessarily indicate hquidity ( Gup and Dugan 1988 ).
On the contrary o f strong support for cash flow reporting, UK firms are required to
publish a statement prepared in accordance with the Standard Accounting Practice (SSAP)
N o 10 ( Statement o f Som ce and Apphcation o f Funds, 1975 ). This statements' objective
is to show how the operations o f the company have been financed and how the financial
resources have been used by the selected form at that should be designed to achieve the
objective ( Charitou and K etz, 1991 ). The standard has been criticized since it is very
general and it does not discuss the usefulness o f the funds statements to the investor, v ^ c h
is, how a fund statement could improve decision making ( Aston, 1978 ).
As the SSPA No 10 is very general, in practice there are diversified presentations o f funds
statements. In a survey o f published Accoimts, results showed that several firms focused
on net hquid funds. Other firms focused on changes in working capital and others had no
apparent focus ( Skeratt 1980 ).
In contrast, according to the FASB and CICA the cash flow s ta te m ^ t provides better
indication o f hquidity and solvency, and hence the ability o f an enterprise to generate cash
in stead o f focusing on w orking capital or other non cash groupings. FASB and CICA and
empirical evidence support the viewpoint that cash flow statements helps users o f financial
statements in tw o ways.
i) in evaluating the liquidity and solvency o f an enterprise
ii) m assessing its ability to generate cash from internal sources in order to repay debt
obligations, to reinvest and to pay dividends to sliareholders ( Charitou and Ketz, 1991).
In the UK cash flow reporting was supported by Lee ( 1978,1981 ) and Lawson (1981)
They proposed a cash flow reporting system which is based on a matching o f periodic cash
inflows and outflows. Long-term financing is disclosed by such statements, where cash
flow from operations are insufBcient to cover cash outflows from operations, replacements
o f assets, and investments for growing. Lee and Lawson claim that cash flow reporting
systems avoid arbitrary allocations and they are also useful for financial statement users in
predicting future dividends. In addition, the fact that, generally business entities can not
survive in the long-run without generating operating cash flows. Although, cash flows are
very important for the survival o f the fiirms, financial reporting systems have generally not
included cash flow reporting ( Charitou and Ketz, 1991).
Lawson has been mainly concerned with the usefiilness o f cash flow information rather
than on the structural details o f the reporting system. Lawson examined operating cash
flows and accrual earnings in the U K manufacturing sector for the period 1954-76. The
results showed that,
i) cash flows are relevant for stock m arket valuation
ii) accrual earnings are not as relevant as cash flows for the market valuation purposes.
In 1977 Hawkins argued the classical view that the firm's stock is equal to next years cash
dividend divided by the difference o f the required rate o f return and the growth rate o f
dividends. He claimed that this view was satisfactory during 1960's and would be
appropriate when the dividend paym ent rate is constant and when retained earnings lead to
higher future dividends. Under these circumstances growth rate o f earnings is same as the
growth rate o f dividend payment rates. On the contraiy, in m ore recent years accounting
earnings are based on certain aspects o f current value accounting and hence more
companies are using more Uberal accoimting practices, non-operating items are included in
income, inflation distorts numbers, companies have increased their leverage, income
smoothing has become m ore difficult, and payment ratios have grown smaller. As a
consequence, Hawkins claimed that accounting earnings,
i) have becom e less rehable as an indicator o f future dividends
ii) are less correlated with cash flows
In an attempt to investigate Hawkins assertions, Largey and Stickney ( 1980 ) examined
operating earnings, working capital from operations and cash flow from operations for the
W T Grant company, the largest retailer in the 1970's, for the ten year period before its
bankruptcy. Operating earnings and working capital from operations were positive and
highly correlated during the period 1966-74. Firm appeared to be in a good financial
position. Although the company seemed profitable, cash flow from operations were
negative during the last five years prior its bankruptcy. In summary results o f the study
indicate that,
i) the W T Grant company w as profitable but it did not generate cash from operations
ii) the price/eamings ratio was about twenty, much higher than the industry average, prior
year o f its bankruptcy
iii) investors placed much higher interest on the profitability in valuing the firm
On the other hand, the negative operating cash flows should have provided investors as an
early signals for the liquidity problem ( Charitou and Kentz, 1991).
M oreover, other researchers studies strengthen the evidence provided by Largey and
Stickney. Charitou and Venieris ( 1990 ) study for European bankrupt firms, and factor
analysis o f Gambola and Ketz ( 1983 ), and Charitou ( 1993 ). Gambola and Ketz
analyzed 119 firms for the period 1962-80. Charitou examined the Campeau Corporation
for the periods 1984-90. Their results indicted major differences between cash flow
measures and profitabihty measures, that is operating earnings and working capital fiom
operations. Working capital fi^om operations were shown to be a measure o f profitabihty
rather than a measure o f hquidity.
In recent years in the US and Canada, parallel to the increasing interest in cash flow
reporting, there has been a strengthening behef that information on cash flows is valued in
the m arket place. Although Heath ( 1978 ), Lawson ( 1981 ), Lee ( 1978, 1981a, 1981b,
1983 ) and FASB and CICA support the viewpoint that cash flows jfrom operating,
financing, and investing activities are valued in the market place, there has been httle
empirical study to support the contentions. Charitou and K etz ( 1 9 9 1 )
examined
403 firms
for the period 1968-85 so that they coidd select the appropriate firms in order to run the
regressions within the model they had build. The study employs a cross-sectional equity
valuation m odel to examine the association o f cash flows fi'om operating, financing, and
investing activities with the security prices. The regressions run over the period for the
years 1976-85. The results indicate that.
i) the accrual and cash flow components o f earnings are valued in the market place
ii)
cash flows fi’om operations, cash available for dividends, and cash available for
investments are associated with positive price movements
iii) the success or failure o f each firm depends not only on the profitability o f the firm but
also on the liquidity
Various articles have appeared in the Uterature that addresses the technical issues related to
the preparation o f the statement o f cash flow. Krehbiel ( 1990 ) and Tucker ( 1989 )
provide a worksheet approach in order to determine net cash flows from operating
activities under the indirect method by using accrual basis financial statements. Klammer
and Reed ( 1990 ) consider such problems associated with preparing the statement o f cash
flow as the circumstances under which the netting o f cash inflows and outflows is
permissible, the nature o f cash equivalent, and such issues ( Dugan, Gup and Samson
1991).
Finally, Brandt, Danos, and Brasseax (1989), Carslaw and Mills (1991), Giacomino and
Mielke (1993) describe various ratios which can be derived for financial statement analysis
purposes using information appearing in the statement o f cash flows.
n i. PREPARATION OF CASH FLOW STATEMENTS
As there has been empirical support that cash flows provide different information for the
market than that provided by W CFO and earnings, the FASB and CICA proposed that
investors focus not only on earnings but also on cash flows from operating, investing, and
financing activities. FASB specified exactly how investing and financing activities would be
displayed but permitted flexibihty in the presentation o f operating cash flows. Cash flow
provided by financing activities includes issuance o f capital stock, debt issuance, and debt
payments. Cash flow applied to investing activities includes purchases o f properties and
equipment proceeds from the sale o f property, plant, and equipment. Cash flow from
operating activities can be derived by using direct or indirect method ( Charitou 1993 ).
Entities are encouraged to use the direct method and report gross cash receipts and cash
payments ( FASB 1987, par 27 ). Alternatively, companies may choose to use the indirect
m ethod and adjust net income to arrive at the net cash flow from operating activities
(FASB 1987, par 28).
The Direct Method :
Under this method, cash flows from operations is based on gross reporting o f cash receipts
and payments, such as payments to supphers and receipts from the customers. This method
is less complicated, requiring only the subtraction o f cash disbursements from cash receipts
to arrive at cash flow from operations. Direct m ethod simply lists the classifications o f cash
flows from operations.
According to SFAS No 95, the main advantage o f this method is that it shows operating
cash receipts and payments that,
i) may be useful in estimating future operating cash flow.
ii) are presumed to be m ore useful than infonuation only about their arithmetic sum
( i.e. net income ) in assessing future performance.
iii) presumably would be m ore useful than information only about their arithmetic sum
( i.e. net cash flow from operating activities ) in assessing an company's operating activities
to pay its debt, to reinvest in its operations, and to make distributions to owners.
Some researchers, ( Patón 1963; Sorter 1982; Thomas 1982; Nürnberg 1983 ), contented
that the direct form at for presenting operating cash flows provides m ore useful information
to both creditors and investors than does indirect form at ( K lam m er and Reed 1990 ).
Gahlon and Vigeland showed that several cash flow variables and financial ratios based on
the direct m ethod capture statistically significant differences between bankrupt and non
bankrupt firms at least five years before bankruptcy. Among the cash flow variables that
can provide early warning are.
i)
cash flow from sales activity
ii) cash cost o f goods sold
iii) cash operating expenses
iv) cash operating income.
T h e In d irect M eth o d ;
In direct method is not as obvious as direct method and requires an imderstanding o f the
accounting m ethods inherent in the preparation o f the statement.
Accruals, simply, represent the difference in timing between the receipt o f cash and
recognition o f revenue or the payment o f cash and the recognition o f expense. This timing
difference causes the amoimt o f a company's net cash flow to be different from its
reported income. The indirect m ethod o f determining cash flows from operations begins
with accounting net income and reverses, adding or subtracting, the accruals made during
the accoimting process ( Cornell and Coates 1992 ).
Revenue A ccruals
:
Revenues are earned and recognized at the time o f the sale rather than w hen the cash is
received. Credit sales increase net income and accounts receivable while having no impact
on cash. Ending accounts receivable represents sales recorded for that cash has not been
collected. Similarly accounts receivable at the beginning o f a period represents revenues
recorded but n o t collected in the prior year. The process o f adjusting sales to cash
collections therefore involves adding the prior year accrual to sales and subtracting the
current year accrual. Hence, the beginning and ending accruals are netted together in the
statement o f cash flows ( Cornell and Coates 1992 ).
Expense Accruals:
Previous analysis pertains to the accrual and payment o f expenses.
Total expense is not equal to the amoimt o f cash outflow for expenses because the
company owes vendors, employees, and such money at the end o f the year. Additionally,
the company pays cash diuing the year for prior years expenses. The statement o f cash
flows begins with total expense for the current year and reverses the accrual for amoimts
owed at the end o f the year. The reconciliation o f expense to cash flow involves increasing
the expense for the prior year accrual and decreasing it for the current year accrual.
Under indirect method, net income can be thought o f as the net cash provided by
operations plus revenue accruals less expense accruals. Indirect method o f presenting the
statement o f cash flows simply reverses the accruals and backs in to the net cash flow for
the period ( Cornell and Coates 1992 ).
Non-Cash Expenses:
Among non-cash expenses depreciation is the most significant one. In reality depreciation
represents a systematic allocation o f costs to periods benefited by the insurance o f the cost.
Depreciation simply reduces the cost o f the asset by allocating that cost to expense over
the usefiil life o f the asset.
Depreciation expense is added back to net income in the indirect form at to arrive at the net
cash flow, but is ignored in the direct format. The reason depreciation is ignored in the
direct form at is that depreciation had no cash flow impact, and is therefore neither a cash
inflow or outflow ( Cornell and Coates 1992 ).
Other non-cash expense examples includes amortization, depletion, executive stock option
plans, and pensions. All o f those expenses reduce net income while having no cash flow
impact, and hence handled in a manner similar to that o f depreciation.
Companies also use non-cash revenues, where net income increased but cash is imafifected.
Non-cash revenues must be subtracted from net income to arrive at cash flow from
operations.
An example o f this results from the use o f the equity method o f accounting for long-term
investments in a subsidiary. The equity m ethod reflects a percentage o f the subsidiary's
earnings as revenue for the parent. This non-cash revenue item is term ed " equity in the
earnings o f the subsidiary " and must be subtracted from net income to arrive cash flow
from operations ( Cornell and Coates 1992 ).
Sales o f Fixed A ssets:
The purchase and sale o f the fixed assets are considered as a financing activity. Thus
proceeds from the sale o f fixed assets are shown in the financing section o f the statement
o f cash flows.
However, the gains and losses from the sale o f fixed assets are included in the
determination o f net income even if these losses or gains are not necessarily equal to the
cash proceeds from fixed assets' sale. It is rare that the sales price and the carrying value
( cost less accumulated depreciation ) o f an asset are equal since the accounting process
does not attempt to value assets at their fair m arket value ( Cornell and Coates 1992 ).
Carrying value is the function o f the original cost o f the asset, the length o f time the asset
has been held, and the depreciation method and life. The fair m arket value is determined
by the market conditions at the tie o f the o f the sale.
As a consequence, gains and losses from the sale o f fixed assets represent non-cash
operating revenues or expenses, and must be reversed in order to back into the amount o f
cash flow from operations ( Cornell and Coates 1992 ).
The table below illustrates the derivation o f the statement o f cash flows. Cash flow from
operations are held under the indirect method.
Cash Flow from Operating Activities :
- Net income ( loss )
- Adjustments to reconcile net income ( lo s s ) to net cash provided
( u s e d ) by operating activities
- Depreciation and amortization
- Amortization o f deferred charges and ( cred its), net
- Equity in net loss o f affiliated companies
- Changes in non-cash assets and liabilities,
net o f effects o f businesses acquired and non-cash transactions
( In crease) in accounts receivable
( Increase ) in inventories
( Increase ) decrease in prepaid expenses
Increase ( decrease ) in accounts payable and accrued expenses
- Other, net
N et cash used for operating activities
Cash Flows from Investing Activities :
- Additions to plant and equipment, excluding acquisitions
- Payment for businesses acquired, net o f cash acquired and including
other cash payments associated with acquisitions
- Investment in afGhated companies
- Proceeds from sales o f plant and equipment
- Decrease in funds held by trustee
- Proceeds from business disposition
- Proceeds from disposition o f investment in affiliated companies
Net cash used for investing activities
Cash Flows from Financing Activities :
- Proceeds from issuance o f long-term debt
- Com m on stock issued
- Redeemable preferred stock issued
- N et borrowings ( repaym ents) under lines o f credit
- Purchase and reissuance o f treasury shares
- Paym ents o f long-term debt
- Preferred dividends paid
N et cash provided from financing activities
N et increase ( decrease) in cash and marketable securities
Cash and marketable securities at the beginning o f year
Cash and marketable securities at end o f year
IV. METHODOLOGY
Building on the concept that the rele\ ance o f the information and how it can be used
Dugan, Gup, and Samson ( 1991 ) presented four independent, but interrelated modides
about understanding and teaching the logic o f statement o f cash flows.
Among the above mentioned modules, module 1 examines the eighth possible cash flow
patterns from operating, financing, and investing activities, and explains what each pattern
means with respect to the
financial
condition o f the firm.
Statement o f cash flows aimed at helping investors make assessments. It presents the
impact o f operating activities on cash flow ( hquidity ). It also depicts the relationships
among the cash flow categories, namely operating, investing, and financing. It is from
these categories that interesting patterns o f cash flow emerge ( Dugan, Gup, and Samson
1991 ).
This thesis consist o f an empirical study apphcation o f mentioned cash flow patterns
module.
TABLE 1
CASH FLOW PATTERNS
No; 1
No; 2
No; 3
No; 4
No; 5
No; 6
No; 7
No; 8
Cash
Flows
from
Operating
+
+
+
Cash
Flows
from
Investing
+
+
+
Casli
Flows
from
Financing
+
Table 1 shows the eight possible cash flow patterns o f operating, financing, and investing
activities. The first four patterns are based on the positive cash flows from operating
activities ( net cash inflows ). Conversely, the last four patterns are based on negative cash
flows from operating activities ( net cash o u tflo w s).
Pattern 1 :
This case rarely occurs in real life. The firm is experiencing positive cash flows in all three
activities, namely financing, investing, and operating. Entity is exercising a positive net
cash flow from operations, vsfrere as shrinking its long-term assets, and raising additional
capital from the financial markets. As a consequence, the company must be raising its cash,
presumably for som e strategic reason ( possibly looking for acquisition).
In this pattern company is generating strong positive operating cash flow so that it can use
this cash to expand - invest in long-term assets and repay its debt or pay dividends to
shareholders at the same time. This pattern reflects a successfiil firm that is in a good
financial position. The strong positive cash is m ore than adequate to acquire new property,
plant, equipment, and such ; the excess cash is used for debt and/or dividend payment.
Pattern 3 :
In pattern three, the company produces positive cash flow from operating activities but it is
not reinvesting in property, plant, and equipment. The firm is down sizing for some
marginally profitable reasons. The positive two cash flows-operating and investing are used
to repay debt to debt-holders, to pay dividends to shareholders, or both. In this case the
heavy debt burden must be replaced by operating cash flows, but if operating cash is
insufficient then cash generated from the sales o f long-term assets must make up the
difference to repay debt-holders as the amounts come due. Under this scenario, the
company may also has been restructuring - either internal restructuring or leverage buy
out.
Pattern 4 ;
This pattern is typical for m any growing firms. The firm's positive cash generated from
operating activities is not adequate to satisfy its e?q)ansion or investing activities. Part o f
the grovsdng is financed by cash inflows from financing activities- issuing debt and/or stock.
P a ttern 2 ;
In this case, the company's short-fall in operating cash flow is covered by two sources -
investing and financing activities ; sale o f fixed assets and financing firom shareholders
and/or debt-holders. In order to stay in the business, firm is selling its fixed assets while
investors are willing to supply financing. The reason that investors are continue to supply
financing is that they are expecting a turnaround in operating cash flow. Operating cash
flow is the m ost probable source firom which investors will be repaid.
Pattern 6 :
In pattern six, firm is expanding in terms o f fixed assets while it experiences a shortfall in
its operating cash flow. For most o f the young, fast growing companies the negative cash
fi'om operations may be attributable to large increases in working capital which causes a
large grow th in assets to support large scale sales. The negative cash flows fi'om operating
and investing are financed by borrowing and stock issuance. Investors are expecting that
future operating cash flows will be sufficient pay oflf themselves.
Pattern 7 ;
In this pattern, firm is financing operating cash flow shortage while also distributing cash to
shareholders and/or repaying debt-holders. These tw o negative cash flows are offset by
investing net cash inflow - proceeds fiom the sale o f fixed or long-term assets. The
company is shrinking in term s o f liabihties or owners' equity and in term s o f unhealthy
cash flow fiom operating activities.
P a ttern 5 ;
In the last pattern, operating, financing, and investing activities have negative cash flows.
Such an unusual scenario is possible if cash previously accumulated is being used to meet
operation shortfall and to pay long-term creditors and/or investors. Under this pattern firm
can not stay in the business very long without bankruptcy occurring.
Generating a positive cash flow fi'om operating activities means that company receives
enough cash to pay its expenses. If the firm fails to generate enough cash flow from its
operations it will fail. The management decision o f a company will be either reinvesting in
the funds by acquiring new assets or distributing the funds to long-term debt-holders or
shareholders if cash flow from its operating activities is positive ( Dugan, Gup, and
Samson 1991).
On the contrary, generating negative cash flows from operating activities means that the
cash received from the operations does not meet the firm's expenditures. Negative
operating cash flow may occur both in profitable and unprofitable periods. The reason o f
the firm that is experiencing negative cash flow from operations during in a considerably
high profitable period can be the mismatch o f the rapidly increased sales with the increased
inventory or receivable. Consequently, cash must be raised by selling assets or by
financing-borrowing or issuing stock. The latter method is apphcable if the negative cash
flow from operating activities is temporary. The former method, down sizing, may suggest
an economically stressed company. In this situation, the most attractive assets are easiest to
sell and typically are sold first. Operatiag segments o f the business are attractive to buyers
because o f their abihty to generate positive cash flows. I f the firm sold out these divisions,
its cash flow problem can become m ore aggravated ( Dugan, Gup, and Samson 1991).
P a ttern 8 ;
‘Depreciation and amortization’ are important income statement amounts. This item is
m ore significant in capital incentive companies. A relatively large depreciation and
amortization expense would possibly cause positive operating cash flow for the firms that
have significant property, plant, equipment, and intangibles when adjusting the cash flows
fi'om operations. Another common expectation for the long-term continuation o f the
business is that firms are likely to replace property, plant, and equipment that are
consumed in operations. Hence, in general, there should be positive net cash flows from
operating activities and negative cash flows from investing activities given the statement o f
cash flow classifications ( Dugan, Gup, and Samson 1991 ).
It should be noted that the relative magnitudes rather than only sign o f these cash flows are
m ore telling. For example, if the depreciation expense adjusted for the operating cash flow
is much greater than the amount spent on replacement o f new equipment, plant, and
property, it becomes apparent that the firm may be shrinking where as the existence o f the
investment-net cash outflow for investing activities ( Dugan, Gup, and Samson 1991 ).
V. DATA AND WORKSHEET
The accounting data are taken from the Istanbul Stock Exchange ( ISE ) data
bank
which
is provided in spreadsheet format. Data includes externally audited and detailed financial
tables ( and footnotes ) o f companies whose securities are traded in the ISE Markets,
together with the ratios reflecting their financial positions and performances.
Financial tables are elaborated in comphance with the
Turkish
Capital M arkets Board's
standards are given here below.
1. Balance Sheet
2. Income statement
3. Cash Flow Table
4. Fund Flow Table
5. Cost o f Goods Sold
6. Profit Distribution Table
7. Footnotes
8. Cash Flow Supplement
The preparation o f the tables from 1 to 6 is required by the law.
The external audit on six month periods basis is required by the law. Thus, the data bank
possesses the same periodical basis. As the external auditing was required by the law since
June 1992, the missing financial tables o f companies as o f year ends are related to the first
trade date o f their securities in ISE. Although ISE data bank includes financial tables o f
companies that are traded in market starting from the year 1990 on a six month period
basis, the cash flow tables o f the firms are very seldom on six month period basis in the
data bank. In other words, though its required by the law firms did not issued cash flow
tables for six month period basis. Hence, in the thesis the data wiU be analyzed for twelve
month ( year e n d s) period basis.
The obUgatory format o f firm's cash flows table in ISE spreadsheet is as follows;
CASH AT THE BEGINNING OF THE YEAR
CASH INFLOW S DURING THE PERIOD
1.
Cash fi'om Sales
2.
Net Sales Income
3.
Decrease in Trade Receivable
4.
Increase in Trade Receivable (-)
( ^
Cash firom Other Operations
(^ . J Cash from Extraordinary Income & Profit
7.
Increase in Non trade Short Term Liabüities
8.
Issue o f Marketable Securities
9.
Other increases
10.
Increase in Long Term Liabüities
11.
Issue o f Marketable Securities
12.
Other Increases
13.
Capital Increase
14.
Other Cash Inflow
CASH OUTFLOW S DURING THE PERIOD
15.
Cash Outflows Related to Costs
16.
Cost o f G oods Sold
17.
Increase in Inventories
18.
Decrease in Trade Payable
19.
Increase in Trade Payable (-)
20.
Expenses not Requiring Cash Outflow (-)
21.
Decrease in Inventories (-)
22.
Cash Outflows Related to Operating Expenses
23.
R & D Expenses
24.
Marketing, Selling and Distribution Expenses
25.
General Administrative Expenses
26.
Expenses not Requiring Cash Outflow (-)
27.
Cash Outflows From Other Operational Exp. & Losses
CZS]
Expenses & Losses fi^om Other Operations
\
29.
Expenses not Requiring Cash Outflow (-)
30.
Cash Outflows for Financial Expenses
(3L / Cash Outflows fi-om Extraordinary Exp. & Losses
( i î , .
Extraordinary Exp. & Losses
33.
Expenses not Requiring Cash Outflow (-)
/
3
^ Cash Outflows for Long Term Investments
3 5.
Principal Paym ents o f Short Term Loans
36.
M arketable Securities
37.
Other
38.
Principal Paym ents o f Long Term Loans
39.
M arketable Securities
40.
Other
41.
Taxes Paid
42.
Dividends Paid
43. Other Cash Outflows
CASH AT TH E END OF PERIOD
INCREASE ( DECREASE ) IN CASH
Although the form at that the cash flow data presented in the ISE data bank is in indirect
format, it does not provides cash flows from operating, financing, and investing activities
separately, 'fhus, some adjustments are required in order to figure out operating, investing,
and financing cash flows. Some assumptions are employed in the analysis. Since auditing
firms prepared all these financial tables in accordance to the rules set by Turkish Capital
Markets, these assumptions should not be violated.
From the above listed items that are presented in the ISE spreadsheet format, operating,
investing, and financing cash flows are evaluated by the following ways;
Cash Flow from Operating Activities :
Items 1, 2, 3, 4, 14, 15 - 25, 41 - 43 are incurred as cash flows from operating activities.
Items 14 and 43 are included in this section in accordance with the Turkish Capital
Markets Legislation ( p: 450-51, 1994 ).
The entities pays their current year tax obligation in the following year. Thus, item 43 that
is tax paym ent o f the company is not an cash outflow for the current period. So, the
difference between current year and previous year tax payments o f the firms are calculated
and reflected under this section. Since the tax payment item is carried imder other short
term liabilities in the balance sheets o f the companies, proceeds o f the difference is
incurred in cash flow from financing activities ( Turkish Capital Markets Legislation p.
440, 450-51, 1994 ).
Cash Flow from Investing Activities :
Items 5, 6, 28, 31, 32, 34 are included in cash flows from investing activities.
Items 5,6, 28 are considered in this section according to Turkish Capital Markets
Legislation ( p: 446-47, 1994 ). Interest and other dividend income, derived from income
statements, is extracted from items 5 and 6 and reflected in to the cash flows from
financing activities. Also in item 6, prior year income and profit, derived from income
statement, is considered in cash flows from operating activities.
Inclusion o f items 31 and 32 reflects another assumption in parallel to the Turkish Capital
M arkets Legislation ( p: 450, 1994 ). Prior year income and profit, and idle division
expenses and losses obtained from income statement is extracted from item 31, 32 and
incurred in cash flows from operating activities.
Cash Flow from Financing Activities :
Items 7 - 13, 30, 35 - 40 are incurred in cash flows from financing activities
Items between 7 - 13 are evaluated under this section in compliance with the Turkish
Capital M arkets Legislation ( p: 439-41, 450-51, 1994 ).
All expenses not requiring cash outflows are incurred in cash flows from operating
activities.
Companies selected for the study from cement sector is as follows,
Adana Cimento Sanayii TAS
Afyon Cimento Sanayii TAS
Akcimento Ticaret AS
Aslan Cimento AS
Baticim Bati Anadolu Cimento San. AS
Bolu Cimento Sanayii AS
Çanakkale Cimento Sanayii AS
Cimentas Tymir Cimento Fabrikasi TAS
Cimsa Cimento Sanayii ve Ticaret AS
Konya Cimento Sanayii AS
Mardin Cimento Sanayii ve Ticaret AS
Niğde Cimento Sanayii TAS
Ünye Cimento Sanayii ve Ticaret AS
Companies selected for the study from textile sector is as foUows,
A k - A1 Tekstil Sanayii AS
Aksa Aklilik Kimya Sanayii AS
Derimod Konfeksiyon Ayakkabi - Deri San. ve Tic. AS
Edip iplik Sanayii ve Ticaret AS
K oytas Tekstil Sanayii ve Ticaret AS
Lüks Kadife Ticaret ve Sanayü AS
Okan Tekstil Sanayü ve Ticaret AS
Polylen Sentetik iplik Sanayii AS
Sifas Sentetik iplik Fab. AS
Soksa Sinop Örme ve Konfeksiyon San. ve Tie. AS
Sönmez Filament Sentetik İplik ve Elyaf Sanayii AS
Soktas Pamuk Ürünlerini Değerlendirme Sanayii ve Ticaret AS
Yunsa Ymılu Sanayii ve Ticaret AS
The financial data are avaüable from year 1990 to 1994 but for the firms Cimentas,
Mardin Çimento, Edip iplik, Okan Tekstü, and Soktas. Cash flow tables for the mentioned
firms are missing for year 1990. Thus, for these companies the analysis period is between
1991 and 1994.
VI. RESU LTS
After examining the cash flow patterns o f two different sectors, namely cement industry
and textile industry, it is seen that there is not exist a similarity in terms o f cash flow
patterns between two industries.
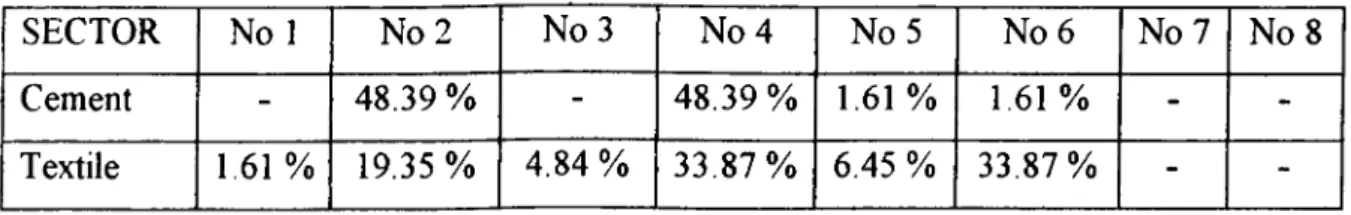
Pattern 2 and pattern 4 are occurred in same percentages, 48.39 % for the cement sector
(Appendix 1).
When we look up for the results o f textile industry, we can not claim that there exists a
pattern like the result o f the cement sector analysis. The percentages o f pattern 4 and
pattern 6 is same, 33.87 %. On the other hand occurrence o f pattern 2 is not negligible
with a percentage o f 19.35 %. Thus, one can say that there is more diversification in
textile industry in terms o f cash flow patterns (Appendix 2).
Table 2 illustrates the occurrence o f the cash flow patterns in percentages.
TABLE 2
Cash Flow Patterns
SECTOR
No 1
No 2
N o 3
No 4
No 5
No 6
No 7
No 8
Cement
-48.39 %
-48.39 %
1.61 %
1.61 %
-
-Textile
1.61 %
19.35 %
4 .8 4 %
3 3 .8 7 %
6.45 %
33.87%
-
VU. CONCLUSION :
The analysis above leads to one conclusion that companies operating in the cement sector
and textile sector shows different cash flow patterns. Although, there is not a unique cash
flow pattern for both sectors, entities that are operating in the cement industry seems in a
better financial position when comparing with the ones that are operating in the textile
industry. Pattern 2 and pattern 4 shows us that cement sector firms have no cash shortage
problem for their operations. They are mature and growing companies. Although, in year
1990 occurrence o f pattern 2 was 90 %, percentage o f this pattern eventually decreased in
the following year and hence, pattern 4 occiured m ore fi’om year 1991. Though, the both
patterns are distributed almost equally from year 1992 to 1994, for the year 1994 pattern 4
is more dominant. The reason for that is probably the Turkish economic crisis. During
year 1994 companies needed more external financing.
Textile sector
firms
are younger and rapidly growing ones when comparing them with the
cement industry companies. Significant occurrence o f cash flow pattern 6 shows us that
textile sector entities short-falls in cash fi-om their operations. Even though the occurrence
o f pattern 6 decreases to 7.69 % fi^om 61.54 % for the period 1991 and 1993, for the year
1994 pattern 6 eventually jumped to 46.15 % fi-om 7.69 %. This shows that economic
crisis during the year 1994 affected textile sector m ore with respect to cement sector. It
seems that cem ent sector firms benefited fi-om repo activities with the high yield
government bonds for their accumulated excess funds.
In summary this study gave an insight for the prospects o f economical and financial
positions o f the cem ent and textile industry corporations for the period fi-om 1990 and
1994.
The study has a limitation. There is a common beUef that most o f the corporations tries to
present themselves in a favorable financial position by means o f mampulating the
accounting numbers. The lack o f standards enables independent auditors to accommodate
their client's desires with ease and to allow amounts arrived at in widely varying ways.
Tliese results also have implications for users who would have an interest in such results
and issues.
REFERENCES
1) Bernstein, Leopold A. & Maksy, Mostafa M. ( Aug 1985 ), "Again Now; How Do We
Measure Cash Flow from Operations?",
Financial Analysts Journal,
pp. 74-77.
2) Charitou, Andreas ( Jan 1993 ). "An Analysis o f the Components o f the Cash Flow
Statement: The Case o f the Campeau Corporation",
Journal o f Commercial Lending,
pp.
33-42.
3) Charitou, Andreas & Ketz, Edward ( 1991 ), "An Empirical Examination o f Cash Flow
Measures",
Abacus,
Vol, 27, No 1.
4) Cornell, David W. & Coates, J. Dennis ( March 1992 ), "Harnessing the New Cash
Flow Statement",
Business Credit,
pp. 20-23.
5) Dugan Michael T., Gup Benton E., Samson William D. ( 1991 ), "Teaching the
Statement o f Cash Flows",
Journal o f Accounting Education,
Vol 9, pp. 33-52.
6) Gup, Benton E.& Dugan, Michael T. ( Nov/Dec 1988 ), "The Cash Flow Statement:
The Tip o f an iceberg".
Business Horizons,
pp. 47-50.
7) Istanbul Stock Exchange ( 1992 ), "Year Book o f Companies"
8) Johnson, Glenn L. & Gentry, James A., "Finney and Miller's Prmciples o f A ccountm g',
8th edition,
printed by Prentice-Hall, pp. 460-462.
9) Klammer, Thomas P. & Reed, Sarah A. ( 1990 ), "Operating Cash Flow Formats:
Does Form at Influence Decisions?",
Journal o f Accounting & Public Policy,
V ol 9, pp.
217-235.
10) Turkish Capital M arkets Legislation ( 1994 ),
3rd edition,
printed by Ajans Turk
Matbaacilik.
APPENDICES
APPENDIX.1
f C E M E N T IN D U S T R Y 1
L 1
[ N um ber o f O ccurren ce o f C a sh F lo w Patterns *
1 i
r ■
iv e a r Pattern 1 P a tte m 2 P attern 3 Pattern
4
P a tte m 5 P a tte m 6 Pattern 7 P attern 8 T otalI 11994 f i; ^---1 13 [ ---[W93
6
13 [ m 2 61
r 13 3 8 1 11 13[m o
9 1 10 [Total 0 3 0 0 3 0 1 1 0 0 6 2 [ [^Percentage 0 .0 0 % 4 8 .3 9 % 0.0 0 % 4 8 3 9 % 1.61% 1.61% 0 .0 0 % 0 .0 0 % 1 [ r 1r O ccurrence o f C a sh F lo w Patterns w ith respect to Years
1 r p r Y e a r r 1994 1993 1992 1991 1990 r jP attern 1 - - - - -[ [Pattern 2 3 8 .4 6 % 5 3 .8 5 % 4 6 .1 5 % 2 3 .0 8 % 90.00% f f e t t e m 3 - - - - -P f e t t e m 4 6 1 .5 4 % 4 6 .1 5 % 5 3 .8 5 % 6 1 .5 4 % 10.00% I [Pattern 5 - - - 7.69 % -r fPattern 6 - - - 7.69%
-[
[P a tte m 7 - - - --P
[ p a tte r n s - - - - -f [Total 10 0 .0 0 % 10 0 .0 0 % 1 0 0 .0 0 % 1 0 0 .0 0 % 100.00%P
1 1I*
For alpha = 0 .0 5 and dgeree o f freedom = 2 81 Chi-square test show that cash flow patterns and y<ears 1 are independent
APPENDIX.2
T E X T I L E IN D U S T R Y 1
N um ber o f O ccuran ce o f C ash F low Patterns **
V e a r Pattern 1 P attern 2 Pattern 3 P attern 4 Pattern 5 Pattern 6 P attern 7 Pattern 8 Total
1994 3 4 61 13 l[993 2 8 2 1 13 1992 4 4 5 13 1991 1 2 1 1 8 13 1990 3 1 4 1 1 10 T o ta l 1 12 3 21 4 21 0 0 6 2 P e rce n ta g e 1.61% 19.35% 4 .8 4 % 3 3 .8 7 % 6 .4 5 % 3 3 .8 7 % 0 .00% 0.00%
O ccurrence o f C a sh F lo w Patterns with respect to Y e ars
Y e a r 1994 1993 1992 199 1 1990 P a tte r n 1 - - - 7.69 % -P a tte rn 2 2 3 .0 8 % - 3 0 .7 7 % 1 5 .3 8 % 3 0 .0 0 % P a tte rn 3 - 1 5 .3 8 % - - 1 0 .0 0 % P a tte r n
4
3 0 .7 7 % 6 1 .5 4 % 3 0 .7 7 % 7.69% 4 0 .0 0 % P a tte r n5
- 15.3 8 % - 7.69% 10.0 0 % P a tte r n 6 4 6 .1 5 % 7.69% 38.46»/o 6 1 .5 4 % 10.0 0 % P a tte rn 7 - - - - -P a tte r n 8 - - - - -T o ta l 1 0 0 .0 0 % 1 0 0 .0 0 % 1 0 0 .0 0 % 1 0 0 .0 0 % 1 0 0 .0 0 %* For alpha = 0 .0 5 and dgeree o f freedom = 2 8
Chi-square test show that cash flow patterns and years are independent
im T®hle : CASH FLOW STATEMENT Compm> : ADANA ÇİMENTO SANAYİ
Auditor . VEGA BAĞIMSIZ DENETİM DANIŞMANLIK VE YMM A S Indufitn : CEMENT
Unit ; TL NfiOioo
12 ' 1994 12 /1993 12 /1992 12 /1991 12 /1990
CASH AT THE BEGINNING OF THE YEAR ",128 7,033 16,933 1,018 2,176
CASH INFLOWS DURING THE PERIOD 3,176,284 1,176,428 872,672 373,869 201,334
Cash Flow From Sales 2,278,133 761,981 337,479 233,437 179,337
Net Sales Income 2,366,300 1,042,228 633,967 338,814 218,310
Decrease in Trade Recdvables 49,610 30,313 2,376 723 8,467
Increase in Trade Receivables ( - ) 137,777 310,362 78,864 106,080 47,440
Cash From Other Operations 600,673
Cash From Extraordinary Income & Profit 8,313 207,673 93,729 27,311 9,906
Increase in Non-l rade S I' liabilities 183.723 64,601 63,163 28,779 11,976
Isstkc oT Marketable Securities
Other increases 183,723 64,601 63,163 28,779
Increase in LT liabilities 103,440 41,231 29,147 0
Issue of Marketable Securitios
Other increases 103,440 41,231 29,147
Capital Inc'rease 99,918 102,632
Other Cash Inflow 1,024 26,300 64,322 113
CASH OUTFLOWS DURING THE PERIOD 2,626,686 1,176,333 721,744 337,934 202,492
Cash Outflows Related to Costs 1,193,336 338,806 321,868 183,212 123,973
Cost of Goods Sold 1,413,613 631,636 337,391 193,321 122,343
Increase in Inventories 48,033 33,823 32,801 4,426 14,267
Decrease in Trade PayaUes Increase in Trade Payables ( - )
Experves Not Requiring Cash Outflow ( - ) ( includes depreciation ) 268,332 108,673 68,324 14,733 10,639 Decrease in Inventories ( - )
Cash Outflows Related to Operatiitg Expense 338,261 177,707 121,766 74,864 33,786
R A D Expenses
Maitetting Selliitg A Distribution Expenses 217,436 82,336 70,460 36,308 18,167
General Adniirastratrve Expenses 169,644 119,633 73,114 46,311 27,600
Expenses Not Requiring Cash Outflow ( - ) 28,819 24,284 21,808 7,733 11,981
Cash Outflows From Other Operating Expeneses A Losses 13,391 6,093 2,339 974 3,209
Expenses A Losses From Other Operations 13,391 6,093 2,339 974 3,209
Expenses Not Requirirtg Cash Outflow ( -)
Cash Outflows for Financial Expenses 20,090 3,396 3,603 991 228
Cash Outflows from Extraorrfinary Expenses A Losses 38,348 7,891 7,342 141 1,640
Extraordinary Expenses A Losses 38,348 7,891 7,342 141 1,640
Expenses Not Requirirtg Cash Outflow ( -)
Cash Outflows for LT Investments 366,463 231,309 132,333 38,179 8,399
PrinctpaUe Payments of ST Loans 31,339 6,000 193 1,090 29
Marketable Securities
Other 31,339 6,000 193 1,090 29
Principable Payments of LT Loans 337 0 317 0 1,139
Marketable Securities 1,139
Other 337 317
Taxes Paid 113,312 30,630 34,766 23,393 7,198
Dividends Paid 222,730 130,083 37,480 26,236 20,136
Other Cash Outflows 44,439 4,438 19,313 6,874 733
CASH AT THE END OF PERIOD 336,726 7,128 167,861 16,933 1,018
INCREASE ( DECREASE ) IN CASH (= 04-01) 549.398 73 130,928 13,913 (1,138)
CASH FLOW FROM OPERATIONS A C n v m E S 1,040,933 7,139 116,739 (21,922) 12,828
CASH FXOW FROM INVESTING A C n v m E S (391,232) (136,289) (137,296) 22,793 (9,339)
CASH FLOW FROM FINANCING A C IlV m ES 99,893 149,203 171,483 13,044 (4,447)
CASH FLOW PATTERN 4 4 4 3 2
Fin. Table : CASH FLOW STATEMENT Company : AFYON ÇİMENTO SANAYİ TAS Auditor
Industry Unit
KJ>MG CEVDET SUNER DENETİM VE YMM A.S. CEMENT
TL Million
12 /1994 CASH AT THE BEGINNING OF THE YEAR
CASH INI'LOWS DURING THE PliRIOD Cash Flow From Sales
Net Sales Income
Decrease in Trade Receivables Increase in Trade Receivables ( - ) Cash From Other Operations
Cash From Extraordinary Income & Profit Increase in Non-Trade ST Liabilities
Issue of Marketable Securities Other increases
Increase in LT Liabilities Issue of Marketable Securities Other increases
Capital Increase Other Cash Inflow
CASH OU I F LOWS DURING IHE PERIOD Cash Outflows Related to Costs
Cost of Goods Sold Increase in Inventories Decrease in 1 lade Payables Increase in Trade Payables ( - )
Expenses Not Requiring Cash Outflow ( - ) ( includes depreciation ) Decrease in Inventories ( - )
Cash Outflows Related to Operating Expense R & D Expenses
Marketting Selling & Distribution Expenses General Administrative Expenses Expenses Not Requiring Cash Outflow ( - )
Cash Outflows From Other Operating Expeneses & Losses Expenses & Losses From Other Operations
Expenses Not Requiring Cash Outflow ( - ) Cash Outflows for Financial Expenses
Cash Outflows from Extraordinary Expenses & Losses Extraordinary Expenses & Losses
Expenses Not Requiring Cash Outflow ( - ) Cash Outflows for LT Investments Principable Payments of ST Loans
Marketable Securities Other
Principable Payments of LT Loans Marketable Securities Other
Taxes Paid Dividends Paid Other Cash Outflows
CASH AT THE END OF PERIOD
INCREASE ( DECREASE) IN CASH (= 04-01)
CASH FLOW FROM OPERATING ACTIVmES CASH FLOW FROM INVESTING ACTIVITIES CASH FLOW FROM FINANCING ACTIVITIES CASH FLOW PATTERN
78 734,851 517,711 515,559 2,152 104,708 4,280 100.141 100.141 7.123 7.123 888 734,034 338.722 344.722 54,752 6,733 54,019 135,939 109 49,728 86,102 6.867 6.867 96,825 7.945 7.945 58,223 0 833 833 7,638 8,156 72,886 895 817 31,501 (127,684) 97,000 4 12 /1993 12 /1992 12/1991 12 /1990 51 194 335 123 342,301 194,055 114,794 72,840 282,703 171,930 93323 68,322 293,227 171,131 94,409 71,410 799 10,524 1,186 3,088 15,806 2,701 3,067 2,492 376 388 470 247 8,165 0 13,151 1,714 8,165 13,151 23,496 19,036 1,113 23,496 19,036 1,113 9,500 2,255 3,770 64 342,274 194,198 114,935 72,628 156,656 101,133 63,475 43,853 183,636 113,846 61,690 43,382 312 6,887 11,463 4391 1,062 8,195 4,921 2,405 28354 11,405 4,757 1,515 83,875 44,647 25,656 17317 3,670 769 32,573 14309 8,815 6392 47,632 29,569 16,841 10,825 0 0 0 18,906 16,057 5,710 438 1,957 404 138 30 1,957 404 138 30 17,499 15,411 7,881 0 0 0 0 0 0 67 67 533 1,837 5,162 3,348 68 1,916 6,913 3,097 62,780 12,793 3,482 78 51 194 335 27 (143) (141) 212 45376 7,737 (13350) 4,675 (79,605) (28320) (3,780) (3301) 34,056 20340 17,589 (167) 4 4 6 2