www.betam.bahcesehir.edu.tr
Current Account Deficit Increases despite the Slowdown in the
Economy
Zümrüt İmamoğlu* ve Barış Soybilgen
†Executive Summary
Betam forecasts a slow down in the Turkish economy in the first quarter of 2011. According data released by TurkStat IPI increased by 2.3 percent in the first quarter of 2011. This is less than half the increase in the last quarter of 2010 which was 5.5 percent. The change in the import volume index is also down from 10.1 percent in the last quarter to 1.6 percent in the first quarter of 2011. Exports on the other hand decreased in the first quarter by 3.4 percent contributing to the widening of Turkey’s trade deficit.
Betam revised its first quarter growth forecast according to newly released data in May. Betam now expects real GDP to rise 1.6 percent in the first quarter from the previous quarter and by 10.5 percent from the same quarter of the previous year. We think that the slowdown in the first quarter mainly due to the deceleration in investment demand. In fact, the slowdown of imports is also caused by the decreasing pace in imports of investment goods.
* Dr. Zümrüt İmamoğlu, Betam, Research Associate. [email protected]
† Barış Soybilgen, Betam, Research Assistant,
In March, current account deficit and trade deficit both reached an all time high $9.8 billion, bringing the 12 month current account deficit to a mere $60 billion. Following the release of the March data Betam increased its current account deficit forecast for the first quarter of 2011 from 7.2 percent to 7.9 percent of GDP. The high growth in current account deficit is mainly caused by a fall in exports. The reason for this fall is partially the weak demand in Europe and partially the political disturbances and civil unrest in MENA countries.
Table 1. Betam’s quarterly and annual growth forecasts
Source: Betam
*sa: seasonally and calendar day adjusted **ca: calendar day adjusted
First Quarter (2011) Real GDP growth, %
(quarter on quarter, sa*) 1.6
Real GDP growth, %
(year on year, ca**) 10.5
Current account deficit
(% of GDP, annual) 7.9
Economic Outlook and Forecasts:
May 2011
www.betam.bahcesehir.edu.tr Indicators slow down in the first quarter
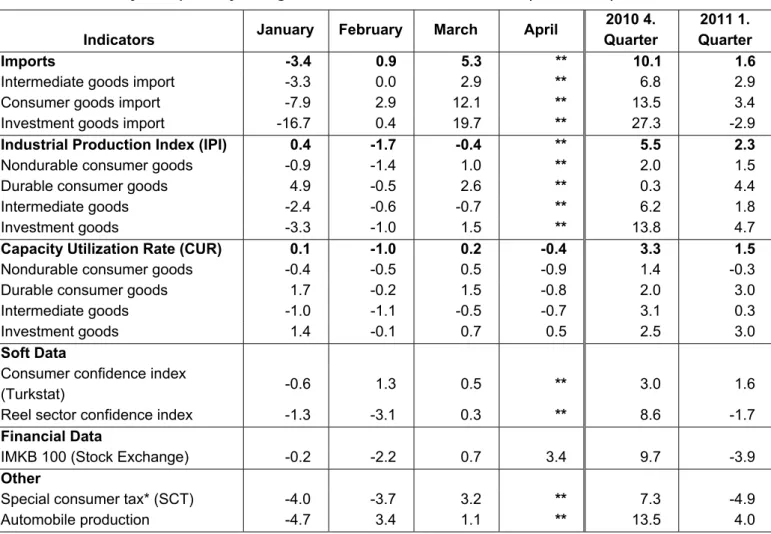
Table 2 lists the monthly indicators Betam follows and their seasonally adjusted monthly and quarterly percentage changes. The increase in all indicators slowed down except the real sector confidence index and the Turkish stock exchange (IMKB) (inflation adjusted) both of which has decreased by 1.7 and 3.9 percent, respectively. These are strong signs of a cooling economy.
Investment indicators
As seen in table 2, the change in IPI and capacity utilization rate (CUR) decreased nearly 50 percent in this quarter compared to last quarter. The increase in IPI and CUR is mainly caused by the increase in production of investment goods and durable goods. Import indicators decelerated more rapidly than IPI and CUR. In the last quarter of 2010, intermediate goods imports increased by 6.8 percent, however in the first quarter it increased by only 2.9 percent. The most abrupt change is seen in imports of investment goods which had increased by 27.3 percent in the last quarter but fell 2.9 percent in the first quarter. Overall, investment indicators signal a slow down.
Consumption indicators
Changes in consumption indicators are similar to that of investment indicators. Imports of consumption goods increased by 3.4 percent in first quarter of 2011, however it had increased by 13.5 percent in last quarter of 2010. Automobile production slowed down as well, increasing by only 4.0 percent in the first quarter. Special consumption tax (SCT) revenue fell 4.9 percent in the first quarter because of the slowdown in imports and consumption. Finally, consumer
confidence index is up by 1.6 percent but down from an increase of 3 percent in the previous quarter.
Foreign trade
Figure 2 shows monthly changes of seasonally adjusted import and export volume indices. In the last quarter exports and imports increased by 5 percent and 10 percent respectively. On the other hand, imports increased 1.6 percent and exports decreased 3.4 percent in the 1st quarter. Persistent trade deficit continued to remain as an important factor in Turkish economy. When nominal exports are analyzed according to regions, only exports to North Africa region decreased in this quarter from the same quarter of previous year. Thus the turmoil in North Africa has adverse effects on Turkish exports. However, the recovery of Turkey’s other export partners will offset the adverse effects of North Africa in the second quarter of 2011.
Current account deficit
In the first quarter, the current account deficit was $22 billion in total, almost half as much as the total in 2010. Current account deficit was especially high in the month of March; $9.8 billion. Although unusual factors such as some foreign banks making dividend payments overseas pushed the current account deficit higher, still the current account figure is above expectations.
Betam increased its current account deficit forecast for the first quarter of 2011 from 7.2 percent to 7.9 percent of GDP. These figures put more pressure on the Central Bank to take more aggressive preventive measures. The Bank’s last round of increases in the reserve requirements
www.betam.bahcesehir.edu.tr
went into effect as of 3rd week of April. Nevertheless, these precautionary measures may not be enough to reduce the current account deficit. If the foreign investors’ risk appetite is adversely affected by Turkey’s high current account deficit, outflow of short term funds can lead to a depreciation of the Turkish lira, which in turn can give the Central Bank some room for interest rate hikes.
Forecasts
Betam releases its GDP and current account forecasts on a monthly basis and revises its forecasts every month after release of new data. Table 1 summarizes Betam’s year-on-year and quarter-on-quarter forecasts of real GDP growth. We expect the real GDP to grow by 1.6 percent in the first quarter of 2011 from the previous quarter and by 10.5 percent in the first quarter from same quarter of the previous year.
www.betam.bahcesehir.edu.tr
Table 2. Monthly and quarterly changes of Betam’s selected indicators (real and sa) Indicators January February March April
2010 4. Quarter
2011 1. Quarter
Imports -3.4 0.9 5.3 ** 10.1 1.6
Intermediate goods import -3.3 0.0 2.9 ** 6.8 2.9
Consumer goods import -7.9 2.9 12.1 ** 13.5 3.4
Investment goods import -16.7 0.4 19.7 ** 27.3 -2.9
Industrial Production Index (IPI) 0.4 -1.7 -0.4 ** 5.5 2.3
Nondurable consumer goods -0.9 -1.4 1.0 ** 2.0 1.5
Durable consumer goods 4.9 -0.5 2.6 ** 0.3 4.4
Intermediate goods -2.4 -0.6 -0.7 ** 6.2 1.8
Investment goods -3.3 -1.0 1.5 ** 13.8 4.7
Capacity Utilization Rate (CUR) 0.1 -1.0 0.2 -0.4 3.3 1.5
Nondurable consumer goods -0.4 -0.5 0.5 -0.9 1.4 -0.3
Durable consumer goods 1.7 -0.2 1.5 -0.8 2.0 3.0
Intermediate goods -1.0 -1.1 -0.5 -0.7 3.1 0.3
Investment goods 1.4 -0.1 0.7 0.5 2.5 3.0
Soft Data
Consumer confidence index
(Turkstat) -0.6 1.3 0.5 ** 3.0 1.6
Reel sector confidence index -1.3 -3.1 0.3 ** 8.6 -1.7
Financial Data
IMKB 100 (Stock Exchange) -0.2 -2.2 0.7 3.4 9.7 -3.9
Other
Special consumer tax* (SCT) -4.0 -3.7 3.2 ** 7.3 -4.9
Automobile production -4.7 3.4 1.1 ** 13.5 4.0
Source: TurkStat, TCMB, Treasury, IMKB, Betam. All series are real (or inflation adjusted) wherever necessary and seasonally adjusted. *This tax is collected on sales of goods such as gas, fuel oils, alcohol, tobacco products and automobiles.
www.betam.bahcesehir.edu.tr Figure 1: Capacity utilization rate and
industrial production index (sa, left axis for CUR and right axis for IPI)
60 65 70 75 80 85 Ja n-07 A pr-0 7 Ju l-0 7 Oc t-07 Ja n-08 A pr-0 8 Ju l-0 8 Oc t-08 Ja n-09 A pr-0 9 Ju l-0 9 Oc t-09 Ja n-10 A pr-1 0 Ju l-1 0 Oc t-10 Ja n-11 A pr-1 1 95 100 105 110 115 120 125 130 CUR IPI
Source : TurkStat, Betam
Figure 2: Volume indices of exports and imports (sa) 120.00 130.00 140.00 150.00 160.00 170.00 180.00 190.00 200.00 210.00 Jan-07 May -07 S ep-07 Jan-08 May -08 S ep-08 Jan-09 May -09 S ep-09 Jan-10 May -10 S ep-10 Jan-11 Export Import
Source : TurkStat, Betam
Figure 3: Ratio of current account deficit to GDP (yearly)
Current Account Deficit (% of GDP)
0.0 1.0 2.0 3.0 4.0 5.0 6.0 7.0 8.0 9.0 2007 Q 4 2008 Q 1 2008 Q 2 2008 Q 3 2008 Q 4 2009 Q 1 2009 Q 2 2009 Q 3 2009 Q 4 2010 Q 1 2010 Q 2 2010 Q 3 2010 Q 4 2011 Q 1
www.betam.bahcesehir.edu.tr Figure 4: Monthly changes of manufacturing industry exports (sa)
February 2011 -20.00% -15.00% -10.00% -5.00% 0.00% 5.00% 10.00% F ood p roduc ts and bev erages T abac co produc ts T ex til e g oods C lot hi ng goods F ur s l eat her and produc ts W ood and c ork produc ts P aper an d pap er produc ts C ok ing c oal , re fine d pe t. C hem ic al s P las tic and r ubb er pr od uc ts O ther non-m et al lic m ineral prod. M et al indus tr y M et al p roduc ts (not m ac h. ) M ac hi ner y and equi pm ent E lec tr ic al ma ch in ar y R adi o, t el ev is ion and c om m . M ot or v ehi cl es and t rai le rs F urni ture and ot her p roduc ts March 2011 -15.00% -10.00% -5.00% 0.00% 5.00% 10.00% F oo d pr oduc ts and b ev er ag es T abac co pr odu ct s T ex til e goods C lot hi ng goods F ur s l eat her and pr oduc ts Wood and co rk pr oduc ts P aper and paper pr oduc ts C oki ng co al , re fined pet . C hem ic al s P las tic and rubber pr oduc ts O the r no n-m et al lic m iner al pr od. Me ta l in du st ry M et al pr oduc ts (not m ac h. ) M ac hi ner y and equ ip m ent E lec tr ic al m ac hi nar y R ad io , t el evi si on and c om m . M ot or v ehi cl es and t rai le rs F urn iture an d ot her pr oduc ts