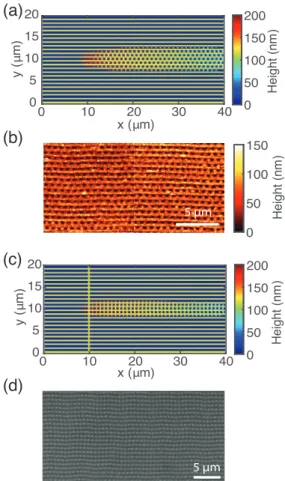
Highly stable periodic structures using nonlinear laser lithography
Tam metin
Şekil
Benzer Belgeler
For any finite normal form game, the set of correlated CPT equilibria includes the set of probability measures induced by the convex hull of the set of pure strategy Nash
Additional changes are introduced to the time paths of factor supplies and other variables, as factor prices and incomes are allowed to vary along with the changes in the
(4) High shear strength joints were fractured at the interface of the brazed alloy with substrate mainly in the Ag–Zn solid solution matrix and the fracture morphology for those
In terms of pairwise comparisons, for both point and interval forecasts, the group who believed that they had received forecasting advice from a financial expert made larger
This thesis focuses on the increasing plastic waste problem in the marine environment and it tries to create an artistic reflection with the Cyanotype photographic technique in
Due to the very high absorptance of GaN layers, the efficiency performance of GaN Schottky PDs with suffi- ciently thick 共⬎200 nm兲 absorption layers is limited by the transmittance
ITO-Schottky photodiodes with ~80 nm thick ITO films resulted in a maximum quantum efficiency of 47%, whereas Au-Schottky photodiode samples with ~10 nm thick Au films displayed
We have measured and analyzed the temporal pulse responses as a function of applied reverse bias voltage, active device area, measurement wavelength, and Schottky contact
