INTRODUCTION
Nanotechnology is one of the most important new targets of science and technology. Nanotechnology is formation of 100 nm sized particles and provides significantly changeable featured different materials. More excellent featured structures can be synthesized. Arising of some disciplinary like nanoengineering [1], nanoelectronic [2], and nanobioelectronic [3] forced the synthesis of suitable sized and functional block structures. This necessity was encouraged to enhance angstrom and nanosized features of substances. Colloids and
aggregate science word has been started to make and organize nanosized particles at this subject [4]. Most of these particles have been known for several years. By the developing of some instruments for particle characterisation, new disciplinary has been come out for nanoparticles and nanocrystal materials.
Nanoparticles are not only excellent materials by structural features but also by functional features. It can be provided changing of functional properties by using various methods beside bulky properties. Electronic [5], optic [6] and catalytic [7] properties of nanoparticles have grew out of their quantum levelled size. Nanosized particles have become important employability in modern technology systems due to their high surface area, different optic and optical properties. Nanoparticles have
HACETTEPE JOURNAL OF BIOLOGY AND CHEMISTRY Research Article
Hacettepe J. Biol. & Chem., 2009, 37 (3) 217-226
* Correspondence to: Hakan Ayhan,
Mugla University, Faculty of Science and Art, Department of Chemistry, Biochemistry Division 48170 Kötekli, Mugla, Turkey Tel: +90252 211 1506
E-mail: [email protected]
Gold Nanoparticle Synthesis and Characterisation
Amir Tabrizi1, Fatma Ayhan2, Hakan Ayhan2*
1Hacettepe University, Institute of Pure and Applied Science, Bioengineering Division, Ankara, Turkey. 2Muğla University, Chemistry Department, Biochemistry Division, Muğla, Turkey
Article Info Abstract
Article history: Received
January 25, 2009 Received in revised form March 21, 2009 Accepted
April 12, 2009 Available online
September 9, 2009
The aim of this study is to synthesize and characterize gold nanoparticles. For this purpose, the reduction reaction between tetrachloroauric acid and sodium citrate was used. At the end of the reduction reaction, gold nanoparticles with narrow size distribution were obtained. The initial gold concentration, trisodium citrate concentration and mixing rate were changed and their effects on particle size and size distribution were investigated. The optimal gold salt concentration, trisodium citrate concentration and mixing rate were found 0.06 mM, 0.17 mM and 450 rpm, respectively. Zeta sizer has been used to characterize and determine the size and size distribution of the synthesized gold nanoparticles.
Key Words
Gold nanoparticles, Synthesis,
Characterization.
---'-been produced for various applications like polymeric PS, PMMA [8], inorganic PbS, Ag2S,
CdSe, TiO2 [9] and Au, Ag etc [10]. These
nanoparticles can be produced by basic systems like microemulsion, reverse micelle formation, electro deposition etc. These nanoparticles can be replaced to substrate surfaces like Au, Al, glass, silica etc. by physical, chemical or replacement by themselves methods to formation of regular nano orderly structures. The surface can be modified interspace of metal nanoparticles. Gold nanoparticles are the most suitable for this purpose.
Quartz crystal microbalance (QCM) sensors have been used by growing rate in recent years. It´s because the system so cheap and movable. Quartz crystals which they have metallic electrode (Au, Ag, etc.) are used [11]. Due to piezoelectric properties of these crystals, accumulation of mass on these crystals changes the oscillation frequency of crystal. By this drifting frequency, mass on this surface can be measured quantitatively [12]. Biological molecules (ssDNA, antibodies, etc.) bind to crystal surface as ligand in QCM systems. Biosensors have expanded to determine these targets pair biological molecules. Measured drifting frequency is low because there is surface area limitation and this cause mistake [13].
The submitted work investigates gold nanoparticles synthesis by reduction reaction between tetrachloroauric acid and trisodium citrate. The dependence of nanoparticle size and size distribution were tested by changing the initial concentrations of gold salt, trisodium citrate and mixing rate. The colloid suspensions were characterized by zeta sizer measurements.
MATERIALS and METHODS
In this work, gold nanoparticle synthesis was achieved. The synthesis parameters, gold salt concentration, sodium citrate concentration and mixing rate effect to nanoparticle size were investigated.
Gold Nanoparticles Synthesis
In this study, gold nanoparticles were synthesized as mentioned in the literature [14]. Briefly, gold chloroauric asid salt (H[AuCl4]) was used as gold
salt in the experiments. Trisodium citrate (Na3C6H5O7.2H2O) was used as reducing agent.
Gold salt was mixed and boiled to the boiling point (97.5°C) at prepared concentration to start the synthesis reaction. Gold salt was yellow at that time. After adding the prepared sodium citrate to the solution, sodium citrate turned to citric acid. At that stage yellow coloured solution suddenly became transparent and colourless. It changed to black and after than slowly to wine red [15]. The solution was kept on mixing at all the colour changing stages and it was kept on hot surface. When the colour changing was end gold particle solution was kept on mixing and to cooling. Gold salt synthesis was concluded at this point.
Gold nanoparticle synthesis is given above. The pH value of red wine coloured solution was measured and the nanoparticles were characterized by zeta sizer to determine electrical charge, size and size distributions (ZETA Sizer, 3000 HSA, Malvern-England).
Gold Salt Concentration effect
In this part of the study, the gold salt initial concentration effect was investigated. Gold salt solution was mixed with deionised water (pH 7.2) at 2HAuCl4+ 3C6H8O7(citric acid) → 2Au + 3C5H6O5(3-ketoglutaric acid) + 8HCl + 3CO2
different ratios (gold salt/water ratio 1/10-1/1 w/v). So, gold salt concentrations were changed from 0.03 mM to 0.3 mM (0.03, 0.0375, 0.05, 0.06, 0.075, 0.10, 0.15, 0.30 mM). The reducing agent concentration (sodium citrate, 0.17 mM) and mixing rate (450 rpm) were kept constant during synthesis experiments.
Sodium Citrate Concentration effect
The effect of sodium citrate (Figure 1) which was used as reducing agent to the nanoparticle size was investigated in this part of the study. As mentioned in literature, sodium citrate has important effects on the synthesis of nanoparticles [16]. Sodium citrate concentration was changed from 0.01 mM to 0.50 mM (0.010, 0.025, 0.050, 0.075, 0.10, 0.15, 0.25, 0.35, 0.50). Gold salt concentration (0.06 mM), sodium citrate/water ratio (1/5) and mixing rate (450 rpm) were kept constant during experiments.
The Mixing Rate Effect to the Nanoparticle Size
In this part of the study, the mixing rate effect to the nanoparticle size and size distribution was investigated. For this purpose, the mixing rate was changed from 300 to 800 rpm (300, 400, 500, 600, 800 rpm). Other parameters, such as gold salt
concentration and sodium citrate concentration, were kept constant as 0.06 mM and 0.17 mM, respectively.
All the synthesis reactions were followed for colour formation and pH value.
Gold Nanoparticle Characterization
Relationship between particle size and colour was observed by transparency and turbidity. Turbid solutions indicate aggregate formation of different sizes. Nanoparticle formations were detected by transparency observations and red wine coloured solutions. Particle size and size distribution of synthesised gold nanoparticles were determined by using Zeta-sizer. The synthesized gold nanoparticles were imaged by scanning electron microscope (SEM, JEOL, JSM-6490, USA).
RESULTS and DISCUSSIONS
Gold Nanoparticle Synthesis
Effect of Initial Gold Salt Concentration
The reduction reaction of gold salt (HAuCl4) with
citric acid results with the formation of 3-ketoglutaric acid. In this reduction reaction, gold salt concentration which initially reacts with AuCl
-amount is important factor to the reduction process by citrate ions [17]. Initial gold salt concentration was changed between 0.03 mM and 0.3 mM and the results were given in Table 1. The sodium citrate concentration and mixing rate were kept constant as 0.17 mM and 450 rpm, respectively.
Optimal gold salt concentration range for gold nanoparticle synthesis was found as 0.05-0.1 mM (1/6-1/3 HAuCl4/water ratio). In these conditions, the gold nanoparticle size was in the range of 23-120 nm. High gold salt concentrations cause aggregate Figure 1. Chemical structure of trisodium citrate.
2HAuCl4+ 3C6H8O7(citric acid) → 2Au + 3C5H6O5(3-ketoglutaric acid) + 8HCl + 3CO2
H.
+
o
Na
o
+formation and leads to turbid solutions. Otherwise, micron size gold particles were obtained in low initial gold salt concentrations.
It was reported that the average diameter and the character of the distribution curve changed with preparative conditions such as concentration and ratio of reactants. Three different gold concentrations gave different particle size distribution curves [18]. In another study, the monodisperse nanogolds with different particle sizes were obtained by the same procedure with different amounts of citrate [19]. The colloidal gold was prepared by reduction of HAuCl4(2 wt %) by sodium citrate aqueous solution (2 wt %) and the obtained particles have diameters as 12, 18, 24, 30, 46, 61, and 65 nm according to transmission electron microscopy results. In another study, the molar ratios of HAuCl4/Na3citrate were 0.30, 0.75, 1.00, and 1.51, respectively. The diameters of the colloidal nanoparticles were measured by using transmission electron microscopy as 16 ± 2.3 nm, 24 ± 2.1 nm, 42 ± 2.6 nm and 51 ± 5.3 nm, respectively [17].
Effect of Initial Sodium Citrate Concentration
Sodium citrate turns to citric acid after hydrolysis in water and is used as reduction agent in the
nanoparticle synthesis reaction. Citrate ions in medium cause reduction of tetrachlouric (AuCl4) to monochlouric (AuCl-) ions.
The sodium citrate concentration was changed in the range of 0.01 mM-0.5 mM and the results were obtained as given in Table 2. Other parameters, initial gold salt concentrations and mixing rate were used as 0.06 mM and 450 rpm, respectively.
It can be seen from the Table 2, the synthesis reaction wasn’t realized at low sodium citrate concentrations. Probably, citrate ions couldn’t be high enough to reduce gold ions. While sodium citrate concentration is rising reduction reactions realised. Sodium citrate amount is an important parameter for gold nanoparticle synthesis as depicted in literature [15].
The aggregate formation was observed in 0.075 and 0.1 mM sodium citrate concentrations. This result also confirms that the citrate concentration is again not enough. When salt concentration was between 0.15 and 0.5 mM, gold nanoparticle formation was realised. But, desired nanoparticle size was synthesized at 0.15 and 0.25 mM sodium citrate concentrations. The average of these two sodium Table 1. The effect of different gold salt concentration to particle size.
Gold salt / water ratio Gold Salt (mM) pH Size (nm) Size distribution (nm) Appearance
1/10 0.030 5.83 micro particle - Transparent
1/8 0.038 5.68 micro particle - Transparent
1/6 0.050 5.72 120 ± 12 84.6↔130.1 Transparent 1/5 0.060 3.32 23 ± 2.3 19.4↔30.8 Transparent 1/4 0.075 3.35 48 ± 4.8 33.7↔50.3 Transparent 1/3 0.10 3.30 80 ± 8.0 61.0↔101.6; 237.0↔281.9 Transparent
1/2 0.15 2.34 aggregate formation - Turbid
1/1 0.30 1.98 aggregate formation - Turbid
*Sodium citrate concentration (0.17 mM)
citrate concentrations was used throughout the research.
Metal nanoparticles can be synthesized by the use of reducing agents like sodium citrate, borohydrate, and alcohols. But, sodium citrate is the most common one [15]. It was reported that nearly monodispers particles were synthesized by citrate reduction while particle size was controlled by initial reagent concentration [20]. The dependence of nanoparticle diameter on citrate concentration in the reductive synthesis of gold nanoparticles was investigated by the addition of trisodium citrate solution (1% aqueous solution) to 50 mL of 0.01 % H[AuCl4]. The nanoparticle diameter was obtained in the range of 16-147 nm when added amount was changed from 1.0 to 0.16 mL.
Effect of Mixing Rate
Particle size and size distribution were also affected by mixing rate. In this part of the study, the effect of mixing rate to particle size and size distributions was investigated. The obtained results were given in Table 3. Gold salt concentration and sodium citrate concentration were fixed on 0.06 mM and 0.17 mM, respectively. The mixing rate was changed from 300 to 800 rpm.
Nanoparticle formation was observed for all mixing rates, but, larger size distribution occurred. The narrow size distribution was found at 400, 450, and 500 rpm. Thus, the mixing rate, 450 rpm, was used throughout the research. High mixing rates resulted very small nanoparticle size, but, size distribution gets larger. The mixing rate effect was also investigated in details by another study [21]. Table 2. The change of particle formation with sodium citrate concentration.
Sodium citrate (mM) pH Size (nm) Size distrubition (nm) Appearance
0.010 1.98 no synthesis
0.025 2.15 no synthesis
0.050 2.49 no synthesis
0.075 2.82 aggregate formation - Turbid
0.10 2.88 aggregate formation - Turbid
0.17 3.18 25.0 ± 2.3 19.4↔30.8 Transparent 0.25 3.35 35.3 ± 3.5 33.7↔50.3 Transparent 0.35 4.27 37.4 ± 3.7 26.5↔42.0; 330.0↔529.2 Transparent 0.50 4.79 50.4 ± 5.0 6.0↔8.0; 40.0↔60.4; 100.5↔159.3 Transparent
Gold Salt Concentration (0.06 mM)
Table 3. The effect of mixing rate to particle size*
Mixing Rate (rpm) pH Size (nm) Size Distribution (nm) Appearance
300 2.96 42.0 ± 4.2 26.5↔52.9; 333↔528 Transparent 400 3.22 25.9 ± 2.5 13.0↔32.6; 41.1↔81.9 Transparent 450 3.18 25 ± 2.3 19.4↔30.8 Transparent 500 3.08 16.3 ± 1.6 10.3↔31.1; 40.0↔71.9 Transparent 600 3.00 4.2 ± 0.4 1.5↔4.2; 20.9↔126.4 Transparent 800 3.07 3.2 ± 0.3 2.6↔4.1; 8.2↔12.9; 51.5↔81.7; 205.2↔258.9 Transparent
*Gold salt concentration (0.06 mM), sodium citrate concentration (0.17 mM).
Colloidal gold nanoparticles were prepared by mixing of the reactants at high temperatures. It was indicated that vigorous mixing needs to be applied [14].
The final pH value of reduction reaction is a highly important parameter for particle size formation and size distribution. As can be seen from the three tables, pH 3 was accepted as the end of reduction reaction and synthesis.
ZETA Sizer Results
The analysis that was performed with Zeta sizer gives the particle size and size distribution. Zeta potentials of nanoparticles were also measured in the same manner. The peak number, peak area, and peak amplitude gives important explanation for size and size distribution of nanoparticles. If there is one peak Zeta sizer shows real size average of particles. If there is more than one peak at Zeta sizer distribution should be considered for the size of particles.
The negative charge was also another important indicator of particle size. Zeta potential measurements at the end of the reduction reaction were negative because of citrate ions. Hence, the nanoparticle size diameters small than 100 nm were obtained in the research. The zeta potentials of the nanoparticles synthesized in the scope of this study was obtained between -4 and -5 mV. The results were also compatible with the literature results [16, 20].
Effect of Initial Gold Salt Concentration
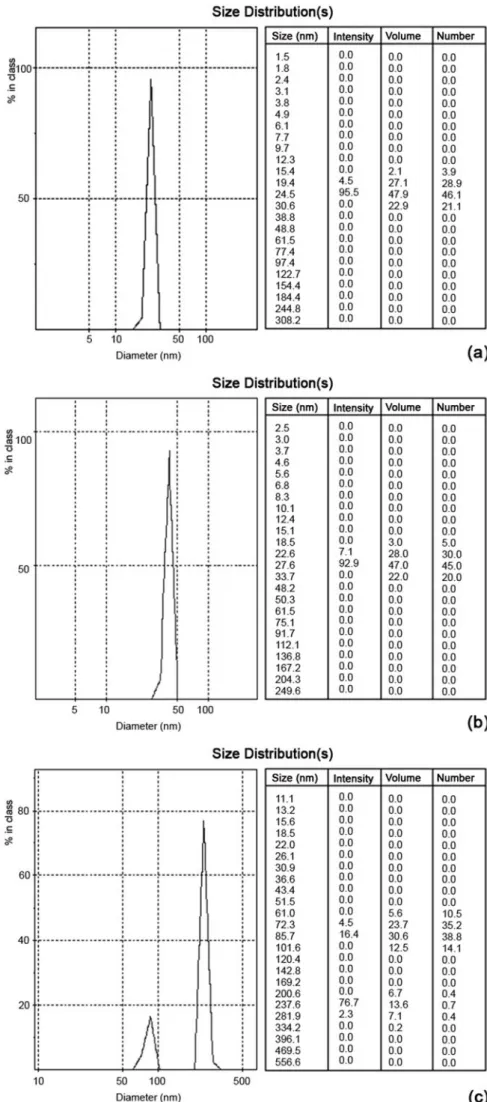
Gold synthesis reaction was performed for gold salt concentrations from 0.03 mM to 0.3 mM. The sodium citrate concentration and mixing rate were 0.17 mM and 450 rpm, respectively. The analysis results were given in Figure 2 for 1/5, 1/4, and 1/3 HAuCl4/water ratios. When 1/5 ratio was used particle size of 24.5 nm with 95.5 % intensity was
obtained (Figure 2a). The particle size of 48.2 nm with 92.9% intensity was found for 1/4 ratio (Figure 2b). Size distribution was not observed for both AuCl4concentrations.
In Figure 2c, the nanoparticle size formation was detected around 85.7 and 237.8 nm. The intensities were 16.4% and 76.7% which indicate size distribution. As a result, the initial gold salt concentration of 0.06 mM gives the best nanoparticle formation while other parameters were kept constant as indicated before.
Effect of sodium citrate concentration
The sodium citrate concentration was changed between 0.01 mM and 0.5 mM and initial gold salt concentration and mixing rate were used as 0.06 mM and 450 rpm, respectively.
The results indicate that no synthesis or aggregate formation occurred when the sodium citrate concentration was lesser than 0.17 mM. On the other hand, size distribution was observed when the concentration was higher than 0.25 mM.
Figure 3a shows the nanoparticle formation when 0.25 mM sodium citrate was used. The zeta sizer result indicates that the nanoparticles with sizes as 33.7 and 41.2 nm were obtained with 7.1 and 92.9 % intensity, respectively. When sodium citrate concentration was increased to 0.35 mM, better size distribution occurred. The nanoparticles with the sizes of 33.3, 42 and 420 nm were formed with different intensities. The analysis for 0.17 mM resulted with particle size of 24.5 nm with 95.5% intensity (Figure 2a). This concentration was selected as optimum condition for sodium citrate. H.
Figure 2. Effect of gold salt concentration onto particle size (a) 0.06 mM, (b) 0.075 mM, (c) 0.1 mM. H. Size Distribution(s) Size (nm) !:1100 ···: ••·••:••···••:••·••:••··· 1.5 1.8
"
.
. .
: :.
: :.
.
2.4 '.
.
.E 3.1 '.
.
. .
.
3.8. .
..
'.
.
4.9 '.
.
.
6.1.
..
.
.
.
7.7.
.
.
.
9.7 . ..
..
.
12.3.
.
.
.
15.4.
. . ..
.
19.4.
.
50 __ ,. _____ ... ;. ... ;. ... ; .. - ... . 24.5 30.6 38.8 48.8 61.5 77.4 97.4 122.7 154.4 184.4 244.8 308.2 5 10 50 100 Diameter (nm) Size Distribution(s) !:! 100"
.s "$. 50 ... ··•·· .•••. 10 -. --- -· ---;- ·-----y---·---/
50 100 Diameter (nm) Size (nm) 2.5 3.0 3.7 4.6 5.6 6.8 8.3 10.1 12.4 15.1 18.5 22.6 27.6 33.7 48.2 50.3 61.5 75.1 91.7 112.1 136.8 167.2 204.3 249.6 Size Distribution(s) !:! 80 ;,.. ... ,.; ... ;. ... ; .... ."
.s "$. 60 ~----·-. ---·- ----
-i--
.
-
--
-
·
t-
---
-
---
. -
--
----
· !---' 40 :--- -· --- -·---~---~---· --- ----~--20 ~---·---~---·:--- -- ---~--• 1 1 1.
. . ' ' ' ' '.
' ' 10 50 100 500 Diameter (nm) Size (nm) 11.1 13.2 15.6 18.5 22.0 26.1 30.9 36.6 43.4 51.5 61.0 72.3 85.7 101.6 120.4 142.8 169.2 200.6 237.6 281.9 334.2 396.1 469.5 556.6lntensity Volume Number
O.O O.O O.O O.O O.O O.O O.O O.O O.O O.O O.O O.O O.O O.O O.O O.O O.O O.O O.O O.O O.O O.O O.O O.O O.O O.O O.O O.O O.O O.O O.O 2.1 3.9 4.5 27.1 28.9 95.5 47.9 46.1 O.O 22.9 21.1 O.O O.O O.O O.O O.O O.O 00 O.O O.O O.O O.O O.O O.O O.O O.O O.O O.O O.O O.O O.O O.O O.O O.O O.O O.O O.O O.O O.O O.O O.O (a)
lntensity Volume Number
O.O O.O O.O O.O O.O O.O O.O O.O O.O O.O O.O O.O O.O O.O O.O O.O O.O O.O O.O O.O O.O 00 O.O O.O 00 O.O O.O 00 O.O O.O O.O 3.0 5.0 7.1 28.0 30.0 92.9 47.0 45.0 O.O 22.0 20.0 o.o O.O O.O o.o O.O O.O 00 O.O O.O O.O O.O O.O O.O O.O O.O O.O O.O O.O O.O O.O O.O O.O O.O O.O O.O O.O O.O O.O O.O O.O (b)
lntensity Volume Number
00 O.O O.O O.O O.O O.O 00 O.O O.O O.O O.O O.O O.O O.O O.O O.O O.O O.O O.O O.O O.O O.O O.O O.O O.O O.O O.O O.O O.O O.O O.O 5.6 10.5 4.5 23.7 35.2 16.4 30.6 38.8 O.O 12.5 14.1 O.O O.O O.O O.O O.O O.O O.O O.O o.o o.o 6.7 0.4 76,7 13.6 0.7 2.3 7.1 0.4 O.O 0.2 O.O O.O O.O O.O O.O O.O O.O O.O O.O O.O (c)
Effect of mixing rate
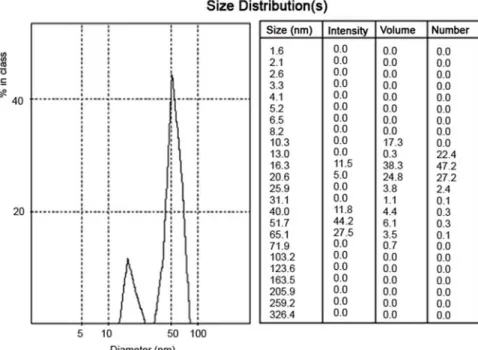
In order to investigate the mixing rate effect on the nanoparticle formation and size distribution, the mixing rate was changed from 300 to 800 rpm. The gold salt concentration and sodium citrate concentration were kept constant as 0.06 mM and 0.17 mM, respectively. When mixing rate was 300 rpm, the synthesized nanoparticles have size distribution such as 42 and 420.3 nm (figure not given) with 51.7 and 23.4% intensity, respectively. In the case of 600 and 800 rpm mixing rates, size and size distribution interval gets larger (figure not given). The nanoparticle size was measured as 16.3
and 51.7 nm with 11.5 and 44.2% intensities for 400 rpm (Figure 4). On the other hand, the size was determined as 15.5 and 55.2 nm with 14.2 and 46.8% intensities for 500 rpm (figure not given). But, in order to overcome size distribution, the mixing rate of 450 rpm was tested and found as optimum mixing rate. Figure 2b depicts the zeta sizer results for this value.
CONCLUSION
This research investigated the synthesis parameters Figure 3. Effect of sodium citrate concentration onto particle size (a) 0.25 mM (b) 0.35 mM.
H. Size Distribution(s) ğj 100 •.• ·••·
+
·
..
··+ ·· ...
....
.
·
·
+···
·
·+··
.
... .
ı:ı : : : : .s '$. t 1 1 1 t t 1 1.
1.
t.
1.
1.
t.
t.
1.
1 f f 1 1.
1.
f.
1.
1.
f.
f.
1.
1 t t 1 1.
1.
.
f.
.
1.
1.
.
. .
.
.
'.
.
.
.
.
.
.
. .
1 t 1 1 50 ····:····••-.•··· . : ... :···-····.
' '.
' ' . . ..
' ' . . 5 10 '/
50 100 Diameter (nm) Size (nm) 2.5 3.0 3.7 4.6 5.6 6.8 8.3 10.1 12.4 15.1 18.5 22.6 27.6 33.7 41.2 50.3 61.5 75.1 91.7 112.1 136.9 167.2 204.3 249.6 Size Distribution(s) 60 ···-··· •.•.••.•.•.•.•.•.•.•.•..•.•..•..•. 40 ···~·-··· 20 ... ~--··· 5 10 ., _____ ··-·-·--·-···· ' ----·•·--· ... . 'l
50 100 Diameter (nm))
500 Size (nm) 2.6 3.3 4.2 5.3 6.6 8.4 10.5 13.3 16.7 21.0 26.5 33.3 42.0 52.9 66.6 83.8 105.5 132.6 167.3 210.6 265.1 333.6 420.3 529.2lntensity Volume Number
O.O O.O O.O O.O O.O O.O O.O O.O O.O O.O O.O O.O O.O O.O O.O O.O O.O O.O O.O O.O O.O O.O O.O O.O O.O O.O O.O O.O O.O O.O O.O O.O O.O O.O O.O O.O O.O 3.0 5.0 7.1 28.0 30.0 92.9 47.0 45.0 O.O 22.0 20.0 00 O.O O.O O.O O.O O.O O.O O.O O.O O.O O.O O.O O.O O.O O.O O.O O.O O.O O.O O.O O.O O.O O.O O.O (a)
lntensity Volume Number
O.O O.O O.O O.O O.O O.O O.O O.O O.O O.O O.O O.O O.O O.O O.O O.O O.O O.O O.O O.O O.O 00 O.O O.O 00 O.O O.O 00 O.O O.O O.O 10.4 15.3 20.6 33.9 40.3 51.7 36.7 34.7 O.O 13.1 9.7 o.o O.O O.O o.o O.O O.O 00 O.O O.O O.O O.O O.O O.O O.O O.O O.O O.O O.O O.O O.O O.O 4.4 1.5 O.O 23.4 2.9 O.O O.O 1.5 O.O (b)
of gold nanoparticles and the effect of experimental parameters on size and size distribution. It was found that initial gold salt concentration and trisodium citrate concentrations and mixing rate are very important variables in the colloid nanoparticle synthesis. The applications of gold nanoparticles are highly extensive as conductive material in sensors and/or biosensors. Narrow size distribution and small monosize gold nanoparticles also offer advantages for self-assembled monolayer formation and enhanced surface area.
REFERENCES
1. Nanosystems, Molecular, Machinery, Manufacturing and
Computation (Ed.: K. E. Drexler), Wiley, New York, 1992.
2. DeSilva, A.P., Gunaratne, H.Q.N., McCoy, C.P., A
molecular photoionic and gate based on fluorescent signalling, Nature, 364, 42, 1993.
3. Göpel, W. Bioelectronics and nanotechnologies, Biosensors and Bioelectronics, 13, 723, 1998.
4. Clusters and colloids. From Theory to Applications.
Schmid, G. (Ed.), VCH Verlagsgesellschaft, Weinheim, 1994.
5. Khairutdinov, R. F. Physical chemistry of nanocrystalline semiconductors, Colloid J. 59 (5), 535-548, 1997.
6. Mulvaney, P., Surface Plasmon Spectroscopy of Nanosized Metal Particles, Langmuir, 12, 788-800, 1996. 7. Lewis, L.N., Chemical catalysis by colloids and clusters,
Chem. Rev., 93, 2693-2730, 1993.
8. Fu-Ken, L., Aqueous-Organic Phase Transfer of Gold
Nanoparticles and Gold Nanorods Using an Ionic Liquid J. Am. Chem. Soc., 126, 5036-5037, 2004.
9. Meldrum, F.C., Flath, J., Knoll, W., Chemical Deposition of PbS on a Series of w-Functionalised Self-Assembled Monolayers, J. Mater. Chem., 9, 711-723, 1999.
10. Link, S., Size and Temperature Dependence of the Plasmon Absorption of Colloidal Gold Nanoparticles, J. Phys. Chem. B, 103, 4212-4217, 1999.
11. Han, S., Lin, J., Satjapipat, M., Baca, A.J., and Zhou, F., A Three-dimensional Heterogeneous DNA Sensing Surface Formed by Attaching Oligodeoxynucleotide-Capped Gold Nanoparticles onto a Gold Coated Quartz Crystal, Chem. Commun., 7, 609–610. 2001.
12. Yamaguchi, S., and Shimomura, T., Adsorption, Immobilization, and Hybridization of DNA Studied by the Use of Quartz Crystal Oscillators, Anal. Chem., 65, 1925-1927, 1999.
13. Zhou, X.C., Huang, L.Q., Li, S.F.Y., Microgravimetric DNA sensor based on quartz crystal microbalance: comparison of oligonucleotide immobilization methods and the application in genetic diagnosis, Biosens. Bioelectron., 16(1-2), 85-95, 2001.
Figure 4. Effect of the mixing rate (400 rpm) onto the particle size.
H. Size Distribution(s)
i
ı:ı .s '$. 40 ! ! '.
' 1 1 , 1 20 ...... , ... ~ ... ~--... ~ ... . ~ I ' ' 10 50 100 Diameter (nm) Size (nm) 1.6 2.1 2.6 3.3 4.1 5.2 6.5 8.2 10.3 13.0 16.3 20.6 25.9 31.1 40.0 51.7 65.1 71.9 103.2 123.6 163.5 205.9 259.2 326.4 lntensity Volume Number O.O O.O O.O O.O O.O O.O O.O O.O O.O O.O O.O O.O O.O O.O O.O O.O O.O O.O O.O O.O O.O O.O O.O O.O O.O 17.3 O.O 00 0.3 22.4 11.5 38.3 47.2 5.0 24.8 27.2 O.O 3.8 2.4 O.O 1.1 0.1 11.8 4.4 0.3 44.2 6.1 0.3 27.5 3.5 0.1 O.O 0.7 O.O O.O O.O O.O O.O O.O O.O O.O O.O O.O O.O O.O O.O O.O O.O O.O O.O O.O O.O14. Huang, H., Yang, X., Chitosan Mediated Assembly of Gold Nanoparticles Multilayer, Coll. Surf. A: Physicochem. Eng. Aspects, 226, 77–86, 2003.
15. Shipway, A.N., Katz, E., Willner, I., Nanoparticle Arrays on Surfaces for Electronic, Optical, and Sensor Applications, ChemPhysChem, 1, 18-52, 2000.
16. Nagasaki, Y., Kataoka, K., Ligand-installed PEGylated Bionanosphere. IEEE Proc.-Nanobiotechnol., 152(2), 89-96, 2005.
17. Xiao, Y., Ju, X., Chen, Y., Hydrogen Peroxide Sensor Based on Horseradish Peroxidase-Labeled Au Colloids Immobilized on Gold Electrode Surface by Cysteamine Monolayer. Anal. Chim. Acta, 391, 73-82, 1999. 18. Turkevich, J., Colloidal Gold. Part I, Historical and
Preparative Aspects, Morphology and Structure, Gold Bull., 18(3), 86-91, 1985.
19. Liu, F.K., Hsieh, S.Y., Ko, F.H., Chu, T.C., Dai, B.T., Synthesis of Nanometer-Sized Poly(methyl methacrylate) Polymer Network by Gold Nanoparticle Template, Jpn. J. Appl. Phys. 42, 4147–4151, 2003.
20. Hostettler, M.J., Wingate, J.E., Zhong, J., Alkanethiolate Gold Cluster Molecules with Core Diameters from 1.5 to 5.2 nm: Core and Monolayer Properties as a Function of Core Size, Langmuir, 14, 17-30, 1998.
21. Tabrizi, Amir P.F., Production of Gold Nanoparticle and it is use in Quartz Crystal Microbalance System, M.Sc. Thesis, Hacettepe University, Bioengineering Dept., Beytepe, Ankara, Turkey, 2005.