ENERJİ, ÇEVRE VE İKTİSAT
ARAŞTIRMALARI
EDİTÖR KURULU
Mehmet KARAGÜL Afşin GÜNGÖR
Bu kitabın yayın hakkı SİYASAL KİTABEVİ’ne aittir. Yayınevinin ve yayınlayıcısının yazılı izni alınmaksızın kısmen veya tamamen alıntı yapılamaz, hiçbir şekilde kopyalanamaz, çoğaltılamaz ve
yayınlanamaz. ENERJİ, ÇEVRE VE İKTİSAT ARAŞTIRMALARI EDİTÖR KURULU: Mehmet KARAGÜL, Afşin GÜNGÖR, Ümit KOÇ, Ali Özhan AKYÜZ, Azim Doğuş TUNCER
Kapak: Gamze Uçak
©Siyasal Kitabevi Tüm Hakları Saklıdır. Aralık 2019, Ankara
ISBN No: 978-605-7877-44-4 Siyasal Kitabevi‐Ünal Sevindik Yayıncı Sertifika No: 14016
Şehit Âdem Yavuz Sok. Hitit Apt. 14/1 Kızılay-Ankara
Tel: 0(312) 419 97 81 pbx Faks: 0(312) 419 16 11 Baskı:
Sonçağ Yayıncılık Matbaacılık Reklam San Tic. Ltd.Şti. Sertifika No: 25931
İstanbul Cad. İstanbul Çarşısı 48/48 Tel: 0(312) 341 36 67
Dağıtım: Siyasal Kitabevi
Şehit Âdem Yavuz Sok. Hitit Apt. 14/1 Kızılay-Ankara
Tel: 0 (312) 419 97 81 pbx Faks: 0 (312) 419 16 11 e-posta: [email protected] http://www.siyasalkitap.com
ENERJİ, ÇEVRE VE İKTİSAT ARAŞTIRMALARI BİRİNCİ BÖLÜM
THE IMPACT OF TRADE ON RENEWABLE ENERGY CONSUMPTION:
AN EMPRICAL INVESTIGATION FOR DIFFERENT INCOME LEVELS ...1-12
Mert TOPÇU, Utku ÖLMEZ İKİNCİ BÖLÜM
IMPACT OF CO2 EMISSION AND OIL PRICES ON RENEWABLE ENERGY
PRODUCTION IN TURKEY ...13-26
Volkan BEKTAŞ, Uğur URSAVAŞ ÜÇÜNCÜ BÖLÜM
KAYNAKLARINA GÖRE ELEKTRIK ENERJISI ÜRETIMI VE CARI AÇIK ILIŞKISI ...27-38
Ümit KOÇ, Celal TAŞDOĞAN DÖRDÜNCÜ BÖLÜM
CAUSALITY RELATIONSHIP BETWEEN RENEWABLE ENERGY CONSUMPTION,
ECONOMIC GROWTH AND CO2 EMISSIONS: SELECTED G-20 COUNTRIES ...39-44
Tuğba AKDOĞAN BEŞİNCİ BÖLÜM
TÜRKIYE’DE ELEKTRIK TÜKETIMININ COĞRAFI BILGI SISTEMLERI
ILE ANALIZ EDILMESI ...45-62
Hasan Hüseyin AKSU ALTINCI BÖLÜM
IKTISATTA BÜYÜME VE ÇEVRE DÜŞÜNCESININ EVRIMI ...63-78
Şükrü APAYDIN YEDİNCİ BÖLÜM
THE IMPACT OF ECONOMIC GROWTH AND ENERGY CONSUMPTION
ON ENVIRONMENTAL DEGRADATION: A STUDY ON G-20 COUNTRIES ...79-90
Anıl BÖLÜKOĞLU, Ebru TOPÇU, Alper Aykut EKİNCİ SEKİZİNCİ BÖLÜM
SÜRDÜRÜLEBILIR KALKINMA VE KARBON AYAKIZI: TÜRKIYE ÖRNEĞI ...91-102
DOKUZUNCU BÖLÜM
KATI ATIK GERI DÖNÜŞÜM SÜRECININ ÇEVRE, ENERJI VE
EKONOMI POLITIKALARI AÇISINDAN DEĞERLENDIRILMESI ...103-112
Beste ŞİMŞEK, İbrahim BAŞARAN, Afşin GÜNGÖR ONUNCU BÖLÜM
AVRUPA BIRLIĞI ÇEVRE POLITIKASINDA KATI ATIK UNSURU VE
TÜRKIYE’YE YANSIMALARI ...113-118
Beste ŞİMŞEK, Afşin GÜNGÖR, Koray PİRÇEKLİ ONBİRİNCİ BÖLÜM
KÜRESEL KAMUSAL MAL OLARAK ÇEVRENIN VE ÇEVRE VERGILERNIN
TÜRKIYE VE AVRUPA BIRLIĞI EKSENINDE INCELENMESI ...119-136
Cemil ALTUN ONİKİNCİ BÖLÜM
YENILENEBILIR ENERJI YATIRIMLARI KAYNAĞI OLARAK TÜRKIYE
KARBON VERGISININ UYGULANABILIRLIĞI ÜZERINE BIR INCELEME...137-152
Bilgen TAŞDOĞAN ONÜÇÜNCÜ BÖLÜM
MONEY SUPPLY, EMPLOYMENT AND NATIONAL INCOM CAUSALITY:
THE TURKISH EXPERIENCE ...153-168
Fuat SEKMEN, Haşmet GÖKIRMAK ONDÖRDÜNCÜ BÖLÜM
KIRGIZISTAN VE KAZAKISTAN’DA YOZLAŞMA VE IKTISADI BÜYÜME ...169-178
BİRİNCİ BÖLÜM
THE IMPACT OF TRADE ON RENEWABLE ENERGY CONSUMPTION: AN EMPIRICAL INVESTIGATION FOR
DIFFERENT INCOME LEVELS1
Mert TOPÇU2, Utku ÖLMEZ3
Introduction
Since late 1970s, empirical energy economics literature has commonly investigated the relationship between energy consumption and major macroeconomic indicators, including economic growth occupying the first rank (see, Aslan and Topcu, 2018, for literature review). Among these studies, current literature addresses trade as an essential energy demand determinant. Previous studies in the literature (see, for example: Cole, 2006; Topcu and Payne, 2018; among others) discuss that trade can affect energy consumption through three channels. The scale effect postulates that movement of goods from a country to another increases domestic energy consumption by stimulating aggregate demand and, over time, economic growth. The technique effect implies that trade allows emerging countries to adopt energy efficient technologies from developed countries, and therefore affects production level and energy consumption. Finally, the composition effect asserts that trade can affect energy usage through its impact on the relative energy intensity that varies across sectors. An economy where the production largely depends on energy intensive industries is expected to consume more energy than that of less intensive ones.
Recent trends in energy economics literature have addressed to the importance of renewable energy not only due to its environmentally friendly structure; but also sharp declines in the cost of renewable technologies since last decade, with the further declines expected in the future. In this particular, Topcu and Tugcu (2019) asserts that tending towards renewable energy sources are better able to produce economic outcomes unlike focusing on total energy consumption which is largely associated with the environmental inferences.
Although the literature looking into the relationship between trade and renewable energy consumption is currently expanding (see, literature review), we still do not know much about whether this nexus is robust to development stage 1. An early version of this study was presented at the Techno-Science 2019 Conference held
The Impact Of Trade On Renewable Energy Consumption: An Empirical Investigation For Different Income Levels
Mert Topçu, Utku Ölmez
of countries. Given this motivation, the goal of this study is to estimate the impact that trade has on renewable energy consumption by focusing three different panels (low-income, middle-income and high-income countries) with respect to income level. To the best of our knowledge, Amri (2017) is the only attempt that investigates this issue across different income-level countries. However, existing study differs from Amri (2017) in two ways: existing study does not only base on a more inclusive analysis as the dataset encompasses more countries across the globe, but also provides a fresh evidence given the longer and up-to-date time span.
The rest of the study is organized as follows: section 2 reviews relevant literature, section 3 describes data and model, section 4 presents empirical framework and findings and section 5 gives concluding remarks.
1. Literature Review
Energy economics literature has provided a wide range of studies on the relationship between trade and energy consumption using different empirical strategies. While some of them employ regression approaches (see, for example: Cole, 2006; Dedeoglu and Kaya, 2013; Adewuyi and Adeniyi, 2015; among others), some of them utilize causality approaches (see, for example: Narayan and Smyth, 2009; Lean and Smyth, 2010; Sadorsky, 2012; among others). In addition, recent studies entertain the possibility of a nonlinear relationship between trade and energy consumption (see, for example: Shahbaz et al., 2014; Topcu and Payne, 2018; among others).
Although the number of studies looking into the relationship between trade and energy consumption is very expanded, energy economics literature provides relatively limited number of evidences in the case of renewable energy consumption. Among these studies, one set of studies focusses on the nexus between renewable energy consumption and economic growth (see, for example: Apaydin, Gungor and Tasdogan, 2019; Apaydin and Tasdogan, 2019; Tugcu and Topcu, 2018; among others), second set of studies investigates the relationship between urbanization and renewable energy consumption (see, for example: Salim and Shafiei, 2014; Yang, Zhang and Zhang, 2016; Yazdi and Shaokuri, 2018; among others), third set of studies examines the nexus between renewable energy consumption and financial development (see, for example: Anton and Nucu, 2020; Burakov and Freidin, 2017; Charfeddine and Kahia, 2019; among others) and finally fourth set of studies focusses on the relationship between trade and renewable energy consumption.
Aïssa, Jebli and Youssef (2014) examine the relationship between renewable energy consumption, trade and output in 11 African countries over the period
significant relationship between renewable energy consumption and trade. Amri (2017) uses dynamic panel data framework in order to demonstrate the relationship between renewable energy consumption, trade and economic growth for 72 developed and developing countries. The results demonstrate a feedback relationship across trade and renewable energy consumption in the case of whole, developing anddeveloped countries. Zeren and Akkuş (2020) examine the relationship between renewable and non-renewable energy consumption and trade openness for developing countries over the period 1980-2015. Empirical findings indicate that renewable energy consumption reduces trade openness. Sebri and Ben-Salha (2014) investigate the causal relationship between economic growth, renewable energy consumption, carbon emissions and trade deficit in BRICS countries using ARDL boundary test and VECM methods. Empirical findings show a causality between renewable energy consumption and trade deficit in the long run. Brini, Amara and Jemmali (2017) examine the nexus between renewable energy consumption, international trade, oil price and economic growth in Tunisia over the period 1980-2011. Results reveal the existence of a bidirectional relationship between renewable energy consumption and trade in the short-run. Jebli, Youssef and Apergis (2019) investigate the dynamic linkage between renewable energy consumption, tourism, carbon emissions, foreign direct investment and trade for a panel of 22 Central and South American countries, spanning the period 1995–2010. Findings indicate unidirectional causality from renewable energy consumption to trade in the short-run. Dogan and Seker (2016) investigate the relationship between renewable/nonrenewable energy consumption, trade, financial development, carbon emissions and real output in 23 top renewable energy countries over the period 1985-2011 and report that there is no causal relation between renewable energy use and trade openness. Jebli, Youssef and Ozturk (2015) investigate the short- and long-run relationship between carbon emissions, output, renewable energy consumption and international trade for a panel of 24 sub-Saharan Africa countries over the period 1980–2010. Short-run causality results reveal unidirectional causality from trade to renewable energy consumption whereas bidirectional causality between renewable energy and trade is detected in the long-run. Hassine and Harrathi (2017) examine the causal relationship between renewable energy consumption, real output, trade and financial development for the Gulf Cooperation Council countries over the period 1980-2012. Empirical findings indicate that renewable energy consumption Granger cause exports in the long-run. Amri (2019) investigates the linear and non-linear relationship between trade, and non-renewable and renewable energy consumption using data of 72 countries extending from 1990 to 2012. The empirical results demonstrate a bidirectional linear nexus between trade and energy consumption (renewable
The Impact Of Trade On Renewable Energy Consumption: An Empirical Investigation For Different Income Levels
Mert Topçu, Utku Ölmez
Mastorakis (2014) examine the causal relationship between carbon emissions, renewable energy consumption, economic growth and trade openness in Iran over the period 1975-2011 and find that trade openness Granger causes renewable energy consumption. Al-mulali, Ozturk and Lean (2015) examine the nexus between environment, growth, urbanization, trade, financial development and renewable energy consumption over the period 1990-2013 and report a unidirectional causality from trade openness to renewable energy consumption in European countries.
2. Data and Model
This study uses annual observations spanning from 1990 to 2017 in order to examine the impact of trade on renewable energy consumption in a global panel consisting of 127 countries categorized by income levels. Table 1 provides a list of sample countries in which low-, middle- and high-income.
This study models renewable energy consumption (re) as function of income (y), prices (p) and trade (t), as described in the eq(1) below:
reit = β1yit + β2pit + β3tit +vi + εit (1)
Table 1: List of countries
Low-income Middle-income High-income Benin Albania Gabon Nigeria Aruba Korea, Rep. Burkina
Faso Algeria Ghana Pakistan Australia Luxembourg Burundi Armenia Grenada Paraguay Austria Macao SAR, Chine Central
African
Republic Azerbaijan Guatemala Peru Barbados Netherlands Chad Bangladesh Guyana Philippines Belgium ZealandNew Congo,
Dem. Rep. Bhutan Honduras Romania Canada Norway Gambia, The Bolivia India FederationRussian Chile Panama
Guinea-Bissau Botswana Indonesia Senegal Cyprus Poland Haiti Brazil Iran, Islamic Rep. Solomon Islands RepublicCzech Portugal Madagascar Bulgaria Iraq South Africa Denmark Saudi Arabia Malawi Cabo Verde Jamaica Sri Lanka Estonia Seychelles Mali Cameroon Jordan St. Lucia Finland Singapore Nepal China Kazakhstan St. Vincent and the France Slovak
Rwanda Colombia Kenya Sudan Germany Slovenia Tanzania Congo, Rep. RepublicKyrgyz Thailand Greece Spain Togo Costa Rica Lao PDR Tonga Hong Kong, China St. Kitts and Nevis Uganda d’IvoireCote Malaysia Tunisia Hungary Sweden
Dominica Mauritania Turkey Iceland Switzerland Dominican
Republic Mauritius Ukraine Ireland KingdomUnited Ecuador Mexico Vanuatu Israel United States Egypt, Arab
Rep. Mongolia Vietnam Italy Uruguay El Salvador Morocco Zambia Japan
Eswatini
where i denotes the country (i = 1,…….,n) and the time period is donated by the subscript t (t = 1,…….,t). vi represents the country-specific effects; and εit is the random error term.
Renewable energy consumption (re) is measured using renewable energy consumption as a share of total energy consumption. Income (y) is represented by per capita GDP (constant 2010 US dollars). Prices (p) are proxied using consumer price index (2010=100). Trade (t) is measured as a share of GDP. Finally, in order to interpret the coefficient estimates as elasticies, all variables are converted to natural logarithms. Data were obtained from World Development Indicators Database (2019).
Table 2: Descriptive Statistics
Panel Variable Observation Mean Maximum Minimum Std. Dev.
Low-income lnre 460 4.422 7.544 3.873 0.213 lny 460 6.213 6.867 5.393 0.318 lnp 460 4.046 5.829 -6.233 1.107 lnt 460 3.913 4.878 2.979 0.326 Middle-income lnre 1831 2.967 5.576 -2.959 1.365 lny 1831 7.965 9.607 6.018 0.765 lnp 1831 4.014 5.857 -7.021 1.150 lnt 1831 4.225 5.402 -3.863 0.582 High-income lnre 1186 1.895 6.204 -5.119 1.742 lny 1186 10.214 11.625 8.309 0.645 lnp 1186 4.401 5.163 0.758 0.349 lnt 1186 4.446 6.092 2.773 0.597
The Impact Of Trade On Renewable Energy Consumption: An Empirical Investigation For Different Income Levels
Mert Topçu, Utku Ölmez
Table 2 shows the descriptive statistics of the data. Notice that income variable has the highest mean value in all panels. Notice also that the variable that has highest standard deviation in low-income countries is prices whereas it is renewable energy share in the middle- and high-income countries.
3. Methodology and Findings
Granger and Newbold (1974) state that using nonstationary variables in any kind of econometrics analysis is likely to produce inconsistent and biased results. Given this knowledge, the first step of the empirical framework is to examine the series in terms of stationary. To this end, this study employs two commonly employed panel unit tests, developed by Levin, Lin and Chu (2002) (LLC, hereinafter) and Im Pesaran and Shin (2003) (IPS, hereinafter).
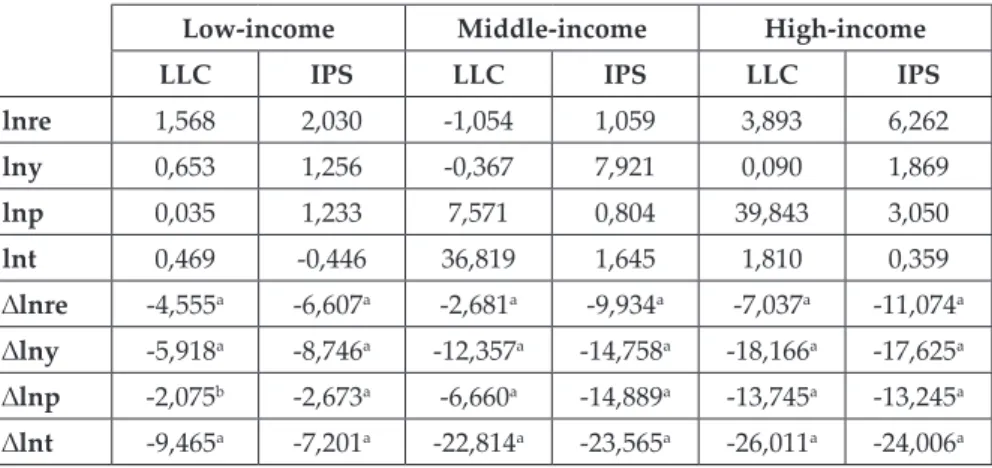
Table 3 presents unit root test results. Considering both test, the null hypothesis stating the existence of unit root can not be rejected in the level whereas the null can be rejected in the first difference. These results prove that all variables within the system are integrated of I(1).
Table 3: Unit Root Results
Low-income Middle-income High-income
LLC IPS LLC IPS LLC IPS
lnre 1,568 2,030 -1,054 1,059 3,893 6,262 lny 0,653 1,256 -0,367 7,921 0,090 1,869 lnp 0,035 1,233 7,571 0,804 39,843 3,050 lnt 0,469 -0,446 36,819 1,645 1,810 0,359 ∆lnre -4,555a -6,607a -2,681a -9,934a -7,037a -11,074a ∆lny -5,918a -8,746a -12,357a -14,758a -18,166a -17,625a ∆lnp -2,075b -2,673a -6,660a -14,889a -13,745a -13,245a ∆lnt -9,465a -7,201a -22,814a -23,565a -26,011a -24,006a
Note: a and b denotes significance at 1% and 5%, respectively.
Maximum lag length is set to 4 in LLC test considering Schwarz Information Criteria (SIC).
Because all variables are integrated of I(1), the long-run relationship between the variables can be investigated. For this purpose, we use cointegration test developed
by Kao (1999), which depends on residual based Engle-Granger technique.4 Kao
cointegration results, shown in Table 4, indicate that variables under investigation are cointegrated in the long-run.
Table 4: Cointegration Results
Low-income Middle-income High-income t-Stat. 3.273a 1.691b -1.556c
Note: a, b and c denotes significance at 1%, 5% and 10%, respectively.
Having proved the co-movement among the variables, it is possible to estimate the run coefficients via regression methodology. In order to estimate the long-run impact that independent variables have on dependent variable, we use Fully Modified Ordinary Least Squares (FMOLS) method developed by Pedroni (2001).
Table 5 presents the long-run regression results. In the case of low-income countries, the impact of income on renewable energy use is negative and statistically significant at 1% level. However, prices and trade do not have statistically significant impact on renewable energy consumption in the long-run. When the results for middle-income countries are reviewed, all three explanatory variables have statistically significant impact on renewable energy consumption at 1% level. Income has a negative impact on renewable energy consumption whereas prices and trade have a positive impact. In the case of high-income countries the impact of income and trade has positive and statistically significant impact at 1% level. Given the negative sign, however, prices do not have a statistically impact on renewable energy consumption.
Table 5: Regression Results
Variables Low-income Middle-income High-income lny -0.136a -0.401a 0.633b
lnp 0.004 0.047a -0.111
lnt 0.002 0.083a 0.641a
Note: a and b denotes significance at 1% and 5%, respectively.
Regressions are estimated with a constant.
Conclusion And Policy Implications
The goal of this study is to examine the of trade on renewable energy consumption in different income-level panels, namely, low-, middle- and high-income countries, over the period 1990-2017. Kao cointegration results reveal a co-movement among the variables in the long-run. The FMOLS results indicate that trade does not have a statistically significant impact on renewable energy consumption in low-income countries. This finding can be explained through the relative importance of fossil fuels in the production process in low-income
The Impact Of Trade On Renewable Energy Consumption: An Empirical Investigation For Different Income Levels
Mert Topçu, Utku Ölmez
0.641%, respectively. These results prove that the simulative impact of trade on renewable energy use increases as income level increases. This finding is in line with the argument asserted by Topcu and Tugcu (2019) that countries with higher average income tend to care more about the environment than those with lower average income. With regard to theoretical background, this result emphasizes the validity of technique effect in which higher-income countries are taking a step forward in benefiting from technological development as a trade tool compared to lower-income countries.
In terms of control variables, findings also suggest several important policy implications. Income, for example, plays a trigger role on renewable energy consumption only in high-income countries whereas the share of renewable energy consumption decreases with trade in low- and middle-income countries. As discussed by Topcu and Tugcu (2019), tending towards renewable energy requires higher investment costs which relatively low-income countries can not able to afford. Consistent with the findings reported by existing study, low- and middle-income countries choose to consume fossil fuels as income rises. When it comes to prices, the results are also worth-mentioning. In low- and middle-income countries, an increase in prices increases renewable energy consumption unlike the case in high-income countries where an increase in prices decreases renewable energy consumption.5 Low- and middle income countries are tend to consume
non-renewable energy sources more because of their low cost. Consumer price index and/or oil prices are the common proxies of energy prices in the literature despite of the fact that they do not represent the price movements in renewable. Given that prices are proxied using consumer price index in line with the literature, an increase in consumer price index increases the share of renewable use in relatively low-income countries whereas it is totally different in high-income countries where the choice between renewables and non-renewables is largely dominated by environmental concerns.
References
Adewuyi, A. O., & Adeniyi, O. (2015). Trade and consumption of energy varieties: Empirical analysis of selected West Africa economies. Renewable and Sustainable Energy Reviews, 47, 354-366.
Aïssa, M. S. B., Jebli, M. B., & Youssef, S. B. (2014). Output, renewable energy consumption and trade in Africa. Energy Policy, 66, 11-18.
Al-Mulali, U., Ozturk, I., & Lean, H. H. (2015). The influence of economic growth, urbanization, trade openness, financial development, and renewable energy on pollution in Europe. Natural Hazards, 79(1), 621-644.
Amri, F. (2017). Intercourse across economic growth, trade and renewable energy consumption in developing and developed countries. Renewable and Sustainable
Energy Reviews, 69, 527-534.
Amri, F. (2019). Renewable and non-renewable categories of energy consumption and trade: Do the development degree and the industrialization degree matter?. Energy, 173, 374-383.
Anton, S. G., & Nucu, A. E. A. (2020). The effect of financial development on renewable energy consumption. A panel data approach. Renewable Energy, 147, 330-338.
Apaydin, S., Gungor, A., & Tasdogan, C. (2019). Türkiye’de yenilenebilir enerji tüketiminin ekonomik büyüme üzerindeki asimetrik etkileri [The asymmetric effects of renewable energy consumption on economic growth in Turkey]. Journal of Mehmet Akif Ersoy
University Economics and Administrative Sciences Faculty, 6(1), 117-134.
Apaydin, S., & Tasdogan, C. (2019). Türkiye’de yenilenebilir ve birincil enerji talebinin büyüme üzerindeki uzun dönem etkileri [The long run effects of renewable and primary energy demand on growth in Turkey]. Third Sector Social Economic Review, 54(1), 431-445.
Aslan, A., & Topcu, E. (2018). Disaggregation in the energy-growth nexus: An indicative literature review. In The Economics and Econometrics of the Energy-Growth Nexus (pp. 49-75). Academic Press.
Brini, R., Amara, M., & Jemmali, H. (2017). Renewable energy consumption, International trade, oil price and economic growth inter-linkages: The case of Tunisia. Renewable
and Sustainable Energy Reviews, 76, 620-627.
Burakov, D., & Freidin, M. (2017). Financial development, economic growth and renewable energy consumption in Russia: A vector error correction approach. International
Journal of Energy Economics and Policy, 7(6), 39-47.
Charfeddine, L., & Kahia, M. (2019). Impact of renewable energy consumption and financial development on CO2 emissions and economic growth in the MENA region: A panel vector autoregressive (PVAR) analysis. Renewable energy, 139, 198-213.
Cole, M. A. (2006). Does trade liberalization increase national energy use?. Economics Letters, 92(1), 108-112.
Dedeoglu, D., & Kaya, H. (2013). Energy use, exports, imports and GDP: New evidence from the OECD countries. Energy Policy, 57, 469-476.
Dogan, E., & Seker, F. (2016). The influence of real output, renewable and non-renewable energy, trade and financial development on carbon emissions in the top renewable energy countries. Renewable and Sustainable Energy Reviews, 60, 1074-1085.
Granger, C. W. J., & Newbold, P. (1974). Spurious regressions in econometrics. Journal of
Econometrics, 2(2), 111-120.
Hassine, M. B., & Harrathi, N. (2017). The causal links between economic growth, renewable energy, financial development and foreign trade in gulf cooperation council countries.
The Impact Of Trade On Renewable Energy Consumption: An Empirical Investigation For Different Income Levels
Mert Topçu, Utku Ölmez
Im, K. S., Pesaran, M. H., & Shin, Y. (2003). Testing for unit roots in heterogeneous panels.
Journal of Econometrics, 115(1), 53-74.
Jebli, M. B., Youssef, S. B., & Apergis, N. (2019). The dynamic linkage between renewable energy, tourism, CO 2 emissions, economic growth, foreign direct investment, and trade. Latin American Economic Review, 28(1), 2.
Jebli, M. B., Youssef, S. B., & Ozturk, I. (2015). The role of renewable energy consumption and trade: environmental kuznets curve analysis for sub-saharan Africa countries.
African Development Review, 27(3), 288-300.
Kao, C. (1999). Spurious regression and residual-based tests for cointegration in panel data.
Journal of Econometrics, 90(1), 1-44.
Lean, H. H., & Smyth, R. (2010). Multivariate Granger causality between electricity generation, exports, prices and GDP in Malaysia. Energy, 35(9), 3640-3648.
Levin, A., Lin, C. F., & Chu, C. S. J. (2002). Unit root tests in panel data: asymptotic and finite-sample properties. Journal of Econometrics, 108(1), 1-24.
Narayan, P. K., & Smyth, R. (2009). Multivariate Granger causality between electricity consumption, exports and GDP: evidence from a panel of Middle Eastern countries.
Energy Policy, 37(1), 229-236.
Ozturk, S., & Topcu, E. (2014). Health expenditures and economic growth: Evidence from G8. International Journal of Economics and Empirical Research, 2(6), 256-261.
Pedroni, P. (2001). Fully modified OLS for heterogeneous cointegrated panels. In
Nonstationary panels, panel cointegration, and dynamic panels (pp. 93-130). Emerald
Group Publishing Limited.
Sadorsky, P. (2012). Energy consumption, output and trade in South America. Energy
Economics, 34(2), 476-488.
Salim, R. A., & Shafiei, S. (2014). Urbanization and renewable and non-renewable energy consumption in OECD countries: An empirical analysis. Economic Modelling, 38, 581-591. Sebri, M., & Ben-Salha, O. (2014). On the causal dynamics between economic growth,
renewable energy consumption, CO2 emissions and trade openness: Fresh evidence from BRICS countries. Renewable and Sustainable Energy Reviews, 39, 14-23.
Shahbaz, M., Nasreen, S., Ling, C. H., & Sbia, R. (2014). Causality between trade openness and energy consumption: What causes what in high, middle and low income countries. Energy Policy, 70, 126-143.
Topcu, M., & Payne, J. E. (2018). Further evidence on the trade-energy consumption nexus in OECD countries. Energy Policy, 117, 160-165.
M. Topcu, C.T. Tugcu, The impact of renewable energy consumption on income inequality: Evidence from developed countries. Renewable Energy, https://doi.org/10.1016/j. renene.2019.11.103
Tugcu, C. T., & Topcu, M. (2018). Total, renewable and non-renewable energy consumption and economic growth: Revisiting the issue with an asymmetric point of view. Energy, 152, 64-74.
World Bank, 2019. World Development Indicators (http://datacatalog.worldbank.org/). Yang, J., Zhang, W., & Zhang, Z. (2016). Impacts of urbanization on renewable energy
consumption in China. Journal of cleaner production, 114, 443-451.
Yazdi, S. K., & Mastorakis, N. I. K. O. S. (2014). Renewable, CO2 emissions, trade openness, and economic growth in Iran. Latest Trend in Energy, Enviroment and Development, c, 25, 360-370.
Yazdi, S. K., & Shakouri, B. (2018). The effect of renewable energy and urbanization on CO2 emissions: A panel data. Energy Sources, Part B: Economics, Planning, and Policy, 13(2), 121-127.
Zeren, F., & Akkuş, H. T. (2020). The relationship between renewable energy consumption and trade openness: New evidence from emerging economies. Renewable Energy, 147, 322-329.
İKİNCİ BÖLÜM
IMPACT OF CO2 EMISSION AND OIL PRICES ON RENEWABLE ENERGY PRODUCTION IN TURKEY Volkan BEKTAŞ1, Uğur URSAVAŞ2
Introduction
Energy plays a crucial role in achieving sustainable economic growth and development. Factors such as the rapid population growth, increases in consumption expenditures and industrial activities lead to more demand for energy. Due to some advantages like low infrastructure requirements, easy transportation, low- cost, currently nearly 80% of the total energy is provided by fossil fuels. According to International Energy Agency (IEA), oil has the largest share in total primary energy supply (32%), followed by coal (27%), natural gas (22%), biofuels and waste (9%), nuclear (5%), hydro (3%) and the other renewables (2%). In addition to the advantages of using fossil fuels, there are also serious disadvantages. Greenhouse gases resulting from the use of fossil fuels, causes global warming by increasing in the average surface temperature of the Earth. Due to the increasing global energy demand and environmental problems caused by fossil fuels, the policies aimed at increasing the production and use of renewable energy have gained momentum in recent years. Significant progress has been made in the field of renewable energy thanks to supportive policies and technological development.
The production from renewable energy sources is also important for Turkey as well as other countries. Due to economic and population growth, demand of energy in Turkey has increased in recent years. However, Turkey does not have enough energy resources to meet this growing energy demand and, therefore Turkey is extremely dependent on imported energy. This situation leads to the deterioration of Turkey’s balance of payment also it makes Turkey more vulnerable to external economic shocks. So the extension of renewable energy sources will enable Turkey to reduce oil dependency, improve energy supply security, prevent environmental pollution and make economic conditions better.
The aim of this paper is to investigate the impact of carbon dioxide emission and oil prices on renewable energy production in Turkey over the period 1983 to 2016 by using ARDL model. There is no paper that examining the effects of oil prices and carbon dioxide emission on renewable energy production in Turkey. This study aims to fill this gap in the literature.
Impact of CO2 Emission and Oil Prices On Renewable Energy Production In Turkey
Volkan Bektaş, Uğur Ursavaş
The remaining of the study is organized as follows. Part two gives information about renewable energy in Turkey, part three explains the current literature on the relationship among renewable energy, oil prices, economic growth, carbon emissions and other variable, part four presents data, models, methodology and analysis result and last part concludes.
1. Renewable Energy in Turkey
Global demand for energy is rising rapidly due to increasing human activity. Despite growth in alternative energy sources such as wind and solar power, the fossil fuels will keep to be main energy source (IEA, 2019). But there are plenty of downsides to use fossil fuels like carbon emissions, air pollution, ocean pollution and habitat destruction. According to International Energy Agency (IEA), world energy production was 14035 Mtoe in 2017. Oil has the largest share in total primary energy supply (32%), followed by coal (27%), natural gas (22%), biofuels and waste (9%), nuclear (5%), hydro (3%) and the other renewables (2%). On the other hand the largest contributor to CO2 emission is also coal (44.2%). The shares of other contributors are oil (34.6%), natural gas (20.5%) and other sources (0.7%) respectively. This indicates that world’s total oil, coal and natural gas production, which equals the 81% of the total energy production, contributes to CO2 emission by 99.2 percentage.
Moreover, according to BP Statistical Review of World Energy (2019), the current global reserves to production ratio shows that oil reserves in 2018 accounted for 50 years of current production, gas reserves in 2018 accounted for 50.9 years of current production and coal reserves in 2018 accounted for 132 years of current production. In addition to damaging the environment, the limited reserves of fossil fuels make it necessary to increase renewable energy resources globally.
Total Primary Energy Supply By Fuel Natural Gas 22% Nuclear 5% Oil 32% Hydro 3% Coal 27% Biofuels and Waste 9% Other Renewables 2% Coal 44,2% Other 0,7% Oil 34,6% Natural Gas 20,5% CO2 Emission By Fuel
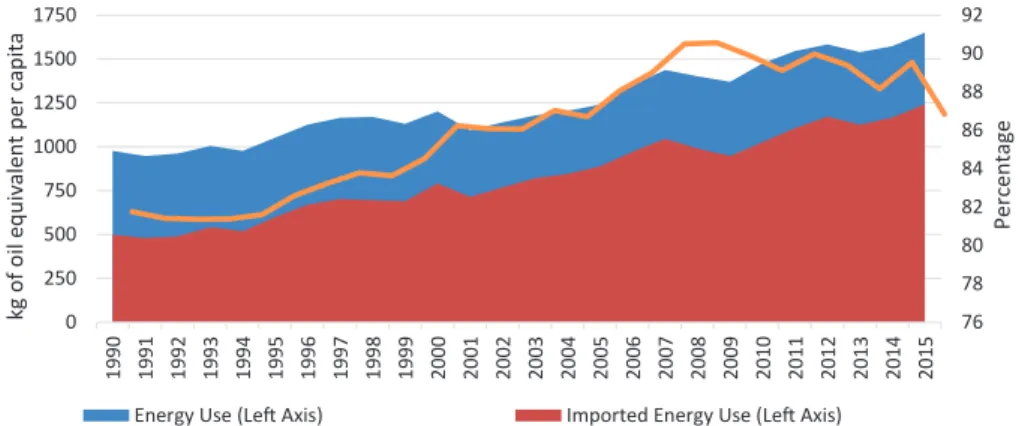
Energy consumption of Turkey, as a developing country, has increased significantly in recent years due to economic and population growth. But energy production in Turkey is insufficient to meet the increasing energy demand which is critical for economic growth. Consequently, Turkey is extremely dependent on imported energy. On the other hand, energy import dependency of Turkey is one of the main reasons of high trade deficit, Turkey’s energy import to trade deficit ratio is approximately 78 percent and energy import constituted about 20% of total import in 2018 (Turkstat, 2019). It’s clear from the figure that the share of fossil fuel energy consumption in total energy consumption has grown rapidly in recent years which contributes to carbon dioxide emission. As a result, growing energy demand and energy import dependency are very critical not only for economic aspect, but also in ecological and political aspect. Moreover, substantial fluctuations in energy prices and disruptions in energy flows can also be seen as potential weaknesses for Turkey. 76 78 80 82 84 86 88 90 92 0 250 500 750 1000 1250 1500 1750 1990 1991 1992 1993 1994 1995 1996 1997 1998 1999 2000 2001 2002 2003 2004 2005 2006 2007 2008 2009 2010 2011 2012 2013 2014 2015 ati pac re p t nel avi uq e li o f o g k
Energy Use (Le� Axis) Imported Energy Use (Le� Axis) Fossil fuel energy consump�on (Right Axis)
Per
ce
nt
age
Figure 2. Energy Use in Turkey (1990-2015) Source: World Bank (2019)
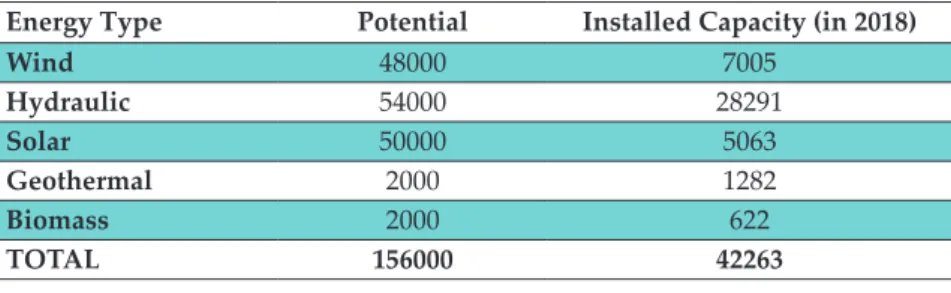
Turkey has a significant potential to produce renewable energy. The usage of such resources are very critical in order to avoid all the risks mentioned above. It is estimated that total renewable energy potential of Turkey is about 156000 megawatt (MW) in 20180. However, with the installed capacity, approximately 14% of the wind power potential, 52% of the hydropower potential, 10% of the solar energy potential, 64% of the geothermal potential, 31% of the biomass potential and totally only 27% of the all renewable sources are used. Low level usage of renewable resources leads to increase the usage of imported fossil fuels due to the rising energy demand of Turkey. The MENR (2016) denotes that Turkey can produce about 50% of its power from renewable energy sources by 2030. Such a strategy will not only help to meet the increasing energy demand, but also reduce
Impact of CO2 Emission and Oil Prices On Renewable Energy Production In Turkey
Volkan Bektaş, Uğur Ursavaş
Table 1. Renewable Energy Potential and Installed Capacity, MW
Energy Type Potential Installed Capacity (in 2018)
Wind 48000 7005 Hydraulic 54000 28291 Solar 50000 5063 Geothermal 2000 1282 Biomass 2000 622 TOTAL 156000 42263
Source: MENR (2019) and TETC (2019).
2. Literature Review
There are many research in the literature have investigated the renewable energy consumption and its impact on economic conditions. These studies (Sadorsky, 2009, 2009b; Apergis and Payne 2010a, 2010b; Menegaki, 2011; Salim and Rafik, 2012; Omri and Nguyen, 2014; Inglesi-Lotz, 2016; Dogan and Seker, 2016; Mensah et al., 2019; Apaydın et al., 2019) generally have investigated the causal relationship among renewable energy consumption, carbon emissions, economic growth, and the main drivers of renewable energy consumption such as oil price, income, nuclear energy consumption, etc.
Sadorsky (2009a) explores the factors that affecting renewable energy in G7 countries by using panel cointegration tests. The results show that, real GDP per capita and carbon dioxide emissions per capita are important drivers of per capita renewable energy consumption in the long-run. However, oil prices have a lesser (negative) effect on renewable energy consumption. Sadorsky (2009b) tests the relationship among renewable energy consumption and income for 18 emerging countries between 1994-2003. The empirical results show that income is positively related to renewable energy consumption.
Using a modified version Granger causality tests, Menyah and Wolde-Rufael (2010) analyse the causal links among renewable energy, nuclear energy consumption and CO2 emissions for the period 1960-2007 for the US. The causality test results indicate that a one-way negative causality running from nuclear energy consumption to CO2 emission. The findings also show that one-way causality from CO2 emissions to renewable energy consumption.
Apergis and Payne (2010a; 2010b) investigate the causal links among economic growth and renewable energy consumption for different country groups. In their first study, the sample consists of twenty OECD countries during the period 1985-2005. Granger causality tests results show that there is a two-way causality among renewable energy consumption and economic growth both in the short and
long-renewable energy consumption for 13 Euroasia economies. Empirical findings show that there is a two-way causality link between renewable energy consumption and economic growth in the short and long-run. Using panel cointegration and panel causality tests, Apergis and Payne (2014) test the causal links between renewable energy, output, fossil fuel prices and CO2 emissions in Central America between 1980-2010. The empirical findings show that a long-run cointegrated relationship exists between real coal prices, carbon emissions per capita, real GDP per capita, renewable energy consumption per capita, and real oil prices.
Salim and Rafik (2012) analyze the determinants of renewable energy consumption for six emerging countries, Philippines, India, Turkey Brazil, China and Indonesia for the period of 1980-2006 by using both time series and panel data econometric techniques. The results indicate that income and pollutant emission are main determinants of renewable energy consumption in Brazil, China, Indonesia and India. However, income is the important driver of renewable energy consumption in Philippine and Turkey. Unlike income and emission, oil prices appear not to have any strong effects.
Using GMM panel technique, Omri and Nguyen (2014) test the determinants of renewable energy consumption for 64 countries for the period of 1990-2011. The empirical findings show that the increases in trade openness and CO2 emissions are the main determinants of renewable energy consumption. Sample countries also sub-divided into three groups, namely, high, middle and low income. The empirical results show that, the changes in the per capita GDP has a significant effect on renewable energy consumption only in the high and low income countries.
Kahia et al. (2017) analyze the relationship among renewable, non-renewable energy use and economic growth in MENA Net Oil importing Countries (NOICs) between 1980-2012 by using panel Granger Causality test. The empirical results show that a bidirectional causal relationship between renewable energy use and economic growth in the short-run. Besides, there is two-way causal link between non-renewable and renewable energy use.
Attioni et al. (2017) explores the causal relationship between non-renewable
energy consumption CO2 emissions, economic growth, renewable energy
consumption for 22 African economies over the period 1990-2011. According to test results, there is a one-way causality link from CO2 emissions to economic growth.
Deniz (2019) tests the effect of oil price on renewable energy for 12 oil dependent countries (oil exporters and importers) for the period of 1995-2014. The empirical results show that oil price has a negative effect on renewable energy for oil exporting countries and positive effect for oil importing economies.
Impact of CO2 Emission and Oil Prices On Renewable Energy Production In Turkey
Volkan Bektaş, Uğur Ursavaş
Apaydin & Tasdogan (2019a) explore the effect of economic growth and primary energy consumption on carbon dioxide emission in Turkey for the period of 1965-2017. Results show that growth is positively related to primary energy consumption and energy consumption is more likely to increase carbon emissions. In the latter study, the authors (2019b) investigate the effects of renewable and primary energy demand on economic growth and determine the determine the causality between the variables. Causality tests show that here is both co-integration relation on variables and unidirectional causality from energy demand to economic growth.
Sharif et al. (2019) test the link between non-renewable and renewable energy consumption and environmental degradation for 74 countries between 1990-2015. Pedroni co-integration, Westerlund (2007) bootstrap cointegration, heterogeneous panel causality, the CIPS unit root test and FMOLS techniques are applied in the study. The results indicate that non-renewable energy consumption positively related to environmental degradation whereas, renewable energy consumption has a negative impact on environmental degradation.
Using panel cointegration analysis, Nguyen and Kakinaka (2019) investigate how the relationship between carbon emissions and renewable energy consumption is associated with the income level for 107 countries over the period 1990-2013. The analysis results differ among groups of low and high income countries. Renewable energy consumption is negatively and positively related to output and carbon emissions, respectively for low-income countries whereas, renewable energy consumption is positively and negatively related to output and carbon emissions respectively for high income countries.
Apaydin et al. (2019) explore the asymmetric effects of renewable energy consumption on economic growth for the period 1965-2017 in Turkey. The findings show that positive and negative shocks in in renewable energy consumption have asymmetric effect on economic growth. The effect of positive shocks in renewable energy consumption lesser than the effect of negative shocks.
Mensah et al. (2019) explore the causal links between carbon emissions, fossil fuel energy consumption, oil price and economic growth for 22 African countries for the period of 1990-2015. estimation results show that there is a bilateral causal link between economic growth and fossil fuel energy consumption and fossil fuel energy consumption and carbon emissions in the short and long- run. Authors also classify the countries into two groups; oil exporters and non-oil exporters. The empirical findings show that one-way causality running from carbon emissions to economic growth for non-oil exporters in long-term and short-term.
3. Data, Model Specification and Emprical Results Data and model specification:
In order to examine the relationship between renewable energy production, carbon dioxide emission and oil prices, a log-linear equation is specified as following:
RNWt = β0 + β1 CO2t + β2 OILt + ut (1)
where RNW is renewable energy production (measured thousand tonne), CO2
is carbon dioxide emissions per capita (measured in metric ton per capita), OIL is crude oil import prices (measured in USD per barrel of oil. The annual data over the perriod between 1983 and 2016 were obtained from OECD data base for Turkey. We employ the Autoregressive Distributed Lag (ARDL) approach introduced by Pesaran and Smith (1998) and Pesaran et al. (2001) to examine the relationship between renewable energy production, carbon dioxide emission and oil prices. The ARDL approach has several advantages. First this approach can be applied irrespective of whether the variables are purely I(0), purely I(1) or mutually cointegrated. Second, this approach can provide more efficient cointegration relationships even with small samples (Ghatak and Siddiki 2001). Third, it is possible to determine different lags for each variable in this approach (Pesaran et al. 2001). Fourth, this approach can provide efficient estimations even when the independent variables have some endogeneity properties.
The ARDL model of the Eq. [1] is as follows: ∆RNWt = β0 + ∑p
i=1 ωi ΔRNWt–i + ∑pi=1 ψi ΔCO2t–i + ∑pi=1 φi ΔOILt–i + δ1 RNWt– 1 + δ2 CO2t– 1 + δ3 OILt–1 + Ut (2)
Where Δ is the first difference operator, RNWt is the dependent variable, CO2t and OILt are the independent variables, ωi , ψi and φi are the short run coefficients and δ1, δ2 and δ3 are the corresponding long run multipliers of the ARDL model.
Basically, ARDL approach consists of three steps. In the first step, it should be confirmed that all the the variables are I(0), I(1) or mutually cointegrated. In the second step, the existence of long run relationship among the variables must be checked via the joint Wald statistics or F-statistics that tested the null hypothesis of no cointegration. If the F-statistics reveals that there is a cointegration relationship between variables, then the coefficients of the long run and short run relationships are estimated via error correction model in the third step.
Impact of CO2 Emission and Oil Prices On Renewable Energy Production In Turkey
Volkan Bektaş, Uğur Ursavaş
Emprical results
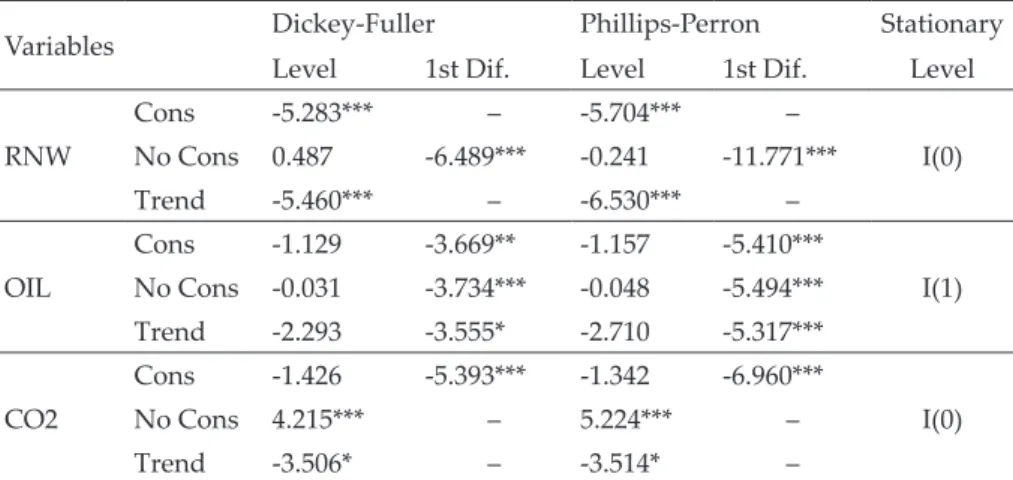
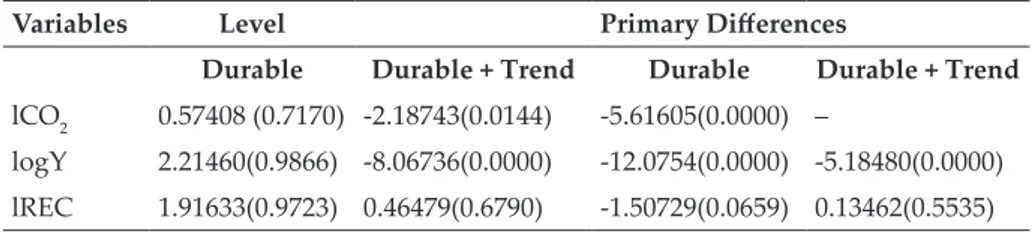
To determine the order of the series, we conducted Dickey and Fuller (1979), Phillips and Perron (1988) unit root tests. The unit root test results reveal that the variables RNW and CO2 appear stationary in levels, on the other hand the variable OIL has a unit root and appears stationary in the first difference. Due to the variables are cointegrated I(0) and I(1), then the ARDL bounds test approach can be maintained.
Table 2. Dickey and Fuller, Phillips and Perron unit root tests
Variables Dickey-Fuller Phillips-Perron Stationary Level 1st Dif. Level 1st Dif. Level
RNW Cons -5.283*** – -5.704*** – I(0) No Cons 0.487 -6.489*** -0.241 -11.771*** Trend -5.460*** – -6.530*** – OIL Cons -1.129 -3.669** -1.157 -5.410*** I(1) No Cons -0.031 -3.734*** -0.048 -5.494*** Trend -2.293 -3.555* -2.710 -5.317*** CO2 Cons -1.426 -5.393*** -1.342 -6.960*** I(0) No Cons 4.215*** – 5.224*** – Trend -3.506* – -3.514* –
Note: ***, **and * denotes statistical significance at 1%, 5% and 10% level, res-pectively.
The ARDL bounds test results indicate that the null hypothesis of no cointegration relationship is rejected at 10% significance level. This means that there is a long run relationship between renewable energy production, carbon dioxide emission and oil prices.
Table 3. ARDL (1 4 0) Bounds Testing for long run relationship
F-Test 4.461*
Table CV’s for case III I(0) I(1)
1% 5.15 6.36
5% 3.79 4.85
10% 3.17 4.14
Note: ***, ** and * denotes statistical significance at 1%, 5% and 10% level, respectively.
After confirming that there is a long run relationship between the variables, the long run and short run coefficients can be estimated. In the Table 4, the error
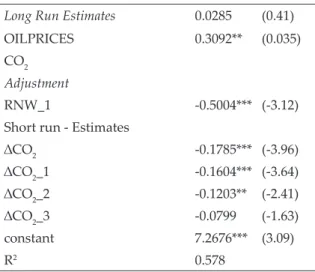
and statistically significant (-0.5004). This term shows the speed of adjustment process to convergence towards the long run equilibrium following a shock. A negative and statistically significant error correction term implies how quickly variables convergence to long run equilibrium. In the long run renewable energy production is positively related to carbon dioxide emission. A 1% increase in carbondioxide emission leads to a rise of 0.31% in renewable energy production. On the other hand there is no relationship between renewable energy production and oil prices. In the short run, carbon dioxide emission has negative sign and statistically significant (except ∆CO2_3). Carbon dioxide emission has opposite signs in the long run and in the short run. It is interesting that in the short run carbon dioxide emission has negative effect on renewable energy production, but it turns positive in the long run.
Table 4. Error correction results ARDL (1 4 0)
Long Run Estimates 0.0285 (0.41)
OILPRICES 0.3092** (0.035) CO2
Adjustment
RNW_1 -0.5004*** (-3.12) Short run - Estimates
∆CO2 -0.1785*** (-3.96) ∆CO2_1 -0.1604*** (-3.64) ∆CO2_2 -0.1203** (-2.41) ∆CO2_3 -0.0799 (-1.63) constant 7.2676*** (3.09) R2 0.578
Note: *** , **and * denotes statistical significance at 1%, 5% and 10% level, respectively. Numbers in parentheses are t-statistics. ∆ is difference operator. The last issue we adress is related to the consistency and efficiency of the ARDL model. For this purpose, series of diagnostic tests were carried out. Diagnostic tests examine serial correlation, heteroscedasticity and conditional heteroscedasticity, omitted variables, normality and stability. The test results pointed out that the model has a correct functional form and the model’s residuals are serially uncorrelated, normally distributed and homoskedastic, there is no omitted variable in the model, and the model is stable (no structural break).
Impact of CO2 Emission and Oil Prices On Renewable Energy Production In Turkey
Volkan Bektaş, Uğur Ursavaş
Table 5. Diagnostic tests
Specification Statistics/p-values Conclusion Durbin–Watson (autocorrelation) 2.5059 no autocorrelation Bruesch–Pagan (heteroscedasticity) 0.62 (0.4322) no heteroscedasticity ARCH LM 0.513 (0.474) no conditional heteroscedasticity Ramsey Reset (omitted variables) 0.35 (0.7865) no omitted variables Jarque–Bera (normality) 1.691 (0.4294) Evidence of normality Parameter stability (CUSUM) 0.3647 No structural break
Conclusion
We examined the impact of oil prices and carbon dioxide emission on renewable energy production in Turkey by using ARDL approach. The study confirms the presence of a long run relationship between renewable energy production and carbon dioxide emission in Turkey. In the long run renewable energy production is positively related to carbon dioxide emission while there is no relationship between renewable energy production and oil prices. This indicates that Turkey tries to meet the increasing energy demand both renewable and fossil energy resources in the long run. In the short run, carbon dioxide emission has negative effect on renewable energy production. On the other hand renewable energy production is not related to oil prices both in the long and short term.
Energy consumption of Turkey has increased significantly in recent years due to economic and population growth. But energy production in Turkey is insufficient to meet the increasing energy demand which is critical for economic growth. Therefore Turkey is extremely dependent on imported energy that mostly consists of fossil fuels which contribute the carbon dioxide emission. Besides, energy import dependency of Turkey is one of the main reasons of high trade deficit. As a result, growing energy demand and energy import dependency are very critical not only for economic aspect, but also in ecological and political aspect. Moreover substantial fluctuations in energy prices and disruptions in energy flows can also be seen as potential weaknesses for Turkey. Turkey has a significant potential to produce renewable energy. However, with the installed capacity, approximately only 27% of the renewable sources are used. More usage of renewable resources are very critical in order to avoid all the risks mentioned above.
References
Apaydin, S., Gungor, A. & Tasdogan, C. (2019). The asymmetric effects of renewable energy consumption on economic growth in Turkey. Journal of Mehmet Akif Ersoy University
Economics and Administrative Sciences Faculty, 6(1), 117-134. DOI: https://dx.doi.
org/10.30798/makuiibf.505104
Apaydin, S. & Tasdogan, C. (2019a). Türkiye’de iktisadi büyüme ve birincil enerji tüketiminin karbon salınımı üzerindeki etkisi: Yapısal var yaklaşımı. Akademi Sosyal Bilimler
Dergisi, 6(16), 19-35.
Apaydin, S. & Tasdogan, C. (2019b). Türkiye’de yenilenebilir ve birincil enerji talebinin büyüme üzerindeki uzun dönem etkileri. Üçüncü Sektör Sosyal Ekonomi Dergisi, 54(1), 431-445. DOI: https://10.15659/3.sektor-sosyal-ekonomi.19.03.1109
Apergis, N. & Payne, J. (2010a). Renewable energy consumption and economic growth: Evidence from a panel of OECD countries. Energy Policy, 38(1), 656-660. DOI: https:// doi.org/10.1016/j.enpol.2009.09.002
Apergis, N. & Payne, J. (2010b). Renewable energy consumption and growth in Eurasia.
Energy Economics, 32(6), 1392-1397. DOI: https://doi.org/10.1016/j.eneco.2010.06.001
Apergis, N. & Payne, J. (2014). Renewable energy, output, CO2 emissions, and fossil fuel prices in Central America: Evidence from a nonlinear panel smooth transition vector error correction model. Energy Economics, 42, 226-232. DOI: http://dx.doi.org/10.1016/j. eneco.2014.01.003
Attiaoui, I., Toumi, H., Ammouri, B. & Gargouri, I. (2017). Causality links among renewable energy consumption, CO2 emissions, and economic growth in Africa: Evidence from a panel ARDL-PMG approach. Environmental Science and Pollution Research, 24(14), 13036-13048. DOI: https://doi.org/10.1007/s11356-017-8850-7
Deniz, P. (2019). Oil Prices and Renewable Energy: An Analysis for Oil Dependent Countries.
Journal of Research in Economics, 3(2), 139-152. DOI: https://doi.org/10.35333/
JORE.2019.52
Dickey, D. & Fuller, W. (1979). Distribution of the Estimators for Autoregressive Time Series with a Unit Root. Journal of the American Statistical Association, 74(366), 427-431. DOI: https://doi.org/10.2307/2286348
Dogan, E. & Seker, F. (2016). The influence of real output, renewable and non-renewable energy, trade and financial development on carbon emissions in the top renewable energy countries. Renewable and Sustainable Energy Reviews, 60, 1074-1085. DOI: http://dx.doi.org/10.1016/j.rser.2016.02.006
Inglesi-Lotz, R. (2016). The impact of renewable energy consumption to economic growth: A panel data application. Energy Economics, 53, 58-63. DOI: https://doi.org/10.1016/j. eneco.2015.01.003
Impact of CO2 Emission and Oil Prices On Renewable Energy Production In Turkey
Volkan Bektaş, Uğur Ursavaş
Menegaki, A. N. (2011). Growth and renewable energy in Europe: A random effect model with evidence for neutrality hypothesis. Energy Economics, 33(2), 257-263. DOI: https://doi.org/10.1016/j.eneco.2010.10.004
MENR. Statistics, Republic of Turkey Ministry of Energy and Natural Resources, http:// www.enerji.gov.tr [accessed 18.11.2019].
MENR (2016). Republic of Turkey Ministry of Energy and Natural Resources, Mavi Kitap, https://www.enerji.gov.tr/File/?path=ROOT%2f1%2fDocuments%2fMavi%20 Kitap%2fMavi_kitap_2016.pdf [accessed 18.11.2019].
Mensah, I. A., Sun, M., Gao, C., Omari-Sasu, A.Y., Zhu, D., Ampimah, B.C. & Quarcoo, A. (2019). Analysis on the nexus of economic growth, fossil fuel energy consumption, CO2 emissions and oil price in Africa based on a PMG panel ARDL approach. Journal of
Cleaner Production, 228(29), 161-174. DOI: https://doi.org/10.1016/j.jclepro.2019.04.281
Menyah, K. & Wolde-Rufael, Y. (2010). CO2 emissions, nuclear energy, renewable energy and economic growth in the US. Energy Policy, 38, 2911-2915. DOI: https://doi. org/10.1016/j.enpol.2010.01.024
Nguyen, K. H. & Kakinaka, M. (2019). Renewable energy consumption, carbon emissions, and development stages: Some evidence from panel cointegration analysis. Renewable
Energy, 132, 1049-1057. DOI: https://doi.org/10.1016/j.renene.2018.08.069
OECD (2019). Air and GHG emissions (indicator), DOI: 10.1787/93d10cf7-en (Accessed on 07.11.2019)
OECD (2019). Crude oil import prices (indicator), DOI: 10.1787/9ee0e3ab-en (Accessed on 07.11.2019)
OECD (2019). Renewable energy (indicator), DOI: 10.1787/aac7c3f1-en (Accessed on 07.11.2019)
Omri, A. & Nguyen, D. K. (2014). On the determinants of renewable energy consumption: International evidence. Energy, 72, 554-560. DOI: https://doi.org/10.1016/j. energy.2014.05.081
Pesaran, M. H., Shin, Y., & Smith, R. J. (2001). Bounds testing approaches to the analysis of long-run relationships. Journal of Applied Economics, 16:289–326. DOI: https://doi. org/10.1002/jae.616
Phillips, P.C.B. & Perron P. (1988). Testing for Unit Roots in Time Series Regression,
Biometrika, 75, 335-346. DOI: https://doi.org/10.1093/biomet/75.2.335
Sadorsky, P. (2009a). Renewable energy consumption, CO2 emissions and oil prices in the G7 countries. Energy Economics, 31(3), 456-462. DOI: https://doi.org/10.1016/j. eneco.2008.12.010
Sadorsky, P. (2009b). Renewable energy consumption and income in emerging economies.
Salim, R.A. & Rafiq, S. (2012). Why do some emerging economies proactively accelerate the adoption of renewable energy?. Energy Economics, 34(4), 1051-1057. DOI: https://doi. org/10.1016/j.eneco.2011.08.015
Sharif, A., Raza, S. A., Ozturk, I. & Afshan, S. (2019). The dynamic relationship of renewable and nonrenewable energy consumption with carbon emission: A global study with the application of heterogeneous panel estimations. Renewable Energy, 133, 685-691. DOI: https://doi.org/10.1016/j.renene.2018.10.052
TETC. Statistics, Turkish Electricity Transmission Corporation, https://www.teias.gov.tr [Accessed on 18.11.2019].
TURKSTAT (2019). Turkish Statistical Institue, http://www.turkstat.gov.tr/UstMenu.do? metod =kategorist [Accessed on 16.11.2019].
World Bank (2019), World Development Indicators, https://databank.worldbank.org/source/ world-development-indicators [Accessed on 17.11.2019].
ÜÇÜNCÜ BÖLÜM
KAYNAKLARINA GÖRE ELEKTRIK ENERJISI ÜRETIMI VE CARI AÇIK ILIŞKISI
Ümit KOÇ1, Celal TAŞDOĞAN2
Giriş
1700’lü yılların sonundan itibaren buharlı makinelerin insanlığın yaşamını kolaylaştıracak alanlara girmesiyle birlikte enerji ve enerji3 üreten her türlü kaynak
da ülkelerin ve politika yapıcıların gündeminde ilk sıralara yerleşmiştir. Bugün geldiğimiz noktada üretimin temel girdilerinden birisi haline gelmiş olan enerji aslında tek başına ekonomi disiplinin de ötesine geçerek uluslararası ilişkiler, siyaset bilimi, ulusal güvenlik ve hukuk alanlarını kapsayan disiplinlerarası bir araştırma alanı haline gelmiştir.
Özellikle 1973 petrol krizi ve ardından yaşanan durgunluk, petrol fiyat artışlarının ekonomi üzerindeki etkilerini analiz eden birçok çalışmanın yapılmasına yol açmıştır. 1973 yılında yaşanan bu durgunluk II. Dünya Savaşı sonrası durgunlukların en uzunudur ve odağında petrol (enerji)-makroekonomi ilişkisi yer almakta (Brown & Yücel, 2002) ve durgunluk dönemindeki petrol fiyat artışları ile ekonomik göstergeler arasındaki negatif yönlü ilişkiye dikkat çekilmektedir (Rasche & Tatom, 1977; Darby, 1982).
Petrol (enerji) fiyat hareketleri ile ekonomik aktivite arasındaki negatif ilişkinin temel nedeni arz yönlü etki olarak kabul edilen petrol kaynaklarının sınırlı olmasıdır. Söz konusu bu girdi fiyatlarının yükselmesi ekonomiyi yavaşlatırken bir yandan da enflasyonu artırmaktadır. (Brown & Yücel, 2002)
Yeterli enerji kaynağına sahip olmayan ekonomiler için enerji ithalatı, tüketim seviyesinin üretken ve sosyal gerekliliklerle uyumlu bir seviyede olmasını imkan sağlamaktadır. Bununla birlikte, dış enerji kaynaklarına bağımlılık, hem konjonktüre hem de enerji ihraç eden ekonomilerin stratejik kararlarına bağlı olarak iç ekonomiyi kırılgan bir duruma getirebilmektedir. 1970’lerdeki petrol krizi, iç enerji kullanımının fiyatlara karşı oldukça elastik olması nedeniyle, düşük enerji kaynaklarına sahip ülkelerde iç fiyatların ithal edilen enerji fiyatlarına karşı kısa ve orta vadede oldukça hassas olabileceğini açıkça ortaya koymuştur (Llop, 2020).
1. Türkiye Cumhuriyet Merkez Bankası, Ankara, Türkiye, [email protected] 2. Ankara Hacı Bayram Veli Üniversitesi, Ankara, Türkiye, [email protected]
Kaynaklarına Göre Elektrik Enerjisi Üretimi ve Cari Açık İlişkisi
Ümit Koç, Celal Taşdoğan
1973 petrol krizi ile birlikte ekonomik büyümenin yavaşlaması yanında ithalat kalemleri arasında önemli bir yekünü tutan petrol (enerji) ithalatı dış ticaret dengesinde ciddi bozulmalara ve cari açık problemlerine yol açmıştır. Enerji fiyatlarındaki oynaklığın özellikle ithalatçı konumda olan ülkelerde sadece iç denge değil dış dengeler üzerindeki etkisi de çeşitli araştırmalarla ele alınmıştır (Killian, Rebucci, & Spatafora, 2009; Rotemberg & Woodford, 1996; Özlale & Pekkurnaz, 2010). Öte yandan özellikle ara mali ithalatı yaparak ekonomik büyümeyi sağlayan gelişmekte olan ülkeler liginde cari açık ve ekonomik büyüme ilişkisi oldukça belirgindir (Calderon, Chong, & Loayza, 2002; Aristovnik, 2007).
Petrol fiyatlarındaki ani yükseliş olumsuz bir arz şokudur ve bu durum küresel ekonomi üzerinde olumsuz bir etki yaratabilmektedir. (Tang, Wu, & Zhang, 2010) çalışmasında 1965 yılından bu yana yaşanan hemen hemen her durgunluktan önce petrol fiyatlarında artışın olduğuna işaret edilmiştir. Ancak bu durumun tersinin geçerli olduğuna dair ampirik bir kanıt bulunmamaktadır. Örneğin (Nasir, Naidoo, Shahbaz, & Amoo, 2018) çalışmasında da belirtildiği üzere dünya petrol fiyatlarında 2014 yılının ikinci çeyreğinden 2016’nın başına kadarki zaman diliminde ortaya çıkan % 70’lik düşüş, küresel ölçekte önemli bir büyümeye yol açmamıştır.
Gerek ülkemizde gerekse gelişmekte olan pek çok ülkede yaşanan ekonomik çalkantılar carı açığa ilişkin tartışmaları sürekli canlı tutmaktadır. Bu çalışmada farklı kaynaklara göre elektrik enerjisi üretiminin cari açık üzerindeki etkisi analiz edilmektedir. Çalışma 1990-2017 yıllarını kapsamaktadır. Toplam 140 ülkeyi içerecek şekilde yapılan analizde fosil yakıt kaynaklarını kullanan enerji santralleri, hidroelektrik santraller, nükleer santraller ve yenilenebilir enerji santrallerinde üretilen elektrik enerji paylarındaki değişimlerin cari açık üzerindeki etkisi araştırılmaktadır. Çalışmamızın bir sonraki bölümünde ampirik çalışmaya konu analizimizin teorik çerçevesi ele alınmaktadır. Veri seti ve ampirik analiz sonuçlarını anlattığımız bölüm, sonuç ve değerlendirmeler kısmı ile devam etmektedir.
TEORİK ÇERÇEVE
Enerji, ekonomik büyüme ve iktisadi kalkınma için çok önemlidir (Apaydın & Taşdoğan, 2019; Apaydın, Güngör, & Taşdoğan, 2019). Toplumlar geliştikçe, sadece üretim ihtiyacı için değil, bireysel kullanım için de daha fazla enerjiye ihtiyaç duymaktadır. Bu, son yüzyıldaki enerji tüketimindeki kesintisiz artış ile beliren ana eğilimi açıklayan bir durumdur (Llop, 2020).
Cari denge hesabı bir ekonominin gelecekteki davranışı için öncü göstergelerden biri olarak kullanılır ve politika yapıcılarının karar alma süreçlerinin önemli bir parçasıdır. Tipik gelişmiş ülkelerin aksine, çoğu gelişmekte olan ülke kredi kullanımı açısından kısıtlıdır. Gelişmekte olan ülkelerde hem iç hem de dış
göre farklılık gösterir (Calderon, Chong, & Loayza, 2002).
Dönemler arası yaklaşıma göre, cari işlemler açığı, verimlilik artışı, büyüme, devlet harcamaları, faiz oranları ve diğer bazı faktörlere ilişkin beklentiler ile şekillenen ileriye dönük dinamik tasarruf ve yatırım kararlarının bir sonucu olarak ortaya çıkmaktadır. Bu çerçevede, cari işlemler dengesi, verimlilikteki veya talepteki geçici şoklara karşı bir tampon görevi görmektedir (Obstfeld & Rogoff, 1996; Razin, 1993; Calderon, Chong, & Loayza, 2002).Bu yaklaşımdaki ana noktalardan biri, ekonomik değişimlerin cari işlemler dengesi üzerindeki etkisinin bu değişimlerin çıkış noktasına, katılığına ve zamanlamasına göre değişebileceğidir. Çıkış noktaları bakımından, şoklar ülkeye özgü veya küresel olabilmektedir. (Razin, 1993)’in küresel verimlilik şoklarının cari işlemler açığı üzerinde ülkeye özgü şoklardan daha küçük bir etkisi olduğunu tespit etmesi dikkate alınması gereken bir husus olarak görülmelidir. Benzer şekilde, ister geçici ister kalıcı olsun, katı şokların devam etmesi cari işlemler dengesinin farklı bir tepki vermesine yol açabilir. Kalıcı bir verimlilik şoku, cari işlemler açığını genişletebilir çünkü yatırımlarda bir artış ve tasarruflarda bir düşüş olabilir. Şokların zamanlaması, özellikle de iktisadi ajanlar tarafından beklendikleri veya beklenmedikleri duruma göre cari hesap üzerinde bir etki yaratır. Cari hesabı etkileyen faktörler ve uygulanan politikalar ülkelere spesifiktir ve farklı derecede kırılganlıklar içerebilir (Calderon, Chong, & Loayza, 2002).
1970’lerdeki küresel petrol (enerji) şokundan bu yana, makroekonomik dinamikler üzerine yapılan araştırmalar, petrol (enerji) fiyatlarındaki ani değişikliklerin birçok ekonomiyi etkilemesi muhtemel olan küresel bir şoka yol açabilecek ekonomik dalgalanmalara neden olabileceği ifade edilmektedir. Hatta ülkelerin etkilenmesi açısından bu durumun petrol ihraç ya da ithal etmek pozisyonlarından bağımsız olduğu vurgulanmaktadır (Nasir, Naidoo, Shahbaz, & Amoo, 2018).
Bir ekonominin dış ticarete bağımlılığı veya açık olması kaynakların doğru kullanılması noktasında bir güven noktası oluşturabilmekte ve bu durum ekonomik verimliliği artırabilmektedir. Diğer taraftan bu durum ticaret açığına yol açarak ekonomiyi yavaşlatma potansiyelini de içinde barındırır. Özellikle enerji kaynakları bağlamında ağırlıklı olarak ihracatçı ya da ithalatçı olmak beraberinde bazı kırılganlıkları da getirmektedir. Bir ihracatçı veya ithalatçı olarak petrole (enerji kaynağına) olan yoğun bağımlılık, ticaret dengesinin ötesinde iç ekonomiye olası etkileri de beraberinde getirmektedir (Nasir, Naidoo, Shahbaz, & Amoo, 2018).
Enerji fiyatları ve arzındaki şokların bir ekonominin enflasyon ve çıktı vb. makro değişkenlere etkisi (Barsky & Kilian, 2004; Hamilton J. , 2003; Killian,