IEEE SIGNAL PROCESSING LETTERS, VOL. 4, NO. 8, AUGUST 1997 213
Detection of Microcalcifications in
Mammograms Using Higher Order Statistics
M. Nafi G¨urcan,
Student Member, IEEE,Yasemin Yardımcı,
Member, IEEE,A. Enis ¸
Cetin,
Senior Member, IEEE,and Rashid Ansari
Abstract— A new method for detecting microcalcifications in mammograms is described. In this method, the mammogram im-age is first processed by a subband decomposition filterbank. The bandpass subimage is divided into overlapping square regions in which skewness and kurtosis as measures of the asymmetry and impulsiveness of the distribution are estimated. The detec-tion method utilizes these two parameters. A region with high positive skewness and kurtosis is marked as a region of interest. Simulation results show that this method is successful in detecting regions with microcalcifications.
Index Terms— Computer-aided diagnosis, higher order statis-tics, mammogram images, microcalcifications.
I. INTRODUCTION
T
INY calcium deposits in breast tissues tht appear as small bright spots in mammograms are calledmicrocalcifica-tions. Microcalcification clusters are an early sign of breast
cancer, a leading cause of death in women. Microcalcification sizes vary from 0.01–1 mm . With the current 50 micron scanning technology, the smallest microcalcification appears as a 2 2 bright region in the digital mammogram image. Since these regions are small and subtle abnormalities, they may be overlooked by an examining radiologist. Therefore, digitally enhanced mammogram images will be helpful in the diagnosis process [1]–[5].
Recently, a variety of computerized detection schemes based on the wavelet transform have been proposed to give radi-ologists a “second opinion” [1]–[4]. In these schemes, the mammogram image is first passed through a subband decom-posing filterbank. The subband images are weighted to enhance the microcalcification locations. A new image is reconstructed from the weighted subimages. In the detection step, global and local gray-level thresholds are applied to the reconstructed image to extract possible microcalcification locations. These locations are grouped to identify microcalcification clusters. It should be noted that the reconstructed image in [1]–[4] is essentially very close to a bandpass filtered version of the original mammogram image.
Manuscript received March 18, 1997. This work was supported by the Technology Development Foundation of Turkey under TTGV-199 and in part by NSF Grant 9406954. The associate editor coordinating the review of this manuscript and approving it for publication was Prof. R. Mersereau.
M. N. G¨urcan, Y. Yardımcı, and A. E. ¸Cetin are with the Department of Electrical and Electronics Engineering, Bilkent University, TR-06533 Bilkent, Ankara, Turkey (e-mail: [email protected]).
R. Ansari is with the Department of Electrical Engineering, University of Illinois, Chicago, IL 60607-7053 USA.
Publisher Item Identifier S 1070-9908(97)05973-7.
In this letter, contrary to the previous work, the detection is carried out in the subband domain. The mammogram image is first processed by a subband decomposition fil-terbank. The resulting bandpass subimage is analyzed to detect microcalcification clusters. Since microcalcifications are small isolated bright regions, they produce outliers in the bandpass and highpass subimages. As third- and fourth-order correlation parameters, skewness and kurtosis, are measures of the asymmetry and impulsiveness of the distribution, they can be used to find the locations of microcalcification clusters. The subimages are first divided into overlapping square regions in which the skewness and kurtosis are estimated. If a region has high positive skewness and kurtosis, then it is marked as a re-gion of interest. Experimental studies show that this method is successful in detecting regions containing microcalcifications. In the following section, skewness and kurtosis concepts are reviewed. In Section III, the detection scheme is explained.
II. DETECTION PARAMETERS: SKEWNESS AND KURTOSIS Higher order statistical (HOS) parameters were utilized in various image classification and recognition applications [6]–[8]. In [8], the higher order spectrum was used to an-alyze the cancerous lesions in mammogram images. In this paper, third- and fourth-order correlations are used to detect microcalcification clusters that lead to cancerous lesions.
For a random variable , third-order correlation parameter, skewness, is defined as [9]
E E
E E (1)
and is a measure of the symmetry of the distribution. An estimate of the skewness is given by
(2)
where and are the estimates of the mean and standard
deviation over observations ( ).
Similarly, for a random variable , the kurtosis is defined as
E E
E E (3)
214 IEEE SIGNAL PROCESSING LETTERS, VOL. 4, NO. 8, AUGUST 1997
(a)
(b)
Fig. 1. Histogram of a region (a) with a microcalcification cluster and (b) without microcalcifications in the bandpass image.
and is a measure of the heaviness of the tails in a distribution. An estimate of the kurtosis is given by
(4) where and are defined as above. For the Gaussian distribution and are equal to zero.
Preliminary analysis was carried out on images taken from a set digitized by N. Karssemeijer of University Hospital, Nijmegen, The Netherlands, which have an associated ground truth file. Since microcalcifications are small isolated bright regions, they produce outliers in the bandpass and highpass subimages. Consequently, the symmetry of the distribution of bandpass image coefficients is destroyed in regions containing microcalcifications as shown in Fig. 1. Outliers due to micro-calcifications have high positive values and accordingly appear in the right-hand tail of the distribution. Hence, the tails of the distribution are heavier, and the skewness and kurtosis assume high values. Therefore, a statistical test based on skewness and
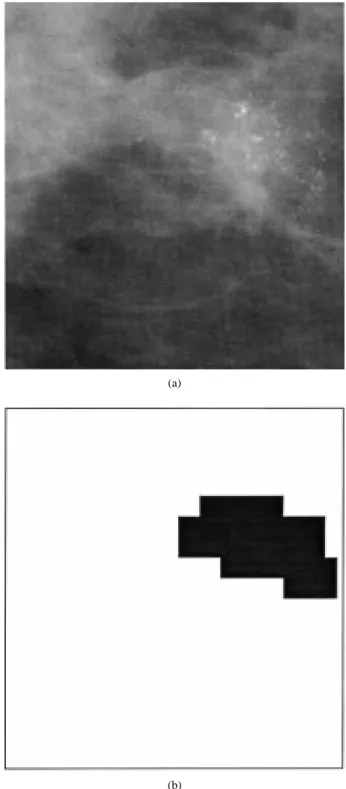
(a)
(b)
Fig. 2. (a) Part of a mammogram image. (b) Regions with microcalcifica-tions.
kurtosis is effective in finding regions with asymmetrical and heavier tailed distributions.
III. DETECTIONSCHEME ANDEXPERIMENTAL STUDIES The microcalcification detection scheme is a two-stage procedure as discussed in Section I. In the first stage, the mammogram image is processed by a filterbank without the downsampling operations. The impact of microcalcifications is investigated in lowpass, bandpass, and highpass subimages as well as the original image. Among these images, the
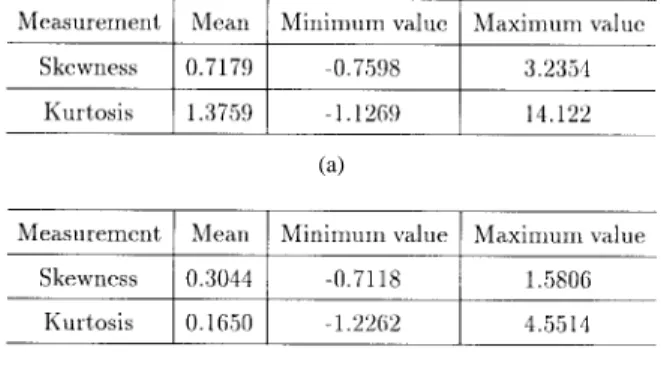
G ¨URCAN et al.: DETECTION OF MICROCALCIFICATIONS IN MAMMOGRAMS 215 TABLE I
MEASUREMENTS ON THEORIGINALIMAGE: (a) REGIONS WITH
MICROCALCIFICATIONS AND(b) REGIONSWITHOUTMICROCALCIFICATIONS
(a)
(b)
discriminating information due to abnormalities was experi-mentally found to be primarily concentrated in the bandpass
subimage corresponding to . In
the second stage of the algorithm this subimage in which the microcalcifications are emphasized and background details are suppressed, is divided into overlapping small square regions where skewness and kurtosis are individually estimated. Fig. 1(a) shows the histogram of a 30 30 square region of the bandpass subimage containing microcalcifications. Notice that, due to microcalcifications, the histogram has a heavier tail and is asymmetric. The parameters and are 1.5616 and 9.0307 in Fig. 1(a), whereas in Fig. 1(b), which is the histogram of a 30 30 region with no microcalcifications,
the HOS parameters and are 0.0722 and ,
respectively. In Fig. 1(a), and are distinctly greater than zero, and in Fig. 1(b) they are very close to zero, indicating that the regions with no microcalcifications have a Gaussian-like distribution, whereas the regions with microcalcifications deviate from the Gaussian. Therefore, a statistical test based on skewness and kurtosis is effective in finding regions with asymmetrical and heavier tailed distributions. The microcal-cification detection problem is posed as a hypothesis testing problem in which the null hypothesis, , corresponds to the case of no microcalcifications against the alternative , as follows.
• Microcalcifications are not present in the region. • Microcalcifications are present in the region. This hypothesis testing problem is reduced to the following decision rule based on skewness and kurtosis
or
and (5)
where and are experimentally determined thresholds. In Tables I–III, statistics of skewness and kurtosis measure-ments on original, bandpass, and highpass filtered images in regions with and without microcalcifications are given. These measurements are obtained from 100 30 30 blocks with microcalcifications and 100 blocks without microcalcifications on a total of five images (isolated microcalcifications, which are not part of a microcalcification cluster, are considered to be neutral because they are not early signs of breast cancer). By examining Tables I–III, one can conclude that skewness and
TABLE II
MEASUREMENTS ON THEBANDPASSFILTEREDIMAGE: (a) REGIONS WITH
MICROCALCIFICATIONS AND(b) REGIONSWITHOUTMICROCALCIFICATIONS
(a)
(b)
TABLE III
MEASUREMENTS ON THEHIGHPASSFILTEREDIMAGE: (a) REGIONS WITH
MICROCALCIFICATIONS AND(a) REGIONSWITHOUTMICROCALCIFICATIONS
(a)
(b)
kurtosis parameters are not indicative of microcalcifications on original images, whereas they are most discriminating in the detection for bandpass filtered images. For the bandpass images, neither skewness nor kurtosis measurements had an overlapping region under hypotheses and .
In Fig. 2(a), a part of a mammogram image that contains a cluster of microcalcifications is shown. Fig. 2(b) illustrates the result of our detection algorithm, the black squares indi-cating suspicious regions. The proposed detection scheme is successful in finding all the critical regions in this example and in tests with 40 different mammogram images of size 2048 2048, which constitute all the available images in the Nijmegen database. In the tests, the size of the square regions is chosen to be 30 30 with an overlap size of 15. The experimentally determined thresholds for skewness and kurtosis are 0.51 and 0.85, respectively. These threshold levels are chosen slightly below the maxima of the skewness and kurtosis values of the no microcalcification case so that no regions with microcalcifications are missed. In the experiments using these thresholds, all of the 105 microcalcification clusters in the image data base are detected with an average of 3.3 false alarms per mammogram image.
ACKNOWLEDGMENT
The authors would like to thank Prof. G. Giannakis and the reviewers for their invaluable comments.
216 IEEE SIGNAL PROCESSING LETTERS, VOL. 4, NO. 8, AUGUST 1997 REFERENCES
[1] H. Yoshida, K. Doi, R. M. Nishikawa, and M. L. Giger, “An improved computer-assisted diagnostic scheme using wavelet transform for de-tecting clustered microcalcifications in digital mammograms,” Acad.
Radiol., vol. 3, pp. 621–627, Aug. 1996.
[2] H. Yoshida, K. Doi, and R. M. Nishikawa, “Automated detection of clustered microcalcifications in digital mammograms using wavelet transform techniques,” in Proc. SPIE, 1994, vol. 2167, pp. 868–886. [3] H. Yoshida et al., “Optimizing wavelet transform based on supervised
learning for detection of microcalcifications in digital mammograms,” in Proc. IEEE Int. Conf. Image Processing, 1995, pp. 152–155. [4] R. N. Strickland and H. I. Hahn, “Wavelet transforms for detecting
microcalcifications in mammograms,” IEEE Trans. Med. Imag., vol. 15, pp. 218–229, Apr. 1996.
[5] C. N. Adams et al., “Evaluating quality and utility of digital
mammo-grams and lossy compressed digital mammomammo-grams,” in Proc. 3rd Int.
Workshop on Digital Mammography, Chicago, IL, June 9–12, 1996, pp.
169–176; also in Signal Process., 1997.
[6] G. B. Giannakis and M. K. Tsatsanis, “A unifying maximum—Likelihood view of cumulant and polyspectral measures for non-Gaussian signal classification and estimation,” IEEE Trans.
Inform. Theory, vol. 38, pp. 386–406, Mar. 1992.
[7] M. K. Tsatsanis and G. B. Giannakis, “Object and texture classification using higher-order statistics,” IEEE Trans. Pattern Anal. Machine Intell., vol. 14, pp. 733–750, July 1992.
[8] P. T. Stathaki and A. G. Constantinides, “Higher order spectral esti-mation techniques in mammography,” in Proc. Int. Conf. on Digital
Signal Processing and Int. Conf. Computer Applications to Engineering Systems, Cyprus, July 1993, vol. 1, pp. 276–280.
[9] P. J. Bickel and K. A. Doksum, Mathematical Statistics. San Francisco, CA: Holden-Day, 1977.