We experimentally and theoretically studied a left-handed structure based on a photonic crystal共PC兲 with a negative refractive index. The structure consists of triangular array of rectangular dielectric bars with dielectric constant 9.61. Experimental and theoretical results demonstrate the negative refraction and the superlensing phenomena in the microwave regime. The results show high transmission for our structure for a wide range of incident angles. Furthermore, surface termination within a specific cut of the structure excite surface waves at the interface between air and PC and allow the reconstruction of evanescent waves for a better focus and better transmission. The normalized average field intensity calculated in both the source and image planes shows almost the same full width at half maximum for the source and the focused beam.
DOI: 10.1103/PhysRevB.71.085106 PACS number共s兲: 42.25.⫺p, 78.20.Ci, 41.20.Jb
Left-handed-materials共LHM兲 are materials with simulta-neously negative dielectric permittivity 共r兲 and negative magnetic permeability共r兲. The phase velocity of the light wave propagating inside this medium is pointed in the oppo-site direction of the energy flow. Thus, the Poynting vector and wave vector are antiparallel, consequently, the light is refracted negatively. The existence and impact of such mate-rials was pointed out by Veselago.1Years later, several theo-retical and experimental groups investigated the LHM.2–5For LHM based on photonic crystals共PCs兲, Notomi studied light propagation in a strongly modulated two-dimensional 共2D兲 PC.6 Luo et al. have studied subwavelength imagining in PCs.7 Cubukcu et al. demonstrated experimentally single-beam negative refraction and superlensing in the valence band of 2D PCs operating in the microwave regime.8 Foteinopoulou et al. emphasized the time evolution of an EM wave as it hits the interface between a right-handed共RH兲 and a LH material interface.9Pendry suggested that a slab of lossless LHM with both共r兲 and 共r兲 equal to ⫺1 should behave as a perfect lens,10i.e, the small details as well as the larger ones could be reproduced by such a lens. The recon-struction of the evanescent wave components is the key to such perfect focusing. It is shown in another study11how the evanescent waves get amplified upon reaching the interface between a RH and LH medium and consequently how they participate in improving the quality of the image. Homoge-neous metamaterials and PCs were used to demonstrate the effect. The main challenge is to find a structure with n = −1 for which the matching condition are verified with no reflec-tions. The candidate structure should have three characteris-tics. First, it should exhibit almost isotropic equal frequency surfaces共EFS兲 in a band region with vg· k⬍0, with k being
the wave vector in the first Brillouin zone共BZ兲 and vgis the
group velocity. The latter implies S · k⬍0,12 and thus LH behavior.5 Second, it should guarantee the absence of any higher order Bragg reflections for any angle of incidence. Finally it should guarantee single beam propagation.
In this paper we propose such an almost ideal structure based on a PC. The proposed structure meets all the required
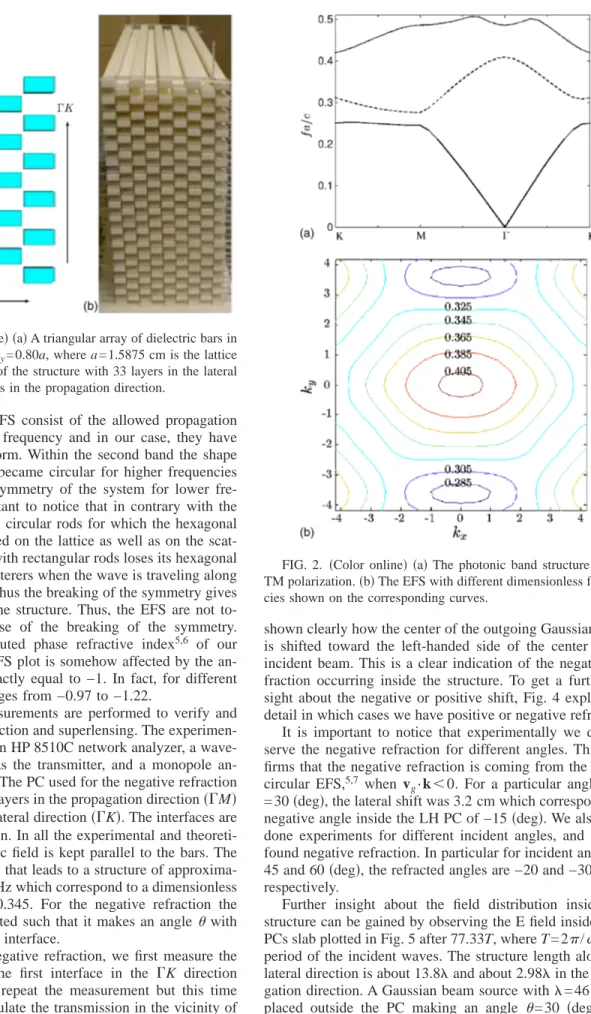
conditions and has a high transmission at the desired fre-quency as well as a refractive index very close to n = −1. As it will be discussed below, the refractive index ranges from −0.97 to −1.22 because of the anisotropy. Additionally, with an appropriate cut and a specific termination of the surface, the proposed structure focuses the image in a better way by exciting the surface waves and enabling them to contribute toward the quality of the image. Furthermore, for different incident angles, the cut structure demonstrates a high trans-mission as well as a maximum coupling with the surface modes at the interfaces. The proposed structure consists of a triangular array of dielectric bars with a dielectric constant =9.61 in air. The dimensions of each bar in the x and y directions are, respectively, rx= 0.40a and ry= 0.80a where a = 1.5875 cm is the center to center separation between bars.
The length of each bar is l = 45.72 cm. Figure 1 shows the structure with more details. Only the TM modes are consid-ered here共the E field is parallel to the rods兲.
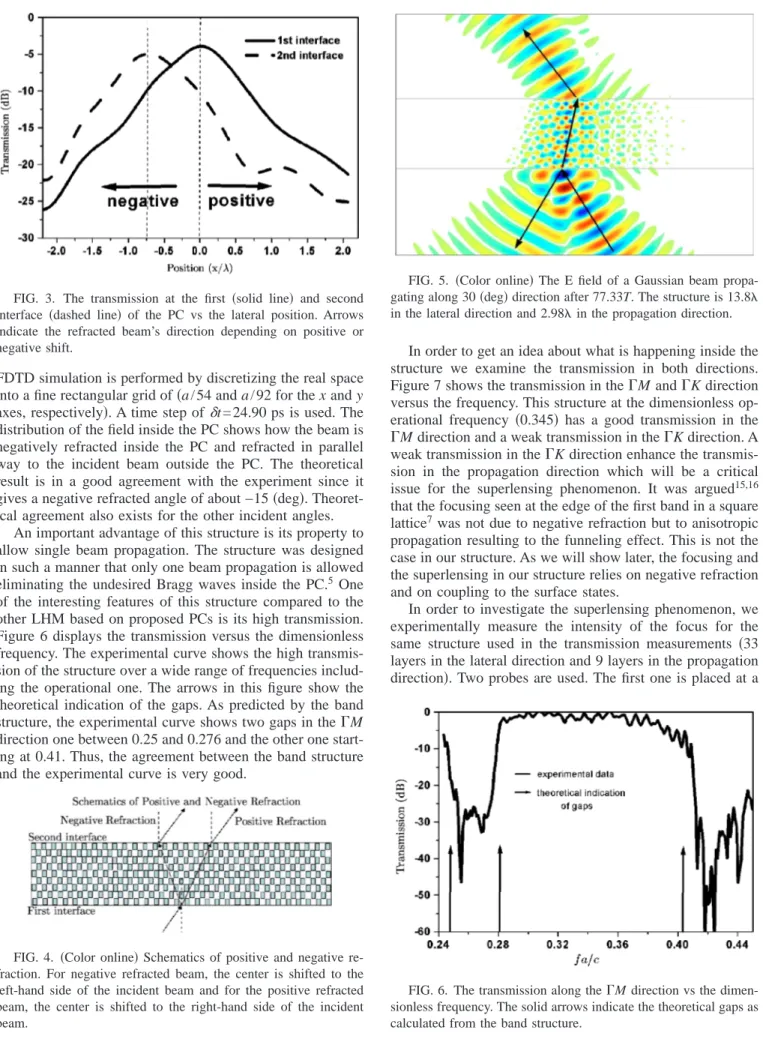
The plane wave method is used to compute the photonic band structure as well as the EFS. Some of the theoretical results are obtained using the finite difference time domain 共FDTD兲 method. This method shows a time and space evo-lution of the emitted EM waves. More details of this algo-rithm can be found in Ref. 13. In all the FDTD simulations we report, Liao boundary conditions14 are used. Depending on the desired conditions for the case under study, the source emits a monochromatic TM-共E-兲 polarization of desired di-mensionless frequency. A Gaussian source 共Gaussian in space and “almost” monochromatic兲 is placed outside the structure to check the negative refraction. However, a point source also excites the surface waves at the interface be-tween RH and LH material. The photonic band structure as well as the EFS in k space are shown in Fig. 2. The quantity 共fa/c兲 is the dimensionless frequency where c is the velocity of light and a is the lattice constant. A region in the second band, extending from 0.313 to 0.41, has vg· k⬍0 and is of
particular interest. To study the system and to compute the refractive index, the EFS are plotted for different
frequen-cies. Note that the EFS consist of the allowed propagation modes for a specific frequency and in our case, they have closed concavelike form. Within the second band the shape of the EFS tends to became circular for higher frequencies and reproduces the symmetry of the system for lower fre-quencies. It is important to notice that in contrary with the triangular lattice with circular rods for which the hexagonal symmetry is conserved on the lattice as well as on the scat-terers, this structure with rectangular rods loses its hexagonal symmetry for the scatterers when the wave is traveling along a specific direction. Thus the breaking of the symmetry gives some anisotropy in the structure. Thus, the EFS are not to-tally isotropic because of the breaking of the symmetry. Therefore, the computed phase refractive index5,6 of our structure using the EFS plot is somehow affected by the an-isotropy. It is not exactly equal to −1. In fact, for different incident angles it ranges from −0.97 to −1.22.
Transmission measurements are performed to verify and test the negative refraction and superlensing. The experimen-tal setup consists of an HP 8510C network analyzer, a wave-guide horn antenna as the transmitter, and a monopole an-tenna as the receiver. The PC used for the negative refraction experiment has nine layers in the propagation direction共⌫M兲 and 33 layers in the lateral direction共⌫K兲. The interfaces are along the⌫K direction. In all the experimental and theoreti-cal results, the electric field is kept parallel to the bars. The operational frequency that leads to a structure of approxima-tively n = −1 is 6.5 GHz which correspond to a dimensionless frequency of fa / c = 0.345. For the negative refraction the horn antenna is oriented such that it makes an angle with the normal to the⌫K interface.
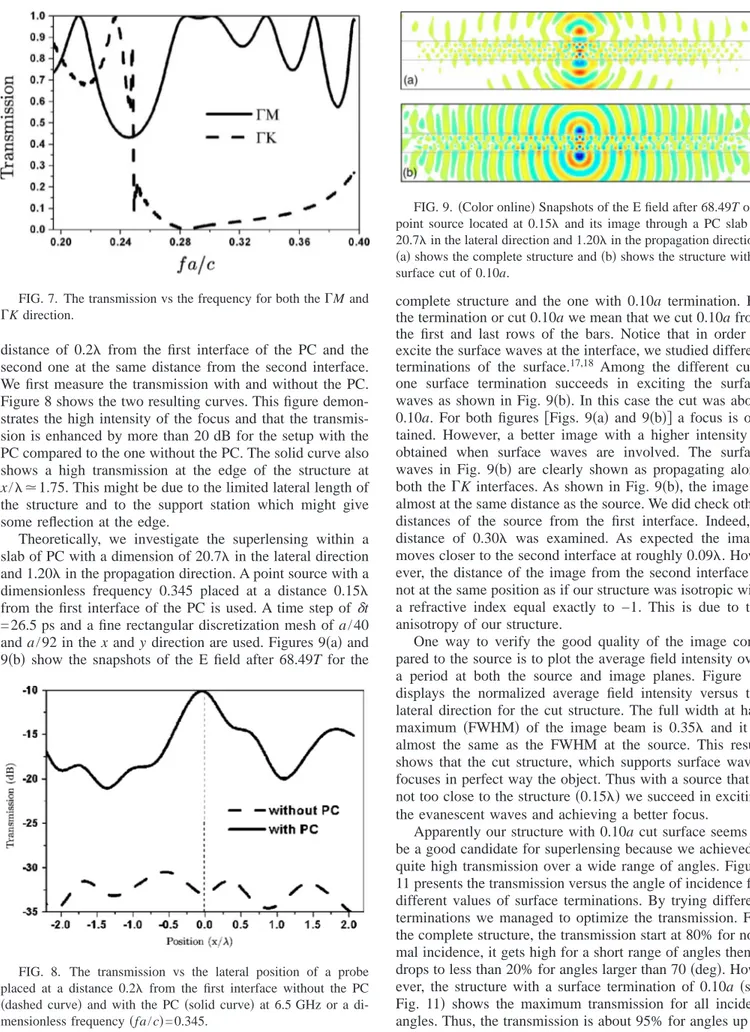
To examine the negative refraction, we first measure the transmission along the first interface in the ⌫K direction without the PC. We repeat the measurement but this time with the PC and calculate the transmission in the vicinity of the second interface. The results are plotted in Fig. 3. It is
shown clearly how the center of the outgoing Gaussian beam is shifted toward the left-handed side of the center of the incident beam. This is a clear indication of the negative re-fraction occurring inside the structure. To get a further in-sight about the negative or positive shift, Fig. 4 explains in detail in which cases we have positive or negative refraction. It is important to notice that experimentally we did ob-serve the negative refraction for different angles. This con-firms that the negative refraction is coming from the almost circular EFS,5,7 when v
g· k⬍0. For a particular angle of
= 30共deg兲, the lateral shift was 3.2 cm which correspond to a negative angle inside the LH PC of −15共deg兲. We also have done experiments for different incident angles, and always found negative refraction. In particular for incident angles of 45 and 60共deg兲, the refracted angles are −20 and −30 共deg兲, respectively.
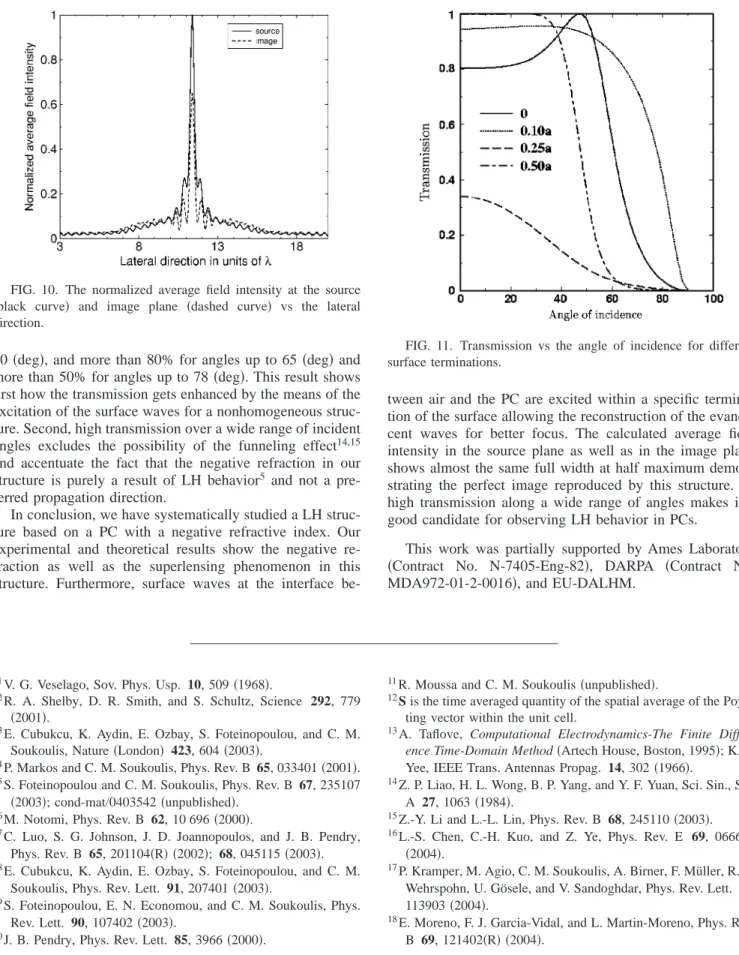
Further insight about the field distribution inside this structure can be gained by observing the E field inside a LH PCs slab plotted in Fig. 5 after 77.33T, where T = 2/is the period of the incident waves. The structure length along the lateral direction is about 13.8 and about 2.98 in the propa-gation direction. A Gaussian beam source with=46 mm is placed outside the PC making an angle = 30 共deg兲 with respect to the interface which lies in the⌫K direction. The
FIG. 1.共Color online兲 共a兲 A triangular array of dielectric bars in air with rx= 0.40a and ry= 0.80a, where a = 1.5875 cm is the lattice constant.共b兲 A picture of the structure with 33 layers in the lateral direction and nine layers in the propagation direction.
FIG. 2. 共Color online兲 共a兲 The photonic band structure for the TM polarization.共b兲 The EFS with different dimensionless frequen-cies shown on the corresponding curves.
FDTD simulation is performed by discretizing the real space into a fine rectangular grid of共a/54 and a/92 for the x and y axes, respectively兲. A time step of␦t = 24.90 ps is used. The
distribution of the field inside the PC shows how the beam is negatively refracted inside the PC and refracted in parallel way to the incident beam outside the PC. The theoretical result is in a good agreement with the experiment since it gives a negative refracted angle of about −15共deg兲. Theoret-ical agreement also exists for the other incident angles.
An important advantage of this structure is its property to allow single beam propagation. The structure was designed in such a manner that only one beam propagation is allowed eliminating the undesired Bragg waves inside the PC.5 One of the interesting features of this structure compared to the other LHM based on proposed PCs is its high transmission. Figure 6 displays the transmission versus the dimensionless frequency. The experimental curve shows the high transmis-sion of the structure over a wide range of frequencies includ-ing the operational one. The arrows in this figure show the theoretical indication of the gaps. As predicted by the band structure, the experimental curve shows two gaps in the⌫M direction one between 0.25 and 0.276 and the other one start-ing at 0.41. Thus, the agreement between the band structure and the experimental curve is very good.
In order to get an idea about what is happening inside the structure we examine the transmission in both directions. Figure 7 shows the transmission in the⌫M and ⌫K direction versus the frequency. This structure at the dimensionless op-erational frequency 共0.345兲 has a good transmission in the ⌫M direction and a weak transmission in the ⌫K direction. A weak transmission in the⌫K direction enhance the transmis-sion in the propagation direction which will be a critical issue for the superlensing phenomenon. It was argued15,16 that the focusing seen at the edge of the first band in a square lattice7was not due to negative refraction but to anisotropic propagation resulting to the funneling effect. This is not the case in our structure. As we will show later, the focusing and the superlensing in our structure relies on negative refraction and on coupling to the surface states.
In order to investigate the superlensing phenomenon, we experimentally measure the intensity of the focus for the same structure used in the transmission measurements 共33 layers in the lateral direction and 9 layers in the propagation direction兲. Two probes are used. The first one is placed at a
FIG. 3. The transmission at the first 共solid line兲 and second interface 共dashed line兲 of the PC vs the lateral position. Arrows indicate the refracted beam’s direction depending on positive or negative shift.
FIG. 4. 共Color online兲 Schematics of positive and negative re-fraction. For negative refracted beam, the center is shifted to the left-hand side of the incident beam and for the positive refracted beam, the center is shifted to the right-hand side of the incident beam.
FIG. 5. 共Color online兲 The E field of a Gaussian beam propa-gating along 30共deg兲 direction after 77.33T. The structure is 13.8 in the lateral direction and 2.98 in the propagation direction.
FIG. 6. The transmission along the⌫M direction vs the dimen-sionless frequency. The solid arrows indicate the theoretical gaps as calculated from the band structure.
distance of 0.2 from the first interface of the PC and the second one at the same distance from the second interface. We first measure the transmission with and without the PC. Figure 8 shows the two resulting curves. This figure demon-strates the high intensity of the focus and that the transmis-sion is enhanced by more than 20 dB for the setup with the PC compared to the one without the PC. The solid curve also shows a high transmission at the edge of the structure at
x /⯝1.75. This might be due to the limited lateral length of
the structure and to the support station which might give some reflection at the edge.
Theoretically, we investigate the superlensing within a slab of PC with a dimension of 20.7 in the lateral direction and 1.20 in the propagation direction. A point source with a dimensionless frequency 0.345 placed at a distance 0.15 from the first interface of the PC is used. A time step of␦t
= 26.5 ps and a fine rectangular discretization mesh of a / 40 and a / 92 in the x and y direction are used. Figures 9共a兲 and 9共b兲 show the snapshots of the E field after 68.49T for the
complete structure and the one with 0.10a termination. By the termination or cut 0.10a we mean that we cut 0.10a from the first and last rows of the bars. Notice that in order to excite the surface waves at the interface, we studied different terminations of the surface.17,18 Among the different cuts, one surface termination succeeds in exciting the surface waves as shown in Fig. 9共b兲. In this case the cut was about 0.10a. For both figures 关Figs. 9共a兲 and 9共b兲兴 a focus is ob-tained. However, a better image with a higher intensity is obtained when surface waves are involved. The surface waves in Fig. 9共b兲 are clearly shown as propagating along both the⌫K interfaces. As shown in Fig. 9共b兲, the image is almost at the same distance as the source. We did check other distances of the source from the first interface. Indeed, a distance of 0.30 was examined. As expected the image moves closer to the second interface at roughly 0.09. How-ever, the distance of the image from the second interface is not at the same position as if our structure was isotropic with a refractive index equal exactly to −1. This is due to the anisotropy of our structure.
One way to verify the good quality of the image com-pared to the source is to plot the average field intensity over a period at both the source and image planes. Figure 10 displays the normalized average field intensity versus the lateral direction for the cut structure. The full width at half maximum 共FWHM兲 of the image beam is 0.35 and it is almost the same as the FWHM at the source. This result shows that the cut structure, which supports surface waves focuses in perfect way the object. Thus with a source that is not too close to the structure共0.15兲 we succeed in exciting the evanescent waves and achieving a better focus.
Apparently our structure with 0.10a cut surface seems to be a good candidate for superlensing because we achieved a quite high transmission over a wide range of angles. Figure 11 presents the transmission versus the angle of incidence for different values of surface terminations. By trying different terminations we managed to optimize the transmission. For the complete structure, the transmission start at 80% for nor-mal incidence, it gets high for a short range of angles then it drops to less than 20% for angles larger than 70共deg兲. How-ever, the structure with a surface termination of 0.10a 共see Fig. 11兲 shows the maximum transmission for all incident angles. Thus, the transmission is about 95% for angles up to
FIG. 7. The transmission vs the frequency for both the⌫M and
⌫K direction.
FIG. 8. The transmission vs the lateral position of a probe placed at a distance 0.2 from the first interface without the PC
共dashed curve兲 and with the PC 共solid curve兲 at 6.5 GHz or a
di-mensionless frequency共fa/c兲=0.345.
共a兲 shows the complete structure and 共b兲 shows the structure with a
40共deg兲, and more than 80% for angles up to 65 共deg兲 and more than 50% for angles up to 78共deg兲. This result shows first how the transmission gets enhanced by the means of the excitation of the surface waves for a nonhomogeneous struc-ture. Second, high transmission over a wide range of incident angles excludes the possibility of the funneling effect14,15 and accentuate the fact that the negative refraction in our structure is purely a result of LH behavior5 and not a pre-ferred propagation direction.
In conclusion, we have systematically studied a LH struc-ture based on a PC with a negative refractive index. Our experimental and theoretical results show the negative re-fraction as well as the superlensing phenomenon in this structure. Furthermore, surface waves at the interface
be-tween air and the PC are excited within a specific termina-tion of the surface allowing the reconstructermina-tion of the evanes-cent waves for better focus. The calculated average field intensity in the source plane as well as in the image plane shows almost the same full width at half maximum demon-strating the perfect image reproduced by this structure. Its high transmission along a wide range of angles makes it a good candidate for observing LH behavior in PCs.
This work was partially supported by Ames Laboratory 共Contract No. N-7405-Eng-82兲, DARPA 共Contract No. MDA972-01-2-0016兲, and EU-DALHM.
1V. G. Veselago, Sov. Phys. Usp. 10, 509共1968兲.
2R. A. Shelby, D. R. Smith, and S. Schultz, Science 292, 779 共2001兲.
3E. Cubukcu, K. Aydin, E. Ozbay, S. Foteinopoulou, and C. M.
Soukoulis, Nature共London兲 423, 604 共2003兲.
4P. Markos and C. M. Soukoulis, Phys. Rev. B 65, 033401共2001兲. 5S. Foteinopoulou and C. M. Soukoulis, Phys. Rev. B 67, 235107
共2003兲; cond-mat/0403542 共unpublished兲. 6M. Notomi, Phys. Rev. B 62, 10 696共2000兲.
7C. Luo, S. G. Johnson, J. D. Joannopoulos, and J. B. Pendry,
Phys. Rev. B 65, 201104共R兲 共2002兲; 68, 045115 共2003兲.
8E. Cubukcu, K. Aydin, E. Ozbay, S. Foteinopoulou, and C. M.
Soukoulis, Phys. Rev. Lett. 91, 207401共2003兲.
9S. Foteinopoulou, E. N. Economou, and C. M. Soukoulis, Phys.
Rev. Lett. 90, 107402共2003兲.
10J. B. Pendry, Phys. Rev. Lett. 85, 3966共2000兲.
11R. Moussa and C. M. Soukoulis共unpublished兲.
12S is the time averaged quantity of the spatial average of the
Poyn-ting vector within the unit cell.
13A. Taflove, Computational Electrodynamics-The Finite Differ-ence Time-Domain Method共Artech House, Boston, 1995兲; K. S.
Yee, IEEE Trans. Antennas Propag. 14, 302共1966兲.
14Z. P. Liao, H. L. Wong, B. P. Yang, and Y. F. Yuan, Sci. Sin., Ser.
A 27, 1063共1984兲.
15Z.-Y. Li and L.-L. Lin, Phys. Rev. B 68, 245110共2003兲. 16L.-S. Chen, C.-H. Kuo, and Z. Ye, Phys. Rev. E 69, 066612
共2004兲.
17P. Kramper, M. Agio, C. M. Soukoulis, A. Birner, F. Müller, R. B.
Wehrspohn, U. Gösele, and V. Sandoghdar, Phys. Rev. Lett. 92, 113903共2004兲.
18E. Moreno, F. J. Garcia-Vidal, and L. Martin-Moreno, Phys. Rev.
B 69, 121402共R兲 共2004兲. FIG. 10. The normalized average field intensity at the source
共black curve兲 and image plane 共dashed curve兲 vs the lateral
direction.
FIG. 11. Transmission vs the angle of incidence for different surface terminations.