NEGATIVE REFRACTION USING
TRUE LEFT-HANDED METAMATERIALS
A THESIS
SUBMITTED TO THE DEPARTMENT OF PHYSICS AND THE INSTITUTE OF ENGINEERING AND SCIENCE
OF BİLKENT UNIVERSITY
IN PARTIAL FULFILLMENT OF THE REQUIREMENTS FOR THE DEGREE OF
MASTER OF SCIENCE
By
Koray Aydın
I certify that I have read this thesis and that in my opinion it is fully adequate, in scope and in quality, as a dissertation for the degree of Master of Science.
___________________________________ Prof. Dr. Ekmel Özbay (Supervisor)
I certify that I have read this thesis and that in my opinion it is fully adequate, in scope and in quality, as a dissertation for the degree of Master of Science.
___________________________________ Prof. Dr. Alexander Shumovsky
I certify that I have read this thesis and that in my opinion it is fully adequate, in scope and in quality, as a dissertation for the degree of Master of Science.
___________________________________ Assist. Prof. Dr. Vakur B. Ertürk
Approved for the Institute of Engineering and Science:
___________________________________ Prof. Dr. Mehmet Baray,
Abstract
NEGATIVE REFRACTION USING TRUE
LEFT-HANDED METAMATERIALS
Koray Aydın
M. S. in Physics
Supervisor: Prof. Dr. Ekmel Özbay
September 2004
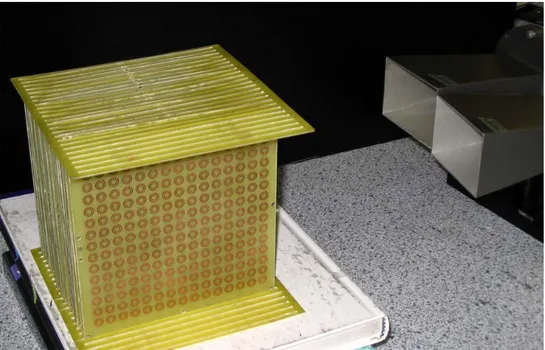
Left-handed materials and negative refraction attracted a great amount of attention in recent years due to their unique physical properties. It is possible to obtain a left-handed material by combining a novel artificial structure (split ring resonator) and a wire structure periodically. We investigated the transmission and reflection properties of split ring resonators (SRR), wires and composite metamaterials consisting of SRR and wire structures. We have successfully demonstrated true left-handed behavior in free space with a high transmission peak (-1.2 dB). This is the highest transmission peak reported for a left-handed material. The left-handed transmission band coincides exactly with the region where both dielectric permittivity and magnetic permeability have negative values. We proposed and demonstrated a new method to distinguish the magnetic resonance of the SRR structures.
We experimentally confirmed that composite metamaterial has a negative refractive index, at the frequencies where left-handed transmission takes place. Phase shift between consecutive numbers of layers of CMM is measured and phase velocity is shown to be negative at the relevant frequency range. Refractive index values obtained from the refraction experiments (-1.87) and the phase shift experiments (-1.78) are in good agreement.
Keywords: Left-Handed Material, Composite Metamaterial, Split Ring Resonator, Negative Permittivity, Negative Permeability, Effective Medium Theory, Photonic Band Gap, Negative Refraction, Negative Phase Velocity.
Özet
GERÇEK SOLAK MATERYALLER KULLANARAK
NEGATİF KIRILMA ELDE EDİLMESİ
Koray Aydın
Fizik Yüksek Lisans
Tez Yöneticisi: Prof. Dr. Ekmel Özbay
Eylül 2004
Solak materyaller ve negatif kırılma kendilerine has fiziksel özellikleri dolayısıyla günümüzde oldukça ilgi çeken konular haline gelmişlerdir. Yeni bir yapay yapı olan yarıklı halka rezonatörleri ve ince tel yapıları kullanılarak solak materyal elde etmek mümkündür. Bu çalışmada yarıklı halka rezonatörleri, tel yapıları ve bu ikisinin bir araya getirilmesiyle oluşan karma ara-maddelerde geçirgenlik ve yansıma özelliklerini inceledik. Gerçek solak davranış sergileyen ve yüksek geçirgenliğe (-1.2 dB) sahip olan karma ara-maddeler başarıyla gösterildi. Bu geçirgenlik değeri bugüne kadar rapor edilmiş olan en yüksek değerdir. Solak geçirgenlik bandı hem dielektrik permitivite hem de magnetik permeabilitenin eksi değerler aldığı frekans bölgesinde yer almaktadır. Yarıklı halka rezonatörlerinin magnetik rezonansını belirleyebilmek için yeni bir metod geliştirdik ve bu metodu deneysel olarak da doğruladık.
Solak geçirgenliğin olduğu frekans aralığında karma ara-maddenin eksi kırılma indeksine sahip olduğunu deneysel olarak kanıtladık. İki farklı uzunluktaki karma ara-maddelerin faz farkı ölçülmek suretiyle, ilgili frekans aralıklarında bu yapıların eksi faz hızına sahip oldukları gösterildi. Kırılma deneyinden elde edilen kırılma indeksi (-1.87) ile faz farkından hesaplanan kırılma indeksi (-1.78) birbirlerine oldukça yakın değerlere sahiptirler.
Anahtar Sözcükler: Solak Materyal, Karma Ara-Madde, Yarıklı Halka Rezonatörü, Negatif Permitivite, Negatif Permeabilite, Efektif Ortam Teorisi, Fotonik Bant Aralığı, Negatif Kırılma, Negatif Faz Hızı.
Acknowledgements
It is my pleasure to express my deepest gratitude and respect to Prof. Dr. Ekmel Özbay for his invaluable guidance, helpful suggestions and endless support. His personal and academic virtue shaped my academic personality and changed my approach to scientific study. I am very lucky to have the opportunity to study under his tutelage.
I would like to thank to the members of my thesis committee, Prof. Dr. Alexander Shumovsky and Assist. Prof. Dr. Vakur B. Ertürk, for reading the manuscript and commenting on the thesis.
Very special thanks to Dr. Mehmet Bayındır from whom I learnt a lot, including the importance of hard work. His invaluable advice and superior motivation during my difficult times kept me standing. I am also indebted to Ertuğrul Çubukçu for his help, understanding and friendship. I appreciate Dr. Kaan Güven for his great advice, endless help and continuous support during my research.
I would like to thank my office mates, Necmi Bıyıklı, İbrahim Kimukin, İrfan Bulu, Süheyla Sena Akarca Bıyıklı, Bayram Bütün, Hümeyra Çağlayan and Turgut Tut for creating a fruitful working environment. It is a great pleasure to work together with such nice and hardworking friends.
I am also thankful to my friends in the physics department, Muhammed Yönaç, Yavuz Öztürk, Rasim Volga Ovali, Serdar Özdemir, Levent Subaşı, Engin Durgun, Sefa Dağ, Aşkın Kocabaş, and Sinem Binicioğlu Çetiner. Your friendship is invaluable to me. And Emine “Abla”, thank you as well, for making my life easier.
There is a long list of my close friends, whether old or new, far away of nearby; to feel their existence is my life source. Thank you all.
I would like to express my endless thanks to my mother, father and sister for their love, encouragement and care. I would also thank to my new family, who doubled the support and encouragement I have.
Finally, special thanks go to my wife, Elif, for her boundless love, endless trust and for shining a different color onto my life. I cannot imagine finishing all my achievements without her endless moral support. I dedicate this labor to her.
Contents
Abstract Özet Acknowledgements Contents List of Figures 1 Introduction 2 Theoretical Background 2.1 Introduction ...……….………. 2.2 Negative Permittivity (ε < 0) ……….……….. 2.3 Negative Permeability (µ < 0) ……….……… 2.4 Negative Refraction ….………... 3 10 GHz Composite Metamaterials 3.1 Introduction ……… 3.2 Transmission and Reflection Experiments ...……….. 3.2.1 Experimental Setup ……….. 3.2.2 Structures ……..………...3.3 Transmission and Reflection Characteristics ...………... 3.3.1 Periodic “Discontinuous Thin Wire” Medium .………... 3.3.2 Periodic “Split Ring Resonator” Medium ………..……. 3.3.3 Composite Metamaterial ...…………...….………... i iii v vii x 1 6 6 9 13 19 25 25 26 26 29 30 30 33 36 vii
3.4 Summary ………. 4 True Left-Handed Metamaterial
4.1 Introduction ……… 4.2 Magnetic Resonance Gap of SRR Structure .………..
4.2.1 Band gap formation analysis for SRR Periodic Structure. 4.2.2 Effect of Misalignment and Periodicity on the Magnetic Resonance Gap ………..………... 4.3 Electric Responses ………...………...
4.3.1 Comparison of Continuous and Discontinuous Wire Structures ………..………... 4.3.2 Downward plasma frequency shift for CMM Structures due to SRR’s electric response ……….………..….…. 4.4 True Left-Handed Transmission Peak ………...………. 4.5 Summary ………. 5 Negative Refraction of 2D LHMs
5.1 Introduction ……….……… 5.2 Transmission Through 2D LHM .………….……….. 5.3 Negative Refraction in 2D LHMs .…………...………...
5.3.1 Negative Refraction Experimental Setup ……... 5.3.2 Experimental Verification of Negative Refraction ….…. 5.4 Negative Phase Velocity ……….………...………. 5.4.1 Experimental Verification of Negative Phase Velocity ... 5.4.2 Index of Refraction Calculation from Phase Shift .….…. 5.5 Summary ………. 38 40 40 41 41 45 48 48 50 52 54 55 55 56 60 60 63 66 66 68 71 viii
6 Conclusions and Future Directions List of Publications Bibliography 72 74 76 ix
List of Figures
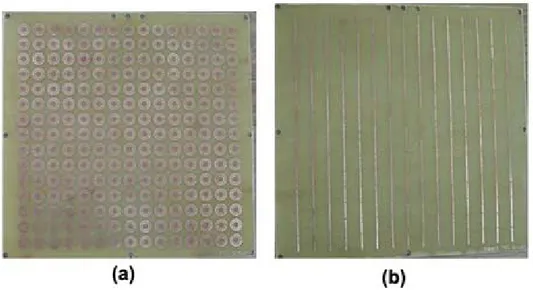
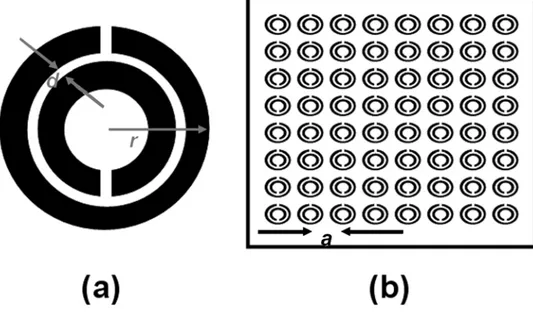
1.1 2.1 2.2 2.3 2.4 2.5 2.6 2.7 3.1 3.2 3.3 3.4 3.5Examples of Negative refractive media (a) Left-handed metamaterials, (b) 2D Photonic Crystals.
ε and µ space. 3rd region shows left-handed medium. .……… A periodic configuration of thin metallic wires with a lattice spacing of a and radius r. …………..………... Schematic drawings of (a) Single split ring resonator(SRR) (b) SRRs grouped into a periodic array ………....………..…… Resonance for effective permeability of SRRs ………... Magnetic field polarized (a) along the split ring axis, (b) perpendicular to the split ring axis ……… Schematic drawing of incident (1), reflected (2), negatively refracted (3) and positively refracted (4) beams ………….. ………. Beam path in (a) rectangular, (b) convex, (c) concave lenses made of left-handed materials ……….……….. Experimental setup for transmission measurements ..………. Horn antennas used to scan frequency regions (a) 3-7 GHz, (b) 7-14 GHz, (c) 10-22 GHz ……….………... Experimental setup for reflection measurements ……….….. Pictures of PCB boards consisting of (a) 15x15 SRR array, (b) 15x15 discontinuous wire array ………….. ………..………… Schematic drawings of (a) two wire strips separated by a gap, (b) periodical arrangement of discontinuous wire strips …….……….
3 8 11 14 16 18 20 23 27 27 28 30 31 x
3.6 3.7 3.8 3.9 3.10 3.11 4.1 4.2 4.3 4.4 4.5
Measured transmission and reflection spectra of the discontinuous thin wire medium ……….. ……… Schematics of (a) single SRR unit, (b) periodical arrangement of SRRs Measured transmission and reflection spectra of the periodic split ring resonator medium ………..……….. Measured delay time, photon lifetime, as a function of frequency. The delay time increases rapidly as we approach the band edges ……...….. Schematic drawing of periodically arranged composite metamaterial composed of alternating layers of SRRs and wires ………...……...….. Measured transmission and reflection spectra of the composite metamaterial . ………..……… Schematics of (a) a single split ring resonator (SRR) (b) a ring resonator with splits closed (CSRR) (c) Periodic CMM composed of SRRs on one side, wires on the other side of dielectric board . ………. Measured transmission spectra of a periodic SRR medium (solid line) and periodic CSRR medium (dashed line) between (a) 3-14 GHz, (b) 3-7 GHz ………... (a) Measured transmission spectra of aligned (solid line) and slightly misaligned (dashed line) SRR structures. (b) Top view of aligned SRRs. (c) Top view of slightly misaligned SRRs ………... (a) Measured transmission spectra of aligned and hardly misaligned SRR structures. (b) Top view of hardly misaligned SRRs ………. (a) Measured transmission spectra of periodic (solid line) and non-periodic (dashed line) SRR structures. (b) Front view of non-non-periodic
32 34 35 36 37 38 42 44 46 47 xi
4.6 4.7 4.8 5.1 5.2 5.3 5.4 5.5 5.6 5.7 5.8 SRRs ………... Measured transmission spectra of continuous (solid line) and discontinuous wires (dashed line) . ………. Measured transmission spectra of wires (dashed line) and closed CMM (solid line) composed by arranging closed SRRs and wires periodically Transmission spectra of SRRs (solid line), wires (dashed line) and composite metamaterial (bold solid line) . ……….. Schematic drawing of 2D CMM structure. Shaded area shows the unit cell of the structure ……….. Measured transmission spectra of a periodic SRR medium (solid line) and periodic CSRR medium (dashed line) between (a) 3-14 GHz, (b) 3-7 GHz ..………. Schematic drawing of refraction of incident beam passing from a wedge sample to air. Both positive and negative refraction cases are sketched .………..……… Schematic drawing of experimental setup used for negative refraction experiment .………..……… 2D wedge structure . ………..………. Measured intensity spectrum of wedge shaped LHM sample as a function of frequency and refraction angle ………..…………... The angular cross section of transmitted beam at 3.92 GHz ………….. Unwrapped transmission phase data obtained from different lengths of CMM between 5.4 - 7.0 GHz, where right-handed transmission peak takes place. Inset: Average phase difference between consecutive
47 49 51 53 58 59 61 62 63 64 65 xii
5.9
5.10
numbers of layers of CMM. Phase shift is positive between 5.4 - 7.0 GHz..……….... Unwrapped transmission phase data obtained from different lengths of CMM between 3.73 - 4.05 GHz, where left-handed transmission peak takes place. Inset: Average phase difference between consecutive numbers of layers of CMM. Phase shift is negative between 3.73 - 4.05 GHz ……...……….. The values of negative refractive indices obtained by using two experimental methods; the refraction experiments and the phase shift measurements. There is a quite good agreement for the values of negative refractive indices for these two experimental methods ………
67
68
70
I do not know what I may appear to the world, but to myself I seem to have been only a boy playing on the sea-shore, and diverting myself in now and then finding a smoother pebble or a prettier shell than ordinary, whilst the great ocean of truth lay all undiscovered before me.
Isaac Newton
1
Chapter 1
Introduction
Left-handed materials and negative refraction phenomena have been studied extensively in recent years due to their unique physical properties and novel applications. Negative refraction of electromagnetic waves is the most interesting physical phenomena behind the left-handed metamaterial structures. The reversal of Doppler shift and backward Cerenkov radiation are also unusual physical characteristics arising from left-handed materials.
The electric and magnetic properties of materials are determined by two important material parameters, dielectric permittivity and magnetic permeability. Together the permeability and the permittivity determine the response of the material to the electromagnetic radiation. Generally, ε and µ are both positive in ordinary materials. While ε could be negative in some materials (for instance, ε posses negative values below the plasma frequency of metals), no natural materials with negative µ are known. However, for certain structures, which are called left-handed materials (LHM), both the effective permittivity, εeff and permeability, µeff possess negative values. In such materials the index of refraction, n, is less than zero, and therefore, phase and group velocity of an electromagnetic (EM) wave can propagate in opposite directions such that the direction of propagation is reversed with respect to the
CHAPTER 1. INTRODUCTION 2
direction of energy flow [1]. This phenomenon is called the negative index of refraction and was first theoretically proposed by Veselago in 1968, who also investigated various interesting optical properties of the negative index structures [1].
Negative effective permittivity in the microwave frequency range can be achieved by using periodic thin wire media. Dielectric permittivity takes negative values and EM waves cannot propagate inside the medium below the plasma frequency [2-4]. Electric charge is responsible for a large electric response in dielectric materials. Because of the lack of magnetic charge analogous to electric charge, it is more difficult to obtain a material with negative magnetic permeability. Pendry et al. suggested that a periodic array of artificial structures called split ring resonators (SRRs) exhibit negative effective µ for frequencies close to the magnetic resonance frequency [5]. Smith et al. reported the experimental demonstration of left-handed materials by stacking SRR and thin wire structures as arrays of 1D and 2D structured composite metamaterials (CMM). [6,7].
Theoretical calculations and analyses showed that the refractive index is indeed negative, where both ε and µ are simultaneously negative [1,8]. Experimental observation of negative refraction in left-handed materials is verified by Shelby et al. [9]. Negative refraction, and in general, wave propagation in negative index media have also been a controversial subject and have generated an intense debate. Valanju et al. claimed that dispersion implies positive refraction of group velocity even when the phase velocity is refracted negatively [10]. Effects of dispersion and loss on negative refraction experiments [11], and perfect lens behavior of left-handed materials [12] are
CHAPTER 1. INTRODUCTION 3
criticized. But further experimental studies on negative refraction, addressing the issues criticized, using different techniques supported the existence of negative refraction [13,14].
On the other hand, composite metamaterials (Fig 1.1(a)) are not the only materials that give rise to the negative refraction concept. Negative refraction is also achievable by using 2D photonic crystals (PCs) (Fig 1.1(b)). Theoretical studies [15-17] and experimental observations [18-20] confirmed the existence of the negative refractive index for 2D PCs. Negative refraction using 2D PCs has a different physical origin and the argument on negative values of ε and µ is not used. The equal frequency contours of PC and air, and the conservation of the parallel wave-vector component form the basis of the negative refraction idea in 2D photonic crystals [21].
Fig 1.1: Examples of Negative refractive media (a) Left-handed metamaterials, (b) 2D Photonic Crystals.
Left-handed materials can be used in several applications. A perfect lens is a possible application. An unconventional alternative to a lens, a slab of negative refractive index material, has the power to focus all Fourier components of a
CHAPTER 1. INTRODUCTION 4
2D image, even those that do not propagate in a radiative manner [22]. Reversals of Doppler effect [23] and Cerenkov radiation[24], backward wave propagation[25], are the other interesting physical phenomena rising from the negative refractive concept. Moreover, structures with negative µ, can be used for magnetic resonance imaging [26].
This thesis will be organized as follows. In the second chapter, we will have a theoretical introduction to left-handed materials and its components. We will discuss how to achieve negative permittivity and negative permeability at the microwave frequency range. Later we will show how to obtain a negative refractive index medium, using negative permittivity and negative permeability media together. In the third chapter, the transmission characteristics of SRRs, wires and CMMs in free space will be considered. Most of the work presented in chapter 3 appeared as a journal article in IEEE Transactions on Antennas and Propagation [27].
In chapter 4, we first identify the magnetic resonance and electric resonance of SRRs by using ring resonators with the splits closed. We then verify the effect of the interaction between SRRs and wires and demonstrate experimentally the shift in plasma frequency. Finally we present a new CMM structure that exhibits true left-handed behavior and has a transmission band with a peak value at -1.2 dB. Some of the achievements represented in chapter 4 are to appear as a journal article in Optics Letters [28]. In chapter 5, we demonstrate a negative refractive index in left-handed metamaterials. Then we present direct experimental evidence that the phase velocity is negative within the left-handed pass band of a CMM. Some of the contents of chapter 5 have been submitted to Applied Physics Letters [29]. The last chapter will include a
CHAPTER 1. INTRODUCTION 5
brief summary of the results obtained during this thesis work. Future perspectives and directions will also be provided in this chapter.
Chapter 2
Theoretical Background
2.1 Introduction
The dielectric constant ε and the magnetic permeability µ are the fundamental characteristic quantities that determine the propagation of electromagnetic waves in matter. This is due to the fact that they are the only material parameters appearing in the dispersion equation
0
2 2 2=
+
−
ij i j ij ijk
k
k
c
ε
µ
δ
ω
(2.1)which gives the relation between the frequency ω of a monochromatic wave and its wave vector k. For an isotropic substance Eq. (2.1) takes a simpler form:
2 2 2 2
n
c
k
=
ω
(2.2) where n2 is given byεµ
=
2n
(2.3)From Eqs. (2.2) and (2.3), one can say that a simultaneous change of the signs of ε and µ has no effect on these relations [1]. But as we will see in the upcoming parts of this chapter, materials having simultaneously negative
CHAPTER 2. THEORETICAL BACKGROUND 7 values of ε and µ have some physical properties and unique characteristics that are different from those of ordinary materials having positive ε and µ.
To understand the effect of changes in the signs of ε and µ, we have to consider the initial Maxwell equations, where ε and µ appear separately, different from equations Eqs. (2.1), (2.2) and (2.3) where their product appears in the equations [1]. Primarily Maxwell equations
t
D
H
t
B
E
∂
∂
=
∇
∂
∂
−
=
∇
c
c
1
x
1
x
(2.4)and constitutive relations
E
D
H
B
ε
µ
=
=
(2.5)are given. For a monochromatic plane wave, all quantities are proportional to ei(kz-ωt) and therefore Eqs. (2.4) and (2.5) reduce to
E
H
k
H
E
k
ε
ω
µ
ω
c
c
−
=
=
x
x
(2.6)These are the key expressions to understand the problem of left-handed materials. If both ε and µ are positive, it is clearly seen that E, H and k form a right-handed triplet of vectors. The interesting point is that for simultaneously negative values of ε and µ, a left-handed vector triplet of E, H and k is formed. At the same time, the direction of the energy flow determined by the Poynting vector S is independent of the signs and values of ε and µ:
CHAPTER 2. THEORETICAL BACKGROUND 8
B
E
S
x
4
π
c
=
(2.7)Poynting vector is always directed away from the source of the radiation. But amazingly the k vector may be directed away from the source (for the cases where ε and µ are both positive) or towards the source (for the cases where ε and µ are both negative). This is the major difference between the case with negative ε and µ values and the case with corresponding positive values [1].
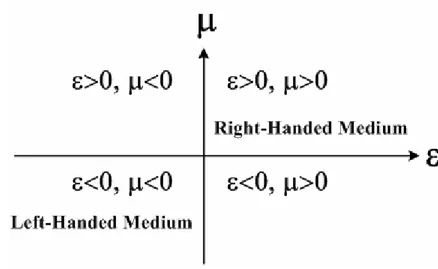
Figure 2.1: ε and µ space. 3rd region shows left-handed medium.
Figure 2.1 shows ε and µ space. Ordinary materials having ε > 0 and µ > 0 allow the propagation of EM waves, and they have positive refractive index values hence they can be called right-handed media. Since one of the permittivity or permeability values is negative and the other is positive at the second and fourth parts of ε and µ space, EM waves cannot propagate inside the medium and evanescent waves will occur. For the third part of the ε and µ space, since the product of ε and µ are positive, EM waves can propagate inside
CHAPTER 2. THEORETICAL BACKGROUND 9 the medium. This part is the left-handed media part, since both ε and µ are simultaneously negative as will be discussed later in this chapter.
2.2 Negative Permittivity (ε < 0)
Plasma is a medium with an equal concentration of positive and negative charges, of which at least one charge type is mobile. In a solid, the negative charges of the conduction electrons are balanced by an equal concentration of positive charge of the ion cores [30].
The polarization of a collection of atoms or molecules can rise in two ways: a) The applied field distorts the charge distributions and so it produces an induced dipole moment in each molecule; b) the applied field tends to line up the initially randomly oriented permanent dipole moments of the molecules. To estimate the induced moments we consider a simple model of harmonically bound charges (electrons and ions) [31]. Each charge e is bound under the action of a restoring force
x
F
2 0ω
m
−
=
(2.8)where m is the mass of the charge, and ω0 is the frequency of oscillation about equilibrium. The equation of motion for an electron of charge –e bound by a harmonic force (Eq. 2.8) and acted by an electric field E(x,t) is given by
)
,
(
]
[
2 0e
t
m
x
&&
+
γ
x
&
+
ω
x
=
−
E
x
(2.9) where γ is a damping term representing dissipation of the plasmon’s energy into the system. An approximation can be made taking into account that the amplitude of the oscillation is small enough to permit the evaluation of the
CHAPTER 2. THEORETICAL BACKGROUND 10 electric field at the average position of the electron. If the field varies harmonically in time with the frequency ω as e-iωt, the dipole moment contributed by one electron is
E
x
p
2 2 1 0 2)
(
−
−
−=
−
=
ω
ω
i
ωγ
m
e
e
(2.10)If we suppose that there are N molecules per unit volume with Z electrons per molecule, and that, instead of a single binding frequency for all, there are fj electrons per molecule with a binding frequency ωj and damping constant γj, then the dielectric constant is given by [31]
1 2 2 0 2 0
)
(
1
)
(
=
+
−
−
−∑
j j j ji
f
m
Ne
ω
ω
ωγ
ε
ε
ω
ε
(2.11)At frequencies far above the highest resonant frequency the dielectric constant takes on the simplest form
)
(
1
)
(
2γ
ω
ω
ω
ω
ε
i
p+
−
=
(2.12)which is approximately independent of the wave vector, k. The significant point about Eq. (2.12) is that, ε(ω) is essentially negative below the plasma frequency (ωp), at least down to frequencies comparable to γ. A longitudinal mode, the plasmon, appears at a fixed frequency, and two longitudinal modes emerge at the plasma frequency. In consequence of the negative ε, only evanescent modes (imaginary wave vector) exist below the plasma frequency and below this threshold no radiation penetrates very far into the metal [2].
CHAPTER 2. THEORETICAL BACKGROUND 11 The frequency ωp, which depends only on the total number of n = NZ of electrons per unit volume is given by the formula
eff p
m
ne
0 2 2ε
ω
=
(2.13)In simple metals γ is small relative to ωp. For instance ωp = 15 eV whereas
γ = 0.1 eV for aluminum [2].
The electromagnetic response is dominated by negative permittivity concept in the visible and UV frequency regions. However, at lower frequencies starting from the near infrared and downwards, dissipation asserts itself, therefore dielectric function becomes imaginary. To achieve negative permittivity values at microwave range, the thin metallic wire concept is proposed [2,3]. Also loop-wire medium is investigated for the same purposes [4].
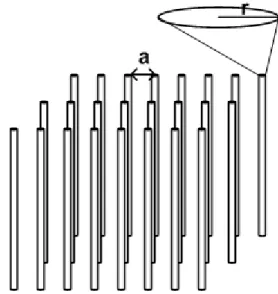
Figure 2.2: A periodic configuration of thin metallic wires with a lattice spacing of a and radius r.
CHAPTER 2. THEORETICAL BACKGROUND 12 By assembling thin metallic wire structures into a periodic medium (Fig 2.2) with appropriate parameters, negative permittivity can easily be achieved at microwave frequencies. Plasma frequency of the thin metallic wires is given after detailed calculations as [2]
)
/
ln(
2
2 2 0 0 2 2r
a
a
c
m
ne
eff pπ
ε
ω
=
=
(2.14)where c0 is the speed of light in free space, a is the lattice parameter and r is the radius of the wires.
Note that although the newly reduced plasma frequency can be expressed in terms of electron effective mass and charge, these microscopic quantities cancel, leaving a formula containing only macroscopic parameters of the system: radius of the wires, and periodicity of the wire medium.
The metallic wires were structured on a scale much less than the wavelength of radiation. When the wavelength of the incident radiation is much larger than the size and spacing of a collection of scatterers, the response of the scatterers to the incident fields can be treated by way of the effective medium theory.
1 0
2
−=
<<
λ
π
c
ω
a
(2.15)In the thin wire case, the effective medium theory holds since corresponding λ for ωp is much larger than the radius of the wires. Therefore, an effective dielectric permittivity, εeff can be used to define the permittivity of the medium. As far as external electromagnetic radiation is concerned, a thin wire structure appears as an effectively homogeneous dielectric medium whose internal structure is only apparent as it dictates εeff. In this respect it is important that the
CHAPTER 2. THEORETICAL BACKGROUND 13 structure be made of thin wires. Eq. (2.14) shows that the function of the small radius is to suppress the plasma frequency. For a thick wire structure in Eq. (2.14), ln(a/r)≈1 so that the plasma frequency corresponds to a free space wavelength of approximately twice the lattice spacing. Therefore, Bragg diffraction effects would interfere with our simple plasmon picture. Choosing a small radius ensures that diffraction occurs only at much higher frequencies.
2.2 Negative Permeability (µ < 0)
Electric charge is responsible for large electric response in dielectric materials. Because of the lack of magnetic charge analogous to an electric charge, it is more difficult to obtain a material with negative magnetic permeability. Naturally occurring materials almost universally have a positive permeability, and thus a left-handed material, while not ruled out by fundamental considerations, seemed unlikely to be practical. However, in 1999, Pendry et al. [5] introduced several configurations of conducting scattering elements displaying a magnetic response to an applied electromagnetic field when grouped into an interacting periodic array.
Usually the magnetic permeability equals to unity (µ = 1) for ordinary materials. Thin metallic wire media discussed in the previous section of this chapter responds to the electric field and dielectric permittivity becomes negative below the plasma frequency of the wires. But these metallic wire structures do not give any response to the magnetic field. So in order to obtain negative permeability, one has to extend the magnetic properties of the materials. Pendry et al. [5], enhanced the magnetic response of artificially designed materials by introducing capacitative elements into the structure.
CHAPTER 2. THEORETICAL BACKGROUND 14
Figure 2.3: Schematic drawings of (a) Single split ring resonator (SRR) (b) SRRs grouped into a periodic array.
Figure 2.3(a) shows the design of Pendry, described as a split ring resonator (SRR) [5]. In a split ring resonator there are two rings both having a split. By having splits in the rings, the SRR unit can be made resonant at wavelengths much larger than the diameter of the rings. The purpose of the second split ring, inside and whose split is oriented oppositely to the outside split, is to generate a large capacitance in the small gap region. The gap between the rings prevents current from flowing around any one ring. However, there is a considerable capacitance between the two rings, which enables current to flow. By combining the SRRs into a periodic medium, (Fig. 2.3(b)) such that there is strong magnetic coupling between the resonators, unique properties emerge from the composite and isotropy can be achieved.
CHAPTER 2. THEORETICAL BACKGROUND 15 Structures having effective permeability and permittivity comply with the following equation ave 0 eff ave ave 0 eff ave
E
D
H
B
ε
ε
µ
µ
=
=
(2.16)where we assume that the structure is on a scale much shorter than the wavelength of any radiation, in order to enable the ability for us to talk about an average value for all of the fields.
Detailed calculations [5] give effective permeability of the SRR to be
3 2 0 2 0 eff
2
3
1
1
Cr
r
i
F
ω
µ
π
µ
ω
σ
µ
−
+
−
=
(2.17)where F is the fractional volume of the cell, and r is the radius of the outer ring
2 2
a
r
F
=
π
(2.18)C is the capacitance per unit area, and a is the lattice constant,
0 2 0 0
1
µ
ε
dc
d
C
=
=
(2.19)where d is the distance between the split rings. Hence
3 2 2 2 0 0 2 2 eff
3
2
1
1
r
dc
r
i
a
r
ω
π
µ
ω
σ
π
µ
−
+
−
=
(2.20)
CHAPTER 2. THEORETICAL BACKGROUND 16 Since a capacitance is introduced into the system, effective permeability of the SRR becomes resonant. Figure 2.4 illustrates the generic form of µeff for SRRs.
Figure 2.4: Resonance for effective permeability of SRRs [5].
ω0 is defined to be the frequency at which µeff diverges as follows:
2 3 2 0 3 0 2 0
3
3
r
dc
Cr
π
µ
π
ω
=
=
(2.21)and ωmp to be the magnetic plasma frequency
)
1
(
3
)
1
(
3
2 2 3 2 2 0 3 0 2a
r
r
dc
F
Cr
mpπ
π
µ
π
ω
−
=
−
=
(2.22)Pendry et al. carried through this analysis, finding a generic function for the effective permeability
CHAPTER 2. THEORETICAL BACKGROUND 17
ω
ω
ω
ω
µ
Γ
+
−
−
=
i
F
2 0 2 2 eff1
(2.20)Eq. (2.20) indicates that propagating modes occur up until the frequency ω0, followed by a gap where no propagating modes exist, followed by propagating modes starting from the frequencyω0 / 1−F . The reason for the gap in propagation is of particular significance, since effective permeability will become negative for this frequency region. Turning back to Fig. 2.4, the real part of the permeability increases from unity at ω = 0 to a large positive values near ω = ω0, where it then abruptly passes to a large negative value, crossing µ = 0 at ω = ωmp. The peak value of the permeability, infinite in the case of no loss, is constrained by the magnitude of the material loss in the SRR [32]. The width of the negative permeability region is determined by the filling factor F (Eq. 2.18). At high frequencies Eq. (2.20) implies that the permeability tends toward 1-F, however, it is understood that the material will stop responding at a very high frequency, and the permeability will actually reach unity.
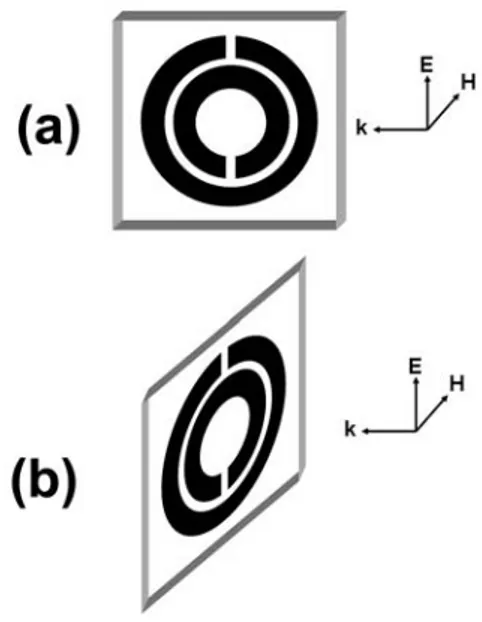
The polarization of the electromagnetic field with respect to the SRR structure is a key issue to achieve negative values of µeff. There are two incident polarizations of interest: magnetic field along the split ring axes, case (Fig. 2.5.(a)) and perpendicular to the split ring axes, case (Fig 2.5.(b)). In both cases, the electric field is in the plane of the rings. Measurements and analyses showed that there are stop bands for both polarization cases where EM waves cannot propagate inside the medium [6]. A photonic band gap of the SRR medium does not necessarily imply that µ
||
H
⊥
H
eff is negative. Therefore one has to check whether the gap is due to negative µeff or negative εeff of the structures.
CHAPTER 2. THEORETICAL BACKGROUND 18
Figure 2.5: Magnetic field polarized (a) along the split ring axis, case, (b) perpendicular to the split ring axis, case.
||
H
⊥
H
Smith et al. investigated the reason of the gap by altering the dielectric function of the medium and creating scattering properties that can distinguish whether the band gaps are due to either the µeff or εeff of SRR being negative [6,33]. It is shown that for H||case, SRRs respond to magnetic field and µeff becomes negative over a certain frequency range. But for the case, magnetic effects are small, and µ
⊥
H
eff varies slowly and thus have a small and positive µeff value [6]. Since the SRR structures in Fig. 2.5 are designed to be 1-Dimensional elements, we have anisotropic material. To obtain negative permeability for each polarization, one should use higher dimension SRR structures, to lift off the anisotropy of the 1D SRR structures. In chapter 4, we will show an alternative and easier way to determine the formation of band gaps of the SRRs.
CHAPTER 2. THEORETICAL BACKGROUND 19
2.4 Negative Refraction
Maxwell equations determine how electromagnetic waves propagate within a medium and can be solved to arrive at a wave equation of the form
2 2 2 2
(
,
)
(
,
)
t
t
x
E
x
t
x
E
∂
∂
=
∂
∂
εµ
(2.21)In Eq. 2.21 ε and µ enter as a product, so it is not a problem whether both their signs are positive or negative. Indeed solutions have the form of exp[i(nkd−ωt)] , where n= εµ is the refractive index. Propagating solutions exist in the material for two distinct cases: i) ε > 0 and µ > 0, ii) ε < 0 and µ < 0. So, what is the difference between positive and negative refractive indices, and why do we choose n to be negative?
Let us consider the refraction phenomena occurring when an incident beam transits from one medium into another. Suppose that the initial has a positive refractive index, therefore ε1 > 0 and µ1 > 0. If ε2 > 0 and µ2 > 0, we shall have an ordinary refraction case. But for the case where ε2 < 0 and µ2 < 0, we have a beam transition from an ordinary medium into a medium with negative ε and µ. However, in every case the boundary conditions should be reached. Remember that boundary conditions require tangential components of E and H, and normal components of D and B to be continuous at the interface.
,
E
t1=
E
t2H
t1=
H
t2 (2.22),
1 2 2 1 2 1 2 1
E
nε
E
nµ
H
nµ
H
nε
=
=
(2.23)
CHAPTER 2. THEORETICAL BACKGROUND 20 It is evident from Eqs. (2.22) and (2.23) that x and y components of the field are not changed at transition from medium 1 to 2, regardless of the signs of ε and µ. As for the normal z components of the field, they preserve their directions if ε and µ preserve their signs in both media; they change their directions if two media have different signs of ε and µ [1].
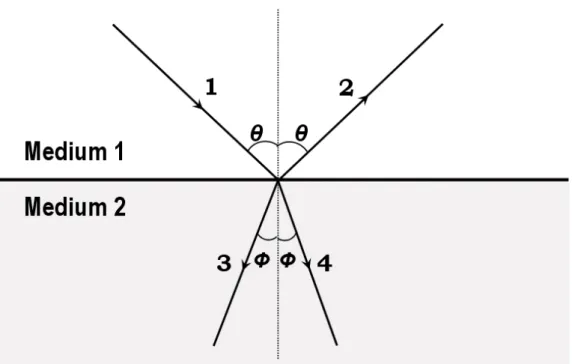
Figure 2.6: Schematic drawing of incident (1), reflected (2), negatively refracted (3) and positively refracted (4) beams.
If we consider relations (Eq. 2.6) with due reference to Eq. (2.22) and (2.23), it is immediately understood that a beam transition from a medium with positive ε and µ into a medium ε < 0 and µ < 0, the sign of z component of k (kz) is reversed. The sign reversal of kz vector corresponds to a mirror reflection of a triad, E, H and k in the boundary plane of two media. This means that if a
CHAPTER 2. THEORETICAL BACKGROUND 21 beam goes from an ordinary medium into one with negative ε and µ, it is symmetrical compared to the case with positive ε and µ. In other words an incident beam is refracted at the other side of the normal, which is different than the case in an ordinary refraction. Figure 2.6 sketches the path of the beams when beam 1 is transiting from medium 1 to 2. There are four beam paths as seen in the figure: 1-incident beam, 2-reflected beam, 3-refracted beam when n2 < 0, 4- refracted beam when n2 > 0. If the beam is assumed to be incident to medium 1 at angle θ, the refraction angle Φ will be negative when ε2 and µ2 are both negative. Refractive index, n, determined by using Snell’s law
sin
sin
n
1θ
=
n
2Φ
(2.24)is also negative.
One needs to be careful when taking the square root of Eq. 2.3, because ε and µ are analytic functions whose values are generally complex. The ambiguity in the sign of the square root can be resolved with a proper analysis of the problem. Consider that we have a material having ε = µ = -1. ε and µ can be written in another form as ε =exp(iπ) and µ =exp(iπ) , then
1 ) exp( ) 2 / exp( ) 2 / exp( = =− = = εµ iπ iπ iπ
n . The important step is that the
square root of either ε or µ alone must have a positive imaginary part, which is a necessity for passive material [34].
The n < 0 solution consists of plane waves propagating toward the source, rather than plane waves propagating away from the source. Since such a solution would normally be rejected on the grounds of causality, a general
CHAPTER 2. THEORETICAL BACKGROUND 22 method is employed by Smith et al [8]. The work done by the source on the fields is given[8] as
)
,
(
2
1
2 0 *j
cn
dx
x
E
j
W
P
Vµ
π
=
Ω
−
=
Ω
=
∫
(2.25)We require that the average work (W) done by source on the fields is positive. In a right-handed medium, both µ and n are positive, therefore n > 0 solution is selected. On the other hand, in a left-handed medium since µ < 0, we conclude that the solution with n < 0 leads to the correct interpretation that the current performs positive work on the fields [8]. Since the work done by the source on the fields is positive, energy propagates outward from the source, in agreement with Veselago’s proposals [1].
Negative refractive materials are necessarily frequency dispersive, so that the various frequency components of a modulated beam are refracted at different angles within the medium. Through an analysis of the points of the constant phase of a modulated plane wave, it is shown that both the group and phase velocities undergo negative refraction at the interface between a positive and a negative index material [35]. The interference fronts of the modulated wave are not normal to the group velocity, and exhibit a sideways motion as they move at the group velocity. Consideration of a modulated beam of finite extent clearly resolves the difference between the group velocity and normal to the interference fronts.
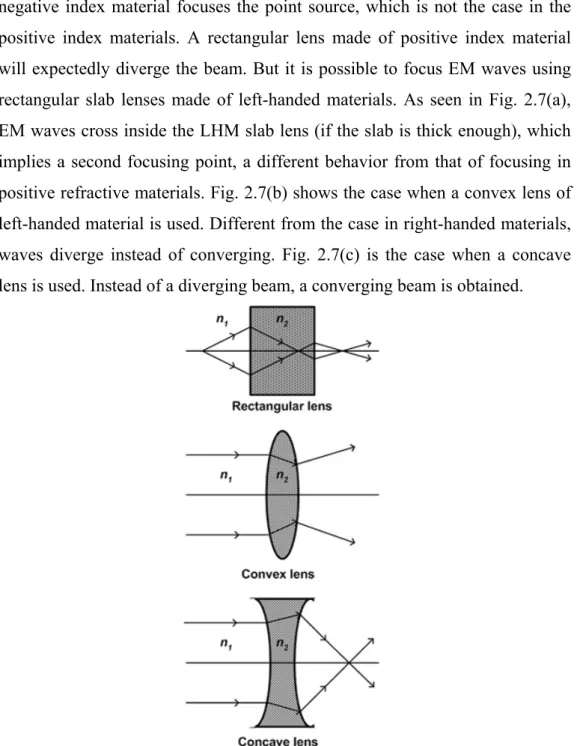
Existence of a negative refractive index implies an entirely new form of geometrical optics. A striking example is shown in Fig. 2.7(a), where a slab of
CHAPTER 2. THEORETICAL BACKGROUND 23 negative index material focuses the point source, which is not the case in the positive index materials. A rectangular lens made of positive index material will expectedly diverge the beam. But it is possible to focus EM waves using rectangular slab lenses made of left-handed materials. As seen in Fig. 2.7(a), EM waves cross inside the LHM slab lens (if the slab is thick enough), which implies a second focusing point, a different behavior from that of focusing in positive refractive materials. Fig. 2.7(b) shows the case when a convex lens of left-handed material is used. Different from the case in right-handed materials, waves diverge instead of converging. Fig. 2.7(c) is the case when a concave lens is used. Instead of a diverging beam, a converging beam is obtained.
Fig 2.7: Beam path in (a) rectangular, (b) convex, (c) concave lenses made of left-handed materials.
CHAPTER 2. THEORETICAL BACKGROUND 24 If the permittivity and permeability and therefore refractive index is equal to -1, and the point source is close enough to the slab of a left-handed medium, impedance will be matched and therefore no reflection will occur. A slab can be designed to focus not only propagating waves, but also evanescent waves using left-handed materials. Such lenses are called “perfect lenses” [22]. Light can be brought to perfect focusing without the usual constraints imposed by the wavelength. Negative refractive index materials restore not only the phase of propagating waves, but also the amplitude of evanescent states.
25
Chapter 3
10 GHz Composite Metamaterials
3.1 Introduction
Left-handed materials were first proposed by Veselago at 1968 [1]. At year 2000 experimental evidence came by way of Smith et al [6]. Since the original microwave experiment by Smith et al., several CMMs were fabricated that exhibited a pass band in which it was thought that both ε and µ were negative [7,36-44]. This assumption was based on transmission measurements of the wires alone, the SRRs alone and the CMM. The occurrence of a CMM transmission peak within the stop bands of the SRRs-only and wires-only structures was taken as evidence for left-handed behavior. Besides the experiments, there is also a large amount of numerical work in which transmission and reflection data, losses and absorptions and effective parameters of the composite metamaterials have been investigated [45-59].
In this chapter we investigate the transmission and reflection characteristics of CMMs in the microwave frequency range. Most of the previous experimental measurements were performed in a wave guide chamber, but our
CHAPTER 3. 10 GHz COMPOSITE METAMATERIALS 26
measurements take place in free space. First we will have a look at the transmission and reflection characteristics of periodic wire medium alone. Then we will investigate the characteristics of periodic SRR structures. Later we will assemble SRR and wire media together in a periodic array to investigate the transmission and reflection characteristics of the CMM.
3.2 Transmission and Reflection Experiments
3.2.1 Experimental Setup
The transmission, reflection, and phase measurements of composite metamaterial structures are performed in free space by using a HP 8510C network analyzer. HP 8510 C network analyzer is capable of measuring both amplitude and phase. Experimental setup for transmission measurements is given in Fig. 3.1. A microwave horn antenna connected to a network analyzer transmits continuous electromagnetic waves at specific microwave frequency range depending on the waveguide size of the antenna. The other horn antenna measures the transmission, phase, group delay and photon lifetime parameters. In our experiments, normalization of the transmission is done as follows. First we measured the transmission spectra in the free space (i.e. without periodic structures). This data was used as the calibration data for the network analyzer. Then, we inserted the periodic structures between the horn antennas, and we performed the transmission measurements by maintaining distance between the transmitter and receiver horn antennas fixed. The distance between the horn antennas is kept at 40 cm for all measurements to get rid of near field effects.
CHAPTER 3. 10 GHz COMPOSITE METAMATERIALS 27
Fig 3.1: Experimental setup for transmission measurements.
Fig 3.2: Horn antennas used to scan frequency regions (a) 3-7 GHz, (b) 7-14 GHz, (c) 10-22 GHz.
CHAPTER 3. 10 GHz COMPOSITE METAMATERIALS 28
We scanned the frequency region 4-22 GHz, and for this purpose, we used a set of microwave horn antennas having various sizes. The antennas in Fig. 3.2(a) scans 4-7 GHz, Fig. 3.2(b) scans 7-14 GHz, and Fig 3.2(c) scans 10-22 GHz.
Fig 3.3: Experimental setup for reflection measurements
For reflection measurements, we used a different setup as shown in Fig 3.3. In this case two horn antennas are placed close to each other. The angle between the antennas is kept very small. The transmitter horn antenna sends the EM wave to the surface and the receiver antenna measures the amplitude of the reflected EM waves. Normalization of the reflection is also different from that of the transmission. Instead of measuring the spectra in free space, we placed a thick slab of metal (metals reflect all of the incident EM waves) at a proper distance away from the antennas. This data was used as the calibration
CHAPTER 3. 10 GHz COMPOSITE METAMATERIALS 29
data for the network analyzer. Then we inserted the periodic structures by paying attention to the fact that the reflection surface of the structure is the same with the reflection surface of the thick metal used for calibration data. Microwave transmission measurements are performed in free space, which does not impose any restriction on the size of the structures. For all measurements, EM waves propagate along the x direction. The electric field polarization is along the y direction and magnetic field polarization is along the z direction. The directions are shown in Fig. 3.1.
3.2.2 Structures
In our experiments we used planar geometry of SRRs and wires. SRRs and wires are deposited on commercialy available printed circuit boards (PCB). PCB boards consisting of SRR arrays (Fig. 3.4(a)) and wire arrays (Fig. 3.4(b)) are ordered to a PCB firm. In all of the experiments performed in the content of this thesis work, we used the same kind of PCB boards. The dielectric constant and thickness of this dielectric boards are measured to be εb=4.4 and 1.6 mm, respectively. The deposited metal is copper and has a thickness of 30 µm. Losses are one of the largest problems for left-handed materials. To address the loss and absorption issue of empty PCB boards we measured the transmission spectrum of these boards. We put 20 layers of boards together, which correspond to a length of 3.2 cm in the propagation direction. Average transmission is measured to be around - 2.5 dB at the frequency range that we were interested in, which corresponds to ~ 60% transmission of EM waves. The PCB boards has n = 2.15, by using the formula
CHAPTER 3. 10 GHz COMPOSITE METAMATERIALS 30
R = (n-1)2
/ (n+1)2, reflection is calculated to be around ~ 15%. Therefore, ~ 25% of EM wave is absorbed by the bulk PCB boards.
Fig. 3.4: Pictures of PCB boards consisting of (a) 15x15 SRR array, (b) 15x15 discontinuous wire array.
3.3 Transmission and Reflection Characteristics
3.3.1 Periodic “Discontinuous Thin Wire” Medium
A negative permittivity medium in the microwave frequency range can be achieved by arranging thin metallic wires periodically [2-4]. The continuous wire structure behaves like a high-pass filter, which means that the effective permittivity will take negative values below the plasma frequency [60].
CHAPTER 3. 10 GHz COMPOSITE METAMATERIALS 31
However, for discontinuous wire structures, the negative permittivity range does not extend to zero frequency, and a stopband appears around the resonance frequency. In the microwave experiments performed by Smith et al., [6,7] although the wires are continuous, because of the finite length of the wires (1 cm), there is a lower edge for the negative permittivity region. For this purpose, we used discontinuous wires instead of continuous wires.
Fig. 3.5: Schematic drawings of (a) two wire strips separated by a gap, (b) periodical arrangement of discontinuous wire strips.
The thin wire crystal is constructed by depositing discontinuous wire strips, of length L = 8.65 mm, on the circuit board (Fig. 3.5(a)). The thickness of the stripes is r = 0.9 mm and the gap between the two stripes is w = 0.35 mm. The thickness of the wires is 30 µm. As shown in Fig. 3.5(b), the thin wire stripes with parameters Nx = 15, Ny = 15, and Nz = 20 units cells are stacked along
CHAPTER 3. 10 GHz COMPOSITE METAMATERIALS 32
each direction. The periodicity along x, y, and z axes are ax = 8.8 mm, ay = 8.8 mm, and az = 6.5 mm, respectively.
The measured transmission and reflection characteristics of the thin wire structures are displayed in Fig. 3.6. In contrary to the continuous wire structures [60] that exhibit a stopband with no lower edge, the present configuration exhibits a stopband with a well-defined lower edge due to the discontinuous nature of the wires.
Fig. 3.6: Measured transmission and reflection spectra of the discontinuous thin wire medium.
The stopband of the discontinuous thin wire structure extends from 6 to 18 GHz. The transmission of the structure for the lower passband is higher than unity. This high transmission can be explained by the lensing effect and the spatial dispersive properties of our structure along with the experimental error due to the overall size of the crystal (which is around a few wavelengths at
CHAPTER 3. 10 GHz COMPOSITE METAMATERIALS 33
these low frequencies). The transmission of the structure for the higher passband is measured to be less than - 10 dB. The reflection measurement indicates that all of the incident EM waves are reflected back from the structures within the stopband. So, the structure behaves like a good mirror throughout the stopband. For the passband region starting from 18 GHz, the measured reflection is near -15 dB. As the transmitted power is also low at these frequencies, we can conclude that the EM waves can not efficiently couple into propagating modes and strongly scatter within the structure.
At the frequency region 6-18 GHz, where no EM waves propagate inside the medium, periodic discontinuous wire structure has a negative effective dielectric permittivity, εeff. Effective magnetic permeability of the medium is equal to unity, since the structure do not contain any magnetic resonant elements that will respond to applied magnetic field.
3.3.2 Periodic “Split Ring Resonator” Medium
The negative permeability medium can be achieved by using an artificial material which is called split ring resonator (SRR) [5]. We constructed a periodical arrangement of copper SRRs on a circuit board to investigate the transmission and reflection characteristics of these exciting structures. A single copper SRR unit with parameters r1 = 2.5 mm, r2 = 3.6 mm, d = w = 0.2 mm and t = 0.9 is shown in Fig. 3.7(a). It consists of two rings separated by a gap, which is similar to the SRR structures in [6]. Fig. 3.7(b) displays the stacked periodic SRR medium with number of unit cells in x, y and z directions Nx = 15, Ny = 15, and Nz = 20. The periodicity along x, y, and z axes are ax = 8.8
CHAPTER 3. 10 GHz COMPOSITE METAMATERIALS 34
mm, ay = 8.8 mm, and az = 6.5 mm, respectively. Since we will later use SRR and wire media together to obtain a composite metamaterial, we choose the number of unit cells and periodicity of SRRs to be the same with the wire structures.
Fig. 3.7: Schematics of (a) single SRR unit, (b) periodical arrangement of SRRs
The measured transmission and reflection characteristics of the SRR medium are displayed in Fig. 3.8. The data shows that the structure has four significant pass bands, along with four stopbands throughout the spectrum. For the first passband, the transmission is measured to be higher than unity. As we have a passive structure with no gain, this high transmission effect can be explained by the lensing effect and crystal size restrictions as described in the previous section.
CHAPTER 3. 10 GHz COMPOSITE METAMATERIALS 35
Fig. 3.8: Measured transmission and reflection spectra of the periodic split ring resonator medium.
The magnitude of transmission of the passbands decreases for the higher order passbands. While the second passband has a peak transmission of -5 dB, this reduces to -10 dB for the fourth passband. The measured reflections at the first and second stopbands are measured to be near unity. So, we can safely claim that these structures perfectly reflect the EM waves for the lower stopbands. However, the measured reflection for the higher stopbands is around -5 dB which is well below unity. This suggests that the EM waves are partially scattered within the structure at the higher stopbands.
The measured photon lifetime for the first passband, which is derived from phase measurements, is plotted in the Fig. 3.9. Photon lifetime corresponds to the propagation time of the EM waves inside the metamaterial [62]. Photon lifetime measurements will be a critical parameter in the following discussion,
CHAPTER 3. 10 GHz COMPOSITE METAMATERIALS 36
since the group velocity is inversely proportional to the photon lifetime. As shown in the figure, the delay time significantly increases near the band edges.
Fig. 3.9: Measured delay time, photon lifetime, as a function of frequency. The delay time increases rapidly as we approach the band edges.
The photon lifetime near the lower edge of the first passband is ~ 80 ns, which is 160 × larger than the time required for the EM waves to propagate along the structure. So, the SRR structure reduces the speed of light at this frequency by a factor of 160. For the upper edge, the lifetime is ~ 40 ns, which corresponds to an 80 × reduction for the speed of light.
3.3.3 Composite Metamaterial
The composite metamaterial structure is constructed by stacking the SRR and wire mediums periodically as shown in Fig. 3.10. The periodicity along the z direction is 6.5 mm, the same as in SRR and wire media.
CHAPTER 3. 10 GHz COMPOSITE METAMATERIALS 37
Fig 3.10: Schematic drawing of periodically arranged composite metamaterial composed of alternating layers of SRRs and wires.
The measured transmission and reflection properties of the composite metamaterial are displayed in Fig. 3.11. A broad passband extending from 9.6 to 14.3 GHz can be clearly seen there. The average transmission within the passband is around - 4.5 dB, corresponding to a transmission of -0.3 dB for each unit cell. As can be seen from Figs. 3.6 and 3.8, there is a frequency range (10 - 12.5 GHz) where a band gap is observed for both SRRs and wires. Since a transmission band covering this frequency range is observed for composite metamaterial, this can be taken as a possible left-handed property. But as we will discuss in the following chapter, this is not the case and this transmission band is indeed right-handed.
CHAPTER 3. 10 GHz COMPOSITE METAMATERIALS 38
Fig 3.11: Measured transmission and reflection spectra of the composite metamaterial.
The reflection of the composite metamaterial structure within this frequency range is quite low. This shows that most of the EM waves penetrate into the composite medium, and we have a certain amount of scattering loss at these frequencies. The reflection of the structure is around unity for the first stopband region, which suggests that the composite structure acts as an almost perfect mirror for these frequencies.
3.4 Summary
In summary, we investigated the transmission and reflection properties of the composite metamaterials at microwave frequencies in free space. A transmission amplitude of -0.3 dB per unit cell is achieved throughout a
CHAPTER 3. 10 GHz COMPOSITE METAMATERIALS 39
frequency range where a band gap is observed for both SRRs and wires. Moreover, we observed that the delay time increases very rapidly near the SRRs band edges.
40
Chapter 4
True Left-Handed Metamaterial
4.1 Introduction
In the previous chapter we investigated the transmission and reflection characteristics of SRR, discontinuous wire and composite metamaterial composed of SRR and wire structures. It is a well-known fact that the band gap observed for the wire medium is due to effective negative permittivity of the periodic structure. But it is not possible to say that the gaps observed (Fig. 3.8) for SRR structures are due to negative permeability. Since the SRR has a single magnetic resonance frequency, only one of the gaps could be due to negative permeability.
This chapter is organised as follows. First we identify the magnetic resonance and electric resonance of SRRs by using ring resonators with the splits closed. Then we verify the effect of interaction between SRRs and wires and experimentally demonstrate the shift in plasma frequency. We will investigate the effect of misalignment and periodicity to SRR’s magnetic resonance gap. We will also provide a brief discussion about the difference of
CHAPTER 4. TRUE LEFT-HANDED METAMATERIAL 41
transmission characteristics for continuous and discontinuous wire structures. Finally we will present a new CMM structure which exhibits true left-handed behavior and has a transmission band with a peak value of -1.2 dB, which is the highest transmission peak reported for a left-handed material.
4.2 Magnetic Resonance Gap of SRR Structure
4.2.1
Band gap formation analysis for SRR periodic structure
The split ring resonator has a large magnetic response against electromagnetic waves over certain frequencies. The magnetic resonance of SRR structure does not allow EM waves to propagate through a periodic medium composed of SRRs, hence a stop band occurs. SRR structures have also electric resonances [44,59] at certain frequencies where EM waves cannot propagate inside the medium due to negative effective permittivity. Hence, a bandgap in the transmission spectrum of periodic SRR medium may be due to the negative permittivity or the negative permeability or to the periodicity. The ambiguity can be removed by using a structure in which the splits in the ring resonators are closed (closed SRR). Closing the splits of ring resonator, will destroy the magnetic resonance but still keep the electric resonance. Therefore we expect to have a transmission band instead of a bandgap at frequencies of interest for negative magnetic permeability.
In the previous chapter we investigated the characteristics of the SRR structure shown in Fig. 3.7(a), where the splits in the rings are oriented at the left side of the outer ring, and the right side of the inner ring. Since the applied
CHAPTER 4. TRUE LEFT-HANDED METAMATERIAL 42
electric field is at the y direction (Fig 3.7(a)), the discontinuities along the E field cause several band gaps at the transmission spectrum of periodic SRR medium (Fig. 3.8). So the SRR structures behave like a discontinuous wire and give a response to the applied electric field. That’s the reason why we observed 4 band gaps between 4-22 GHz, in the previous chapter.
Fig. 4.1: Schematics of (a) a single split ring resonator (SRR) (b) a ring resonator with splits closed (CSRR) (c) Periodic CMM composed of SRRs on one side, wires on the other side of dielectric board.
CHAPTER 4. TRUE LEFT-HANDED METAMATERIAL 43
Because of the discontinuity problem that was mentioned above, we switched to SRR structure shown in Fig. 4.1(a). In this case the splits in the rings are oriented at the top side of the outer ring, and the bottom side of the inner ring.
The parameters of the SRR are d = t = 0.2 mm, w = 0.9 mm and r = 1.6 mm. SRRs are arranged periodically with 5, 15, and 18 number of unit cells in the x, y and z directions respectively. Each unit cell contains a single SRR and the dimensions of the unit cell are ax = ay = 8.8 mm, and az = 6.5 mm. The experimental procedure is explained in the previous chapter (section 3.2.1).
Figure 4.2(a) shows the measured transmission spectra of periodic SRRs (solid line) and CSRRs (dashed line) between 3-14 GHz. The SRR medium displays two stop bands throughout the interested frequency range. The first band gap (3.55-4.05 GHz) of the SRR medium disappears for the CSRR medium (Fig 4.2(b)). We know that the reason for the magnetic resonance of SRRs is the splits in the rings. Hence, closing the splits will destroy the magnetic resonance of the SRR structure. This implies that this gap corresponds to the magnetic resonance gap of the SRR structure. Between 3.55-4.05 GHz electromagnetic waves cannot propagate inside the periodic SRR medium because effective magnetic permeability becomes negative. On the other hand, the second band gap (8.1-11.9 GHz) of the SRR medium essentially coincides with the stop band of the CSRR medium. Therefore the physical origin of this stop band can be attributed to the electric resonance of the periodic medium.
![Figure 2.4: Resonance for effective permeability of SRRs [5].](https://thumb-eu.123doks.com/thumbv2/9libnet/5900620.122111/32.892.304.656.353.672/figure-resonance-effective-permeability-srrs.webp)