Full Terms & Conditions of access and use can be found at
http://www.tandfonline.com/action/journalInformation?journalCode=mree20
Emerging Markets Finance and Trade
ISSN: 1540-496X (Print) 1558-0938 (Online) Journal homepage: http://www.tandfonline.com/loi/mree20
Privatization in Emerging Markets : The Case of
Turkey
CAN SIMGA-MUGAN & AYSE YÜCE
To cite this article: CAN SIMGA-MUGAN & AYSE YÜCE (2003) Privatization in Emerging Markets : The Case of Turkey, Emerging Markets Finance and Trade, 39:5, 83-110
To link to this article: https://doi.org/10.1080/1540496X.2003.11052550
Published online: 07 Dec 2014.
Submit your article to this journal
Article views: 45
83 Emerging Markets Finance and Trade, vol. 39, no. 5,
September–October 2003, pp. 83–110. © 2003 M.E. Sharpe, Inc. All rights reserved. ISSN 1540–496X/2003 $9.50 + 0.00.
CAN SIMGA-MUGAN AND AYS*E YÜCE
Privatization in Emerging Markets
The Case of Turkey
Abstract: This paper discusses the progress and success of the privatization programs in Turkey between 1985 and 1998. The paper discusses the legal developments, privatization methods, and performance of privatized companies and overall success of privatization by comparing the results of privatization with the aims and objectives stated initially. Within this framework, the paper presents the productivity increases or decreases in various priva-tized state enterprises, discusses the impact on stock market development, and the privatization revenues and cash results. Only 8.3 percent of the large state-owned enter-prises have been privatized during this period. Net cash flow generated from the privatization process does not appear to be satisfactory, and the impact on the stock market and the economy is not very impressive. Turkey still needs to privatize its largest state-owned enter-prises in order to realize the full effects of the privatization program.
Key words: developing country, privatization, Turkey.
The last quarter of the twentieth century witnessed the ease in the flow of capital across national borders in the process of globalization. Investors around the world included assets of foreign countries in their portfolios in an effort to further reduce risk and diversify effectively. Since the claims of international creditors during times of recession created financial burdens on developing countries, such coun-tries that have borrowed heavily from international banks during the 1970s have realized that banks are not the only, nor necessarily the best, source of funds for development. Thus, in an effort to obtain capital from different sources, most of the developing countries have decreased restrictions on foreign investment.
Can Simga-Mugan ([email protected]) is currently at Bilkent University, Ankara, and was a visiting associate professor in the Department of Accounting and Law, SUNY– Buffalo at the time of this research. Ays*e Yüce ([email protected]) is an associate pro-fessor of finance in the Faculty of Business at Ryerson University, Toronto, Canada.
As the market for capital becomes more global and less local, the importance of stock exchanges outside the developed countries increases. Investors perceive that growth opportunities are greater in those nations that are not yet economically mature. Traditionally, investors avoided these markets because of the political risks and the restrictions imposed upon foreign investors. However, in recent years the political risk of emerging markets has reduced tremendously. Moreover, there ex-ists a trend within developing countries to ease the restrictions that discourage foreign investment.
The Turkish administration passed a decree on January 24, 1980, to liberalize the economy that also started the impetus for privatization of the state-owned enter-prises (SOEs). The first legal step in privatization started with the enactment of Law No. 2983 in 1984. Next, the Istanbul Stock Exchange (ISE) started its operations on January 1, 1986, with fifty listed companies. All barriers to foreign investment were removed with Decree No. 32 (August 11, 1989), giving (1) the foreign investors the right to invest in Turkish stocks and mutual funds without getting the permission of the government and (2) the domestic investors the right to invest in foreign markets. Thus, the infrastructure of the privatization procedure has been prepared. As a re-sult, the privatization process started in 1986 and still continues.
The main impetus behind the privatization of SOEs was the burden they placed on the national budget. Since 1986, some complete and partial privatization of the SOEs has been accomplished. Although there are studies that addressed various aspects of privatization in Turkey (Keller et al. 1994; Kilci 1998; Onis 1991; Perotti and Guney 1993), the realization of the privatization program has not been dis-cussed in detail. In an attempt to provide information on this aspect, this paper aims to document and describe the privatization process of the last decade in Tur-key, and to discuss possible reasons for the findings. Thus, this paper will provide a multifaceted portrait of the privatization program in Turkey and will help en-hance the insight on the issue of privatization in emerging markets.
Previous Privatization Experience
A major factor behind the privatization movement that swept the world in the last two decades is the poor performance of the public enterprises as measured by profits. The well-known study by Boycko et al. (1996) discusses the motivation of the politicians who forego the company profits on behalf of excess employment. In a more recent study, Sinilcalco et al. (2001) empirically investigate the reasons and factors that affect privatization. They find that financial development as re-flected by the capital market development, economic development, and demo-cratic governments are positively related to privatization efforts. Similar to earlier studies, they also decide that financial distress triggers the privatization process.
Starting in the late 1970s, various countries initialized programs to reform SOEs. In the 1980s and early 1990s, more than 2,000 SOEs were privatized in developing countries, and 6,800 enterprises worldwide (Kikeri et al. 1992). In Western Europe,
privatization started in the early 1980s. The main reasons for privatization were the prevailing economic conditions, structural changes in some industries, and the in-creasing globalization in both the product and finance markets (Vickers and Wright 1989). Among the OECD countries, New Zealand and the United Kingdom had the highest privatization proceeds as a percentage of gross domestic product (GDP), by 14.1 percent and 11.9 percent, respectively, during the 1979–91 period. However, Turkey only averaged 1.6 percent during the 1988–91 period (Cook and Kirkpatrick 1994).
After the collapse of the Soviet Union, the privatization process started in the newly independent states and other socialist economies. In mixed economies, privatization is a tool for increasing the efficiency of the SOEs, whereas in the former socialist economies, it is an end in itself, essential to transform to a market system. In the Western countries and in many developing countries, each privatization transaction is handled individually in which valuation of the priva-tized enterprises becomes one of the most important features. In developed coun-tries, 90 percent of all privatizations until the beginning of the 1990s involved private sales, or public share offerings. In many developing countries, however, privatizations have been mainly through the sale of assets because of underdevel-oped capital markets. However, in Central and Eastern Europe and in the former Soviet Union, to achieve a speedy means of transferring ownership and thereby ensuring the reliance on market forces, mass privatization programs (MPPs) have emerged. MPPs involve grouping firms to be privatized and distribution of shares of state enterprises to the public, either for free or for a minimal charge. This is usually done through a voucher system, which takes the form of certificates or scrip distributed to the population and convertible into shares in state enterprises through an auction process (Lieberman et al. 1995). Boycko et al. (1994) state that the motivation behind mass privatization in such countries is to a great extent po-litical; that is, to allow a large amount of the public to benefit from privatization, and to prevent the transfer of assets to ex-Communists.
Perotti and Guney (1993) examine the privatization programs across developed and developing countries, that is, United Kingdom, France, Spain, Chile, Nigeria, Turkey, and Malaysia. They find evidence that suggests that the structure of privatization sales are not very different among these countries, that is, mostly partial sales; and that there is often underpricing in initial public offerings (IPOs). Various privatization techniques have been employed by different countries. For example, in the United Kingdom privatization has been mostly through trade sale or flotation in the stock market (H.M. Treasury 1996); in France the most common techniques are sales on the open market and employee buyouts (Durand 1996); in Portugal mostly public offerings are used (Sergio 1996); in Argentina tenders and public offerings are used together (Harteneck and McMahon 1996); in Korea public auctions, public share offerings, and trade sales are used (Kim 1996); and in Malaysia the most common methods are sale of equity, sale of assets, and build–operate–transfer (Ibrahim 1996).
Table 1 presents summary information regarding the privatization methods world-wide. In the eighty-nine countries included in the table (Turkey is excluded from the analysis), the most popular methods in the mixed economies are private or block sales, and public offerings followed by liquidation or sale of assets, lease and man-agement contracts. However, in Eastern and Central Europe and in CIS (Common-wealth of Independent States) countries, MPPs are the most common programs. Examination of Table 1 also shows that MPPs are not used in other countries. Al-though most of the socialist economies have MPPs, each country has different imple-mentation schemes (Estrin 1994; Lieberman et al. 1995; Paliwoda 1995).
State-Owned Enterprises in Turkey
Before discussing the privatization experience in Turkey, we would like to intro-duce the reader to characteristics of the SOEs in Turkey. First, SOEs were estab-lished in 1938 as state holding companies within the body of étatism or statism.1 Such companies were formed to provide the impetus for industralization in Tur-key, and thus they were established mainly in the sectors that required high initial capital. Considering the fact that the Turkish Republic was founded in 1923 after World War I on the remnants of the Ottoman Empire with debts to repay and with an almost nonexistent business class in the modern sense, the choice of statism seems appropriate. The main duties of such enterprises were twofold: to produce basic consumer goods, or basic materials, and to provide an education ground in modern management techniques. In the late 1940s, politicians and bureaucrats opted for growth through private enterprises and away from statism. In the post-1950 period, private establishments became increasingly important. However, the SEEs continued to perform a major role in the industralization process while go-ing through modifications. In later years, the SEEs underwent structural reform by Law No. 440 and Decree No. 233. To avoid semantic confusion among the names of SOEs some definitions are in order:
• state economic enterprises (SEEs): wholly owned state economic enterprises established for a business function to operate similar to private companies; • public economic enterprises (PEEs): wholly owned SEEs founded to
pro-duce and market scarce goods and services for the welfare of the public; • subsidiaries: enterprises wholly owned by an SEE or a PEE;
• associated companies: private corporations in which an SEE or a PEE has more than 50 percent ownership;
• equity investments: private corporations in which SEEs or PEEs or their sub-sidiaries have ownership of up to 50 percent; and
• plants or assets: local operating units wholly owned by subsidiaries or eq-uity investments.
In total, there are thirty-six SEEs and PEEs, of which the SEEs make up 78 percent. Similarly, there are 139 subsidiaries (state ownership is more than 51
T a ble 1 Privatization T echniques Used (b y Regions) Regions Emplo y e e / Mass (n umber of Public P ri v a te Sale of New management Management pr iv atization countr ies) off er ing sales assets F ragmentation in v estment b u y o u t Lease contr act prog ra m A uction Africa (27) 3 2 0 1 4 5 3 2 1 0 1 5 Asia (11) 9 9 2 6 2 6 4 P acific (5) 2 4 1 1 W e ster n Europe (11) 9 5 2 3 4 4 2 3 Middle East (4) 1 2 1 N o rth Amer ica (2) 2 2 2 1 1 Latin Amer ica and Car ib bean (12) 6 7 6 2 1 1 5 2 Easter n and Centra l Europe (5) 4 1 2 2 3 2 CIS (12) 6 1 2 4 1 1 6 T otal 32 59 27 18 13 11 28 26 14 8 Sour ces: Estr in (1994); Kaser (1995); Paliw oda (1995); V uylstek e (1988).
percent), most of which are owned by SEEs (91 percent), and 429 state equity investments, of which 89 percent are owned by SEEs. These numbers clearly dem-onstrate the importance of the SEEs for the economy.
Through the years, SEEs contributed to both industrial production and capital formation in the country. In the 1980s, the public sector accounted for about 50 percent of total fixed assets and about 40 percent of total value added in the manu-facturing industries (Onis 1991). Furthermore, they provided basic goods to the manufacturing enterprises at subsidized prices. Table 2 reflects the importance of SEEs in the Turkish economy by showing the basic indicators reflecting their per-formance. They account for about 25 percent of the annual imports and about 6 percent of annual exports on average during the 1989–95 period. In the same pe-riod, they employed about 3 percent of the total employees in Turkey, and realized on average 10 percent of annual total fixed investments in the country.
However, in the course of their development, most of the SEEs operated in monopolistic or oligopolistic markets. At the same time, they were highly pro-tected under the import substitution strategy prevailing at the time. Furthermore, they became the support establishments for the governments through the decades via employment expansion for political reasons. As a result of these opposing developments, the efficiency and performance of SEEs deteriorated over the years. Consequently, they started to draw from the central government budget and finally became a burden. In the second half of the 1970s, various strategies were dis-cussed to reform the SEEs. The SEEs were considered to be part of Mustafa Ataturk’s (founder of the Turkish Republic) heritage and therefore proponents of this view did not even consider privatizing them. However, another group favored private entrepreneurship and opted for privatization. The reforms never really achieved the purposes they set forth to achieve. Thus the productivity and effi-ciency of these companies decreased more, and due to their effect on the economy their price increases accelerated inflation in the 1970s and into the 1980s. Privatization in Turkey
Legal Aspects
On January 24, 1980, the Turkish government announced an economic decree that began the liberalization of the Turkish economy. The primary objectives of this decree can be summarized as follows:
1. the administration will take measures to promote export trading;
2. the administration will take measures to privatize the SOEs, its subsidiaries, and investments;
3. the exchange rate system will be floating rather than the fixed rate system that was used in the past; and
4. the administration will reduce its intervention in the markets, and interest rates will be determined by market forces.
To implement their decision to privatize the SOEs, the government passed Law No. 2983 (February 29, 1984), which permitted the sale of the assets of these firms. This law also allowed the state to lease SEEs to the private sector for a certain period of time. In 1986, the Mass Housing and Public Participation Admin-istration was founded with Decree No. 3291 to oversee the privatization of the SEEs. Another major legal structuring of privatization was put into effect in 1990 that dissolved Mass Housing and Public Participation Administration, and estab-lished Public Participation Administration to control all privatization-related is-sues. On November 24, 1994, Privatization Law No. 4046 went into effect in which the Privatization High Council and the Privatization Administration and the Privatization Fund were established, and the Public Participation Administration was dissolved (Turk Ekonomi Bankasi 1995). This law is the most encompassing one in that it regulates privatization of the SEEs, PEEs, public banks, and public services. Moreover, a fund was established (Privatization Fund) in a state-owned bank to accumulate all privatization revenues in the same account. Similarly, all privatization-related expenses are covered by this fund. Furthermore, regulations for foreign investors are established in which it is stated that asset sales to foreign investors should follow the reciprocity principle.
In 1985, a consortium prepared the Privatization Master Plan (PMP) for the State Planning Organization. In the master plan no distinction is made between the SEEs and the PEEs. In the plan, thirty-two SEEs have been categorized in three main groups, and priority is given to the following SEEs: Turban (tourism), THY (national airline company), USAS (airline catering), Yemsan, Citosan (cement), TPAO (petroleum), and Etibank (bank and mining) (Kilci 1998). However, this master plan was not realized in later years. Some of these companies are still in the portfolio of the Privatization Administration, for example, THY, and some of them
Table 2
Indicators Relating to Performance of SEEs as Percentage of Country Total
Indicator 1989 1990 1991 1992 1993 1994a 1995a
Fixed investment 13.90 10.01 9.86 8.97 7.37 6.91 6.11
Employment 3.35 3.25 3.05 2.94 2.80 2.57 2.52
Imports 38.24 33.45 24.60 25.44 22.02 24.72b 20.44b
Exports 9.34 5.25 8.71 8.57 6.05 5.75b 5.56b
Sources: Treasury Monthly Indicators, September 1994, Turkish Republic Prime Ministry Undersecretariat of Treasury, General Directorate of Public Finance. Monthly Bulletin of Foreign Trade, August 1995, Turkish Republic Prime Ministry
Undersecretariat of Treasury, General Directorate of Economic Research and Assessment. Notes: a estimates; b realized; 1995 first quarter only.
are not even included in the privatization plan in the near future, for example, TPAO.
Objectives of the Privatization Program
We first notice the policies and related objectives in regard to the SEEs in two main documents—the fifth Five-Year Development Plan (FYDP), which covers the 1985– 89 period, and the PMP. As a policy, the government aims to have “profitable” and “productive” SEEs and thus declared that necessary measures will be taken to en-sure that SEEs are “independently” operated both administratively and financially (FYDP, 1987). In the FYDP, it is also indicated that some investments of the SEEs will be sold through share issuance. However, it is also stated that SEEs are expected to continue investing in fixed assets, especially in energy, mining, transportation, and communication sectors, and to continue increasing the amount of investment over the planning period. In terms of financing such investments, the plan clearly states the desire to reduce the fund transfers from the general budget to the SEEs and to obtain funds from foreign sources while encouraging the SEE cost savings.
In the PMP, the following points emerge as the goals of privatization (Keller et al. 1994, p. 16):
• stimulating the economy;
• improving productivity and efficiency;
• increasing the quality and mixture of goods and services offered; • providing incentives and means for wider shareholder group; • enhancing the development of the capital market;
• minimizing state financial support and fund transfer to the SEEs; • improving labor productivity through share purchases by the workers; • balancing private and public ownership in the market;
• attracting foreign investment; and • generating revenues for the government.
From the two documents, it appears that the most important aspects are the efficient operation of SEEs and reaching to a well-balanced productive economy that stimulates capital market development. In the following sections of the paper, we will address these objectives when we appraise the privatization process. The Privatization Process
The first step in privatization is to include a specific SEE in the privatization port-folio of the Privatization Administration. The effect of this procedure is a change in the legal status of that SEE. From then on, the SEE starts to operate more freely from political influence under the umbrella of the Privatization Administration. Between 1985 and December 1998, a total of 177 wholly or partially state-owned firms were taken in to the scope of the privatization portfolio (Kilci 1998). This
number is the final number reached in December 1998 after some of the firms were dropped from the original list. Twenty enterprises have been eliminated from the original list, and the majority of the ones dropped from the original list have been acquired by the other state-owned companies. Originally, ten SEEs and one PEE (THY) were included in the privatization plan. In 1992, one of the SEEs was acquired by another SEE and thus was eliminated from the list (DPT 1994; Turk Ekonomi Bankasi 1995).
Table 3 presents information about the number of SOEs, showing how many were included in the privatization portfolio, and how many of the SOEs that were included in the portfolio were privatized. The Privatization Administration com-pletely privatized 113 enterprises between 1985 and 1998.2 State ownership in these companies ranged between 2.9 percent and 100 percent, with a mean of 58.7 percent and median of 49 percent. Among these companies, we observe that only three are SEEs. One of the SEEs was transferred to the workers, and the other two were dissolved through asset sales.
Among the total state-owned or participated enterprises of 604 firms, only 177, or 29.3 percent, are included in the privatization portfolio. Although a higher percentage of wholly owned state enterprises (SEEs and PEEs) were included in the portfolio (50 percent), complete privatization of such enterprises displays the lowest percentage among the categories, with only 16.7 percent, which is equivalent to privatization of 8.3 percent of the total of such companies. The highest privatization ratio is obtained in the subsidiary category, with 78.8 percent of the firms being privatized, which is followed by equity investments (64.5 percent). In the earlier years of the privatization process, mostly plant assets were sold through block sales. The first public offering took place in 1988, with the partial privatization of Teletas shares, a communication company. As of December 1998, 29.5 percent of all sub-sidiaries and 16.1 percent of all equity investments have been completely privatized. The main reasons for this finding are the economic viability and organizational and legal structure of the companies that are privatized. Most of them were estab-lished as corporations that can easily issue stocks without necessitating a change in the existing laws. The low percentage obtained in the SEEs category is mainly due to political reasons, that is, the reluctance of opposing groups to privatize the enterprises that are regarded as strategic for the economic growth and the defense of the country. The period that passed from the date of decision to privatize to actual privatization ranged from one month to nine years, with an average of three years. The highest average period is obtained in the equity investments category by 3.8 years. In subsidiary investments, the average period is 2.9 years.
The percentage of state ownership in the forty-one subsidiaries ranges between 52 percent and 100 percent, with a median of 100 percent. In the equity invest-ments category, stake-hold ranges between 2.29 percent and 99 percent, with a mean of 34.5 percent and a median of 30 percent (Table 4).
Although various combinations of privatization methods are utilized, the most common method is block sales in all categories. Table 4 reveals that the majority
T
a
b
le 3
Number of State-Owned Enterprises in Each Category
Number P ercent included in included P ercent P ercent T ype of state-o wned Number of p ri vatization in the p ri v atiz ed of p ri v atiz ed of enter p rise company por tf olio por tf olio the por tf olio the total State-owned enter p rises (SEE or PEE) 3 6 1 8 50.0 16.7 8.3 Subsidiar ies 139 5 2 37.4 78.8 29.5 Equity inv estments 429 107 24.9 64.5 16.1 T otal 604 177
of companies were privatized through block sales only—except the companies that are included in the equity investments. In the equity investments category, we see that besides block sales, public offerings and sales at the stock market and their combinations are used. Almost 20 percent of the companies in this category were privatized through the capital market.
Besides these completely privatized companies, some partial sales of shares have taken place. A total of sixteen companies in the privatization portfolio have been partially privatized. The makeup is as follows: one PEE, six SEEs, four sub-sidiaries, and five equity investments. Most of the partial privatization has been accomplished by gradual asset sales. The SEEs in this group are monopolists, or are important for the regional or the national economy, and strategy, for example, Erdemir (a major steel company), THY (Turkish Airlines), and PETKIM (petro-leum). The political debate whether to privatize such companies still continues. In a few cases, the opposing group took the privatization decision to a higher court and obtained verdicts to reverse the sales, even after a few years. Therefore, the Privatization Administration is extremely careful in privatizing companies with strategic importance. The percentage of ownership of such strategically important and large companies that have been privatized through the stock market by either initial or second offerings or sales of shares at the market is minimal, within a range of 1.8 to 6.5 percent of the total shares.
Only one PEE (THY) and six SEEs were privatized, which resulted in very insig-nificant ownership transfers; that is, the privatized share percentage is less than 10 percent. Complete privatizations have mostly taken place in subsidiaries and equity investments. Perotti (1995) provides an explanation for the gradual transfer of own-ership and states that when companies are highly sensitive to public policy choices, those companies will tend to be privatized with small initial shares. The findings in Turkey also support this theory. Therefore, Turkey still needs to privatize the re-maining SEEs before realizing the full effects of the privatization program.
As of December 1998, there existed seventy-six firms and some fixed assets in the privatization list. In thirty-five of these, the state owns more than 50 percent. Some of these companies are the most important companies for the Turkish economy; for example, Eregli Demir Çelik is the major steel company, and THY is the national airline company. Nine SEEs and one PEE are still in the privatization program, with almost 100 percent shares. Although privatization of these compa-nies is reflected in the annual government statements, complete privatization of these companies has not been accomplished yet.
Evaluation of the Privatization Process Development of the Capital Market
One of the aims of the privatization process was to enhance the development of the capital market that was established in 1986, just as the talks of privatization of the
T
a
b
le 4
T
ype of Company and the Privatization Method Utilized
P ri v atization method Number of P ercent hold BO and B S , P O , PO and PO and T ype company mean (median) B S ISE P O and ISE ISE IO Subsidiaries 4 1 96.84 3 8 2 1 (100.00) Equity inv estments 6 9 34.48 5 0 42391 (30.00) T otal 100 8 8 44491 Notes: PO—pub lic of fe ri
ng; BS—block sales; IO—intern
a
tional of
fe
SEEs started. In this section, we will try to assess the effect of privatization on the stock market.
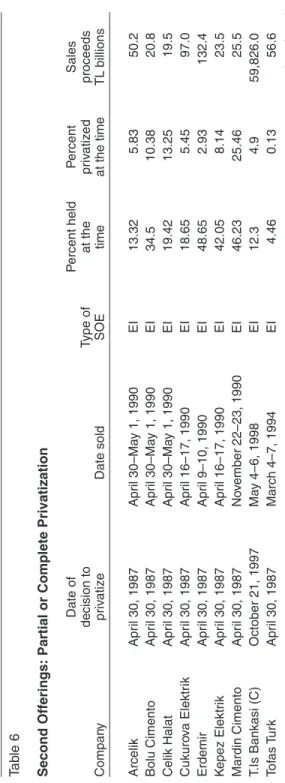
As of the end of 1998, there were thirty-five companies traded on the ISE that were partially or completely privatized by the Privatization Administration. These companies were privatized by IPOs, second offerings, block sales, international offerings, or by a combination of these methods. Tables 5 and 6 present informa-tion about the companies traded on the market. The Privatizainforma-tion Administrainforma-tion holds shares in eight companies, with ownership ranging from 0.01 percent (due to stock dividends that occurred after the second offering) to 98.17 percent (THY). Among the thirty-five companies that are currently traded on the ISE, eighteen were privatized by IPOs that took place between 1988 and 1991. A public announce-ment is made in which the date of offering and price is made public and number share requests (demands) from the investors are gathered. The number of share requests for IPOs and for second-offerings indicates that investors are mostly inter-ested in the privatized companies with track records in the stock market. There are, on the average, 19,423 demands for the second offerings, but only 11,190 demands for the IPOs. We believe that informed investors follow such announcements when they form their portfolios. This was the case in a recent offering in which the offer price was heavily discounted in 1998; the case of second offerings of IS BANK.
Perotti and Guney (1993) draw attention to the extent of underpricing in IPOs. When we examine the performance of initial offerings, we fail to notice premiums of that extent. In six of the companies, the first day price is higher than the offer price, with an average of 15.72 percent, and the first day prices of four companies are lower than the offer price, with an average of 9.03 percent. In the remaining eight cases, the offer price is the same as the first day market price. The overall effect is an average premium of 0.03 percent (median 0 percent). The strongest underpricing is noticed in a cement company (Afyon Cimento), with 30 percent. On the other hand, when the second offerings are examined, we see a different picture. In all nine second offerings, the first day market price immediately in-creased within the range of 1.6 percent to 29.2 percent, with a mean of 8.76 per-cent and a median of 5.94 perper-cent. Except one company (USAS), all sales in the stock market as initial or second public offerings are partial sales. When we exam-ine the average daily proceeds from such sales and the daily average trade volume of the ISE at that time, we see that only five of the IPOs reached a trading volume that is greater than the 10 percent of the average daily trading volume. However, in eight of the nine second offerings, daily average sales exceeded 10 percent of average daily trading volume of the market.
We summarize the number of privatization transactions and the methods in Table 7. Examination of the table reveals that, initially, privatization started with asset sales that are mostly sales of incomplete plants. Overall asset sales and block sales are the most prevalent methods by 50 percent and 24 percent, respectively, a pattern that is also observed in other developing mixed economies. When the tim-ing of transactions is examined, we see that most transactions have taken place in
T
a
b
le 5
Initial Public Offerings: Partial or Complete Privatization
Date of First P ercent P ercent Sales decision to tr ading T ype of held at p riv atized proceeds Company p rivatize date company the time at the time TL billions
Adana Cimento (A)
April 30, 1987 F ebr uar y 21, 1991 E I 23.86 17.16 79.2 Adana Cimento (C) April 30, 1987 F ebr uar y 21, 1991 E I 23.42 17.16 8 .8 Afyon Cimento April 30, 1987 March 27, 1991 S U B 48.6 39.87 29.9 Alcatel/T eletas October 28, 1986 March 3, 1988 E I 40.0 22.0 15.4 Ditas/Dogan April 30, 1987 M a y 8, 1991 E I 14.77 2.51 0 .9 Gima April 30, 1987 J u n e , 5, 1991 S U B 54.68 4.15 1 .7 K o ny a Cimento April 30, 1987 October 26, 1990 E I 39.87 31.13 48.6 Mig ros T u rk April 30, 1987 F ebr uar y 27, 1991 E I 42.22 36.4 18.2 Netas October 28, 1986 March 15, 1993 E I 20.0 7.75 80.5 Nigde Cimento March 30, 1989 M a y 15, 1991 S U B 99.85 12.72 10.5 P etkim September 11, 1987 J une 30, 1990 SEE 91.89 8.08 397.2 P e trol Ofisi September 5, 1990 M a y 30, 1991 S U B 100.0 4.02 57.9 T o fas Oto April 30, 1987 J u ly 1, 1991 E I 23.0 1.36 4 .1 T o fas T u rk April 30, 1987 J u ly 1, 1991 E I 23.13 0.85 25.8 T upr a s J uly 10, 1990 M a y 30, 1991 S U B 100.0 1.66 24.3 T u rk Hav a Y ollar i A ugust 22, 1990 December 8, 1990 PEE 100.0 1.55 13.9 Usas A p ri l 30, 1987 October 25, 1993 S U B 30.0 30.0 192.0 U n y e Cimento April 30, 1987 N o v ember 3, 1990 E I 49.21 2.86 2 .6 (continues)
T a b le 5 (Continued) Daily a v er age A v er age tr ade daily volume in sales ISE in First da y Number proceeds that y e a r O ff e r closing Discount of Company (TL billions) (TL billions) p rice p rice (percent) demands
Adana Cimento (A)
26.4 144 270,000 300,000 11.11 3,355 Adana Cimento (C) 2 .9 144 30,000 33,000 10.00 3,355 Afyon Cimento 4 .3 144 30,000 39,000 30.00 12,591 Alcatel/T eletas 5 .1 1 5,000 6,396 27.92 41,695 Ditas/Dogan 0 .5 144 7,000 6,300 –10.00 1,263 Gima 0 .9 144 4,000 4,000 0.00 283 K o ny a Cimento 24.3 62 25,000 25,000 0.00 6,396 Mig ros T u rk 9 .1 144 8,000 8,000 0.00 3,951 Netas 11.5 1,037 8,250 8,250 0.00 4,897 Nigde Cimento 5 .3 144 165,000 145,000 –12.12 1,125 P etkim 33.1 6 2 2,500 2,400 –4.00 76,119 P e trol Ofisi 19.3 144 4,000 4,000 0.00 17,206 T o fas Oto 4 .1 144 15,000 16,500 10.00 3,147 T o fas T u rk 12.9 144 19,000 20,000 5.26 3,147 T upr a s 8 .1 144 2,000 1,800 –10.00 15,456 T u rk H a v a Y ollar i 1 .5 62 3,000 3,000 0.00 2,488 Usas 64.0 1,037 32,000 32,000 0.00 4,672 U n y e Cimento 1 .3 62 10,000 10,000 0.00 2 8 1 Notes:
(A) and (C): types of stocks traded on the mar
k
et; EI: equity in
v
estment; SUB: subsidiary
T
a
b
le 6
Second Offerings: Partial or Complete Privatization
Date of P ercent held P ercent Sales decision to T ype of at the p ri v atize d proceeds Compan y p ri v atize Date sold SOE time at the time TL billions Arcelik Apr il 30, 1987 April 30–Ma y 1, 1990 E I 13.32 5.83 50.2 Bolu Cimento Apr il 30, 1987 April 30–Ma y 1, 1990 E I 34.5 10.38 20.8 Celik Halat Apr il 30, 1987 April 30–Ma y 1, 1990 E I 19.42 13.25 19.5 Cukuro v a Elektr ik Apr il 30, 1987 April 16–17, 1990 E I 18.65 5.45 97.0 Erdemir Apr il 30, 1987 April 9–10, 1990 E I 48.65 2.93 132.4 K epez Elektri k Apr il 30, 1987 Apr il 16–17, 1990 E I 42.05 8.14 23.5 Mardin Cimento Apr il 30, 1987 N o v ember 22–23, 1990 E I 46.23 25.46 25.5 T .Is Bankasi (C) October 21, 1997 Ma y 4–6, 1998 E I 12.3 4.9 59,826.0 T o fas T u rk Apr il 30, 1987 March 4–7, 1994 E I 4.46 0.13 56.6 (continues)
T a b le 6 (Contin ued) Daily a v e rage A v e rage tr ade volume daily sales in ISE in Offe r First da y proceeds that y ear p rice closing Discount Number of Compan y (TL billions) (TL billions) (TL) p rice (percent) demands Arcelik 25.1 6 2 21,500 23,149 7.67 12,618 Bolu Cimento 10.4 6 2 12,750 13,911 9.11 8,157 Celik Halat 9.8 6 2 13,750 15,948 15.99 6,517 Cukuro v a Elektr ik 32.3 6 2 23,750 24,000 1.05 22,184 Erdemir 132.4 6 2 11,750 12,243 4.20 33,953 K epez Elektri k 11.8 6 2 14,400 15,255 5.94 8,320 Mardin Cimento 12. 8 6 2 50,000 50,800 1.60 1,280 T .Is Bankasi (C) 19,942.0 110,904 24,000 31,000 29.17 80,978 T o fas T u rk 8.1 2,573 72,000 75,000 4.17 801 Notes: A v era g e trading v
olume in 1998 is on monthly basis; (C): type of stocks traded on the mark
et; EI: equity in
v
the 1991–98 period, reaching its maximum in 1993. In 1993, sales of shares in the stock market also reached its maximum value. During the 1990–94 period, the Privatization Administration acted as market maker to some extent, which is evi-denced by the number of public offerings and share sales at the stock market. However, there were complaints from the general public, and they have changed their strategy since then.
The prevalent privatization methods and the perceived capital market effects of share offerings of privatized firms lead us to believe that privatization process did not really provide the impetus for the capital market development as it was origi-nally anticipated.
Privatization Revenues
Although generating revenues was ranked lower than other objectives of privatization, when it is interpreted within the context of the FYDP, it becomes important. It is important from two perspectives: foreign investments and transfers from the central budget. Table 8 gives the amount of privatization revenues be-tween 1985 and December 1998 in terms of U.S. dollars. A total of $4.5 million was obtained from the privatization revenues during this period, in which block sales consist of 44.65 percent, international offerings 15.79 percent, asset sales 13.21 percent, sales at the stock market 11.57 percent, IPOs 6.18 percent, and second offerings 8.59 percent. The findings of Kilci (1998) show that 46 percent of total privatization revenues came from sales of shares in equity investments, 32 percent from subsidiary sales, and 21 percent from sales of SEEs. Furthermore, the findings disclose that almost 50 percent of the total privatization revenues as of the end of 1997 are provided by privatization of twelve companies. Sale of shares in one of these companies, CITOSAN (cement), which is partially privatized, makes up 26 percent of the total revenues. The main reasons for this finding are the good performance record of the company, the organization of the company that permits it to operate free from political pressures, the suitability of the company to partial sales, and the demand of investors. As discussed previously, these partial privatization realizations provided as much revenues as the complete privatizations. Furthermore, although there are only two international offerings, they provide al-most 16 percent of the privatization revenues, whereas asset sales, although largest in number, provide only about 13 percent of the total privatization revenues.
The revenues are mostly provided by the domestic investors (77.66 percent). We notice international investors in 1989, 1994, and 1998 especially. Most of the inter-national investors are multiinter-national companies operating in, for example, cement (France), cable networking (Finnish), electronics (Germany), and automotive (Italy). In an earlier paper, Molz (1990) points out the multinational company involvement in the Turkish privatization and discusses the advantages and disadvantages for the multinational company in general. There was opposition to sales to foreign compa-nies earlier, and necessary regulatory steps have been taken since then.
T a b le 7 Privatization T ransactions T ype 1985 1986 1987 1988 1989 1990 1991 1992 1993 1994 1995 1996 1997 1998 T otal P ercent Bloc k sales 7 1 2 1 0 4 18 15 10 13 6 8 6 100 24.15 Pub lic o ff e rings 1 1 1 1 1 2 2 1 2 8 6.76 Inter national o ff er ings 1 1 2 0.48 Sales at ISE 2 1 6 8 16 11 19 8 2 2 2 77 18.60 Asset sales 1 4 2 3 2 2 3 2 0 1 0 7 5 2 6 2 8 3 1 207 50.00 T otal 1 1 1 5 7 1 8 2 1 3 4 2 9 5 6 3 1 9 0 3 4 3 6 4 1 414
T a b le 8 Privatization Revenues 1985–98 (in million U .S. dollars) A s s e t P u b lic Inter national Sale at Bloc k T otal P ercent In v estors P e riod sales IPO o ff e ring o ff e ring IS E sales sales o f G N P Domestic F oreign 1985–86 0.23 0.00 0.00 0.00 0.00 1.20 1.43 1.43 0.00 1987 0.02 0.00 0.00 0.00 0.26 0.13 0.41 0.00 0.41 0.00 1988 0.66 13.09 0.00 0.00 0.41 13.59 27.75 0.05 14.16 13.59 1989 0.78 0.00 0.00 0.00 9.22 121.20 131.20 0.19 11.75 119.45 1990 0.04 174.18 146.40 0.00 165.37 0.00 485.99 0.47 485.99 0.00 1991 20.31 69.72 3.06 0.00 106.93 43.83 243.84 0.23 200.87 42.97 1992 0.00 0.00 0.00 0.00 12.62 410.27 422.88 0.40 358.82 64.07 1993 16.14 24.34 0.00 0.00 141.37 364.11 545.95 0.45 494.94 51.02 1994 4.61 0.00 2.82 330.00 66.56 7.75 411.76 0.48 75.88 335.87 1995 181.94 0.00 0.00 0.00 19.74 312.88 514.56 0.43 513.41 1.15 1996 72.02 0.00 0.00 0.00 1.99 217.99 292.00 0.24 292.00 0.00 1997 214.37 0.00 0.00 0.00 0.00 251.15 465.52 0.36 465.52 0.00 1998 90.34 0.00 238.89 388.99 2.12 288.56 1008.90 0.73 619.91 388.99 601.46 281.33 391.16 718.99 526.59 2,032.64 4,552.17 3,535.07 1,017.10
Except in 1994, we notice an increase in the funds provided by domestic investors. In 1994, Turkey faced a major financial crisis and as a result there was heavy devaluation of the Turkish lira against all strong currencies. The perfor-mance of the stock market declined in that period as well. These two factors contributed to the decrease in the funds provided by domestic investors in that year. When the development of revenues is examined, we see that almost 97 percent of the total revenues have been generated since 1990, with fluctuating amounts. Although privatization revenues never generated outstanding amounts, they averaged around 33 percent of the gross national product (GNP) in the 1990s. Privatization revenues reached their peak percentage of GNP in 1993 at 73 percent (Table 8).
Table 9 presents the sources and uses of privatization funds during the 1986–97 period. The amount of cash generated from privatization revenues in this period makes up 65.42 percent of the total cash in flow. The amount of total sales between 1986 and 1997 was $3.54 billion (from Table 8; total sales as of the end of 1997) and cash collection from privatization revenues in the same period was $3.16 bil-lion, which gives a collection ratio of 89 percent. A major portion of the funds is collected from dividend income from shares of companies in the privatization port-folio (26.83 percent). The main expenditures in the same period are incurred for capital increases of the companies in the privatization portfolio (44.45 percent) and transfers to the Turkish Treasury.
Examination of Table 9 reveals that the total cash provided by the privatization revenues is enough to cover all direct privatization expenses, but does not cover the indirect expenses such as capital transfers and payments to the Turkish Trea-sury. Capital increases and transfers show the amount of cash transferred to the companies in the portfolio for betterment and rehabilitation purposes. These trans-fers are not used to pay the debts of such companies. Transtrans-fers to the Turkish Treasury are obligatory amounts determined by related laws; the latest one is Law No. 4046, which was mentioned earlier in this paper. Sometimes the Privatization Administration even borrows to pay this amount; for example, in 1995 the admin-istration obtained foreign loans to comply with the obligation to the Turkish Trea-sury. The amount of net cash inflow, only $239 million over the initial thirteen-year period, does not appear to be satisfactory to accomplish the initial goals of the privatization program in Turkey. To summarize, we could state that the privatization process attracted some foreign investment; however, still most of the funding was provided through the domestic investors. The amount of transfers from the central budget was around $400 million during the 1985–86 period. Later, the amount started to increase and reached its peak level in 1991 at $3.2 billion. After 1994, the withdrawals from the central budget started to decrease gradually to about $950 million in 1998.3 Although we could possibly state that some positive effect of privatization was felt on the central budget by not keeping the transfers at the highest level, it is quite hard to defend the notion that privatization helped to achieve the goal of decreasing the funds flow from the central budget because the amount
of transfers when the privatization process started was almost one-third of the amount after a decade of privatization.
Productivity Improvements
Improving the productivity and efficiency of the economy appears to be one of the main objectives of the privatization program as well as the FYDP. In this section,
Table 9
Cash Proceeds from Privatization Activities, 1985–97
Cash inflow Million USD
From privatization: Asset sales 307.83 Public offering 424.53 International offering 316.30 Sale at ISE 524.10 Block sales 1,583.13
Total from privatization 3,155.89
From other sources:
Dividend revenue 1,294.16
Privatization bills issued 24.14
Collection of loans 19.64
Loans and grants 259.86
Other 70.40
Subtotal 1,668.20
Total cash in flow 4,824.09
Cash outflow: Direct expenses:
Transfer to companies in the privatization program 303.90
Consulting 41.80
Public relations 33.56
Capital increase 2,037.97
ISE purchases 134.24
Social assistance supplements 100.95
Direct expenses total 2,652.42
Indirect expenses:
Transfers to treasury 1,375.42
Loans extended to companies 382.19
Loan repayments 134.04
Others 40.90
Indirect expenses total 1,932.55
we will present a comparison of the performance of the companies, before and after privatization, in order to assess the effect of privatization by examining the performance of sample firms privatized by different methods.
We will start our analysis with plant sales. Examination of the productivity of such companies before and after privatization yields mixed results. When plants were sold with the condition that they should continue production and keep the production at a certain level, after privatization the companies on average achieved and passed the benchmark by the second year after privatization. Labor productiv-ity increases because of the increase in production and the decrease in the number of employees. At the end of the second year, such companies operate with around 66 percent of the labor force that was available before privatization.4 Therefore, the goal of increasing productivity is achieved in these cases. Table 10 provides a summary of these companies.
However, the production level of such companies decreased by almost 32 per-cent and, moreover, some of them have closed. Therefore, we observe a higher decrease in the labor force; the total number of employees drops to about 40 per-cent of the starting workforce (see Table 10). As a result, overall labor productivity has increased.5 Hence, one could argue that the privatization of such plant sales did not help to improve the domestic production but decreased the amount of burden on the central budget.
Next, we are going to examine the performance of some of the companies that were privatized by block sales. Our sample consists of nine companies in which the state had more than 50 percent ownership. The new owners undertook new capital investments in these companies. In one case, however, the Privatization Administration paid for 40 percent of the investments. In this special case, the steel factory was sold to the employees for a very minimal amount of money. Average capacity utilization of these companies increased from 63 percent to 67 percent, whereas the number of employees decreased by 6 percent. The cement companies that were always cited as examples of successful privatization face a capacity utilization rate decrease after privatization, down by 9 percent from 75 percent, accompanying a 50 percent reduction in workforce. Furthermore, although they were profitable before privatization, they started to incur losses afterward.
Panel B of Table 10 presents summary income statements of five of the compa-nies privatized through block sales. Although operating income increases consid-erably after privatization, this positive effect does not carry into after-tax profits, but reduces the amount of losses. In summary, privatization improved the produc-tivity of some companies but did not have the same effect on other companies. In terms of financial performance, none of the companies provides satisfactory re-sults. Thus, we could argue that block sales or asset sales did not contribute to a well-balanced economy and fail short of accomplishing the goals stated earlier such as: stimulating the economy, improving the productivity and efficiency, and increasing the quality and mixture of goods and services offered.
T
a
b
le 10
Performance Comparison Before and
After Privatization P anel A Number of P e rf o rmance Bef o re Y ear of Second ye a r Plant sales ( n = 65) companies measure(s) p ri v atization p ri v atization of pr iv atization Conditional—preset 2 6 Achie vement of preset 74.26 121.57 amount of le v el (percent) production Number of emplo y ees 3,550 2,574 (after) Conditional—continuance 7 Change in production—te xtile 55,500 tons 9,974 tons 32,336 tons of production 3 2 Capacity utilization percent—dair y products 3 7 38 (after) Number of emplo y ees 3,696 1607 (after) Bloc k sales 8 Capacity utilization percent 62.68 67.14 (after) Number of emplo y ees 9,351 8,765 (after) In v
estments (USD million)
131.2 (after)
Cement
2
4
Capacity utilization percent
7 5 64 (after) Number of emplo y ees 6,997 3,523 (after)
Profit (loss) (million)
$22.28 $13.11 $(22.08) In v estments (million) $29.66 $41.48 153.1 (continues)
T a b le 10 (Continued) P anel B:
Income statements of some of the companies pri
v
atiz
e
d
Bloc
k sales of five companies
USD million Bef ore Y ear of Second year Income statement p ri vatization p ri v atization of pr iv atization Sales $126.23 $136.89 $168.71
Cost of goods sold
$111.49 $111.39 $123.68 Gross margin $14.74 $25.50 $45.04 Operating e xpenses $21.97 $17.84 $34.09 Operating income $(7.22) $7.66 $10.94 Financing e xpense $2.18 $5.63 $8.41 Income bef ore tax $(9.40) $2.03 $2.54
Extraordinary gains and
losses $(13.54) $(4.37) $(6.08) Income after e x tr a ordinar y $(22.94) $(2.34) $(3.54)
Conclusion
In this paper, the privatization program in the Turkish economy is investigated, and brief background information is provided. Although there were debates on whether to privatize or to rehabilitate the SEEs in the past two decades, the deci-sion to privatize is taken with the economic reforms in the early 1980s. The major portion of the privatization activities involves the sale of state shares in already established private companies. Although the state is willing to sell its shares in existing private firms, or small state enterprises, major SEEs and state banks are yet to be privatized. One of the main reasons is the opposition from the leftist parties who want to reform the SEEs rather than selling them.
Various privatization methods have been utilized in this process. The most com-mon method of privatization is block sales. We notice IPOs by the Privatization Administration in the period when the stock market was not as developed. Since then, liberalization in the stock market and opening the market to foreign investors have been successfully implemented. Consequently, although the Istanbul Stock Exchange is still an emerging market, it has shown considerable development since it was founded in 1986. The most significant case that had some effect on the stock market is the privatization of TELETAS in 1988 when the market was not as developed.
As this paper indicates, the Turkish administrations have only achieved partial progress in the privatization of state-owned economic enterprises. At this time, the performance of the companies privatized through plant and block sales displays a rather gloomy picture in terms of achieving the initially stated objectives in both the fifth FYDP and the Privatization Master Plan. Furthermore, the initial and second public offerings in the stock market of the shares of some SOEs did not provide the expected impetus. Unfortunately, we also fail to observe the positive effects of privatization on the economy. The major state economic enterprises, such as Turkish Airlines, Eregli Steel Company, and Petrol Ofis, have not been privatized yet. We will be able to fully judge the success of the process only after privatization of these big companies has taken place.
Notes
1. “Etatism was a means of building a national economy based on private enterprise, through the protection and support of the state and in some instances its direct interventions in the form of SEES” (Kongar 1986, p. 37).
2. The information in the following sections is obtained from the periodic bulletins of the Republic of Turkey Privatization Administration (www.oib.gov.tr/1985-1998eng.htm).
3. www.treasury.gov.tr, November 2001
4. T.C. Basbakanlik Ozellestirme Idaresi Baskanligi, Ozellestirme Oncesi ve Sonrasi Faaliyet Bilgileri, Ozellestirme Sonrasi Takip Grup Baskanligi, Nisan 2000—Varlik Satisi Yoluyla Ozellestirilen Sumer Holding ve Sut Isletmelerinin Ozellestirme Oncesi ve Sonrasi Faaliyet Bilgileri [Republic of Turkey, Privatization Administration of the Prime Ministry, Information on the Operations Before and After Privatization, Office of Monitoring After
Privatization, April 2000—Operating information before and after privatization regarding Sumer Holding and Sumer Sut that were privatized through asset sale].
5. See note 4.
References
Boycko, M.; A. Schleifer, and R.W. Vishny. 1994. “Voucher Privatization.” Journal of Fi-nancial Economics 35, no. 2: 249–266.
———. 1996. “A Theory of Privatization.” Economic Journal 106, no. 435: 309–319. Cook, P., and C. Kirkpatrick. 1994. “Assessing the Results of Privatization: A Review of
Methodologies and Evidence.” Working Paper, University of Manchester, UK. DPT. 1994. Baslangicindan bugune Turkiye’de Ozellestirme Uygulamalari (1984–1994)
[Privatization Applications in Turkey Since the Beginning (1984–1994)]. Ankara: State Planning Organization.
Durand, P. 1996. “Privatization in France.” In Privatization in Asia, Europe and Latin America, pp. 95–106. Paris: OECD.
Estrin, S. 1994. Privatization in Central and Eastern Europe. London: Longman. Harteneck, G., and B. McMahon. 1996. “Privatization in Argentina.” In Privation in Asia,
Europe and Latin America, pp. 67–86. Paris: OECD.
H.M. Treasury. 1996. “Privatization in the U.K.” In Privatization in Asia, Europe and Latin America, pp. 29–40. Paris: OECD.
Ibrahim, A. 1996. “The Malaysian Privatization Experience.” In Privatization in Asia, Eu-rope and Latin America, pp. 41–52. Paris: OECD.
Kaser, M. 1995. Privatization in the CIS. London: Royal Institute of International Affairs. Keller, A.Z.; C. Dogan; and O. Eroglu. 1994. “Evaluation Privatization Policies in Turkey.”
International Journal of Public Sector Management 7, no. 1: 15–24.
Kikeri, S.; J. Nellis; and M. Shirley. 1992. The Lessons of Experience. Washington, DC: World Bank.
Kilci, A. 1998. “Turkiye’de Ozellestirme Uygulamalari: 1984–1998” [Privatization Appli-cation in Turkey: 1984–1998]. DPT Yillik Programlar ve Konjonktur Degerlendirme Genel Mudurlugu, Finansman Dairesi Baskanligi, Temmuz [Report by the State Plan-ning Organization Annual Programs and Conjecture Evaluation Directorate, Depart-ment of Finance], Ankara, July.
Kim, B. 1996. “Korea’s Privatization Experience.” In Privatization in Asia, Europe and Latin America, pp. 107–115. Paris: OECD.
Kongar, E. 1986. “Turkey’s Cultural Transformation.” In The Transformation of Turkish Culture, ed. G. Renda and C.M. Kortepeter, pp. 19–68. Princeton, NJ: Kingston Press. Lieberman, I.W.; A. Ewing; M. Mejstrik; J. Mukherjee; and P. Fidler. 1995. Mass Privatization in Central and Eastern Europe and the Former Soviet Union: A Compara-tive Analysis. Washington, DC: World Bank.
Molz, R. 1990. “Privatization in Developing Countries.” Columbia Journal of World Busi-ness 25, nos. 1–2: 17–24.
Monthly Bulletin of Foreign Trade. 1995. Republic of Turkey, Prime Ministry Undersecretariat of Treasury, General Directorate of Economic Research and Assessment, Ankara, Au-gust.
Onis, Z. 1991. “The Evolution of Privatization in Turkey: The Institutional Context of Public-Enterprise Reform.” International Journal of Middle East Studies 23, no. 1: 163–176.
Paliwoda, S.J. 1995. Investing in Eastern Europe: Capitalizing on Emerging Markets. Wokingham, UK: Addison-Wesley.
Perotti, E. 1995. “Credible Privatization.” American Economic Review 85, no. 4: 847–859. Perotti, E., and S.E. Guney. 1993. “The Structure of Privatization Plans.” Financial
Man-agement 22, no. 1: 84–98.
Sergio, R. 1996. “The Portuguese Privatization Experience.” In Privatization in Asia, Eu-rope and Latin America, pp. 53–66. Paris: OECD.
Sinilcalco, D.; B. Bortolotti; and M. Fantini. 2001. “Privatization Around the World: New Evidence from Panel Data.” CESifo (Center for Economic Studies and Ifo Institute for Economic Research) Working Paper Series No. 600, Munich (available at www.ssrn.com/ link/CESifo.html); FEEM (Fondaziaone Eni Enrico Mattei) Working Paper No. 77.2001, Milan.
Treasury Monthly Indicators. 1994. Republic of Turkey, Prime Ministry Undersecretariat of Treasury, General Directorate of Public Finance, Ankara, September.
Turk Ekonomi Bankasi. 1995. Privatization in Turkey. Istanbul: Intermedya.
Vickers, J., and V. Wright. 1989. “The Politics of Industrial Privatization in Western Eu-rope: An Overview.” In The Politics of Privatization in Western Europe, ed. J. Vickers and V. Wright, pp. 1–30. London: Frank Cass.
Vuylsteke, C. 1988. “Techniques of Privatization of State Owned Enterprises.” World Bank Technical Paper No. 88, vol. 1, Washington, DC.