RESEARCH ARTICLE
A novel 20-gene prognostic score in
pancreatic adenocarcinoma
Sec¸il Demirkol CanlıID1
*, Ege Dedeoğlu2, Muhammad Waqas Akbar2,
BarışKu¨ c¸u¨ kkaraduman2, Muratİşbilen2¤, O¨ zgeŞu¨ kru¨ oğlu Erdoğan3, Seda Kılıc¸ ErciyasID3, Hu¨ lya Yazıcı3, Burc¸ak Vural4, Ali Osmay Gu¨ re2
1 Molecular Pathology Application and Research Center, Hacettepe University, Ankara, Turkey, 2 Department of Molecular Biology and Genetics, Bilkent University, Ankara, Turkey, 3 Cancer Genetics
Division, Department of Basic Oncology, Institute of Oncology, Istanbul University, Istanbul, Turkey,
4 Department of Genetics, Aziz Sancar Institute of Experimental Medicine, Istanbul University, Istanbul,
Turkey
¤ Current address: DNAFect Genetics Consulting R&D and Biotechnology Inc., Kocaeli, Turkey *[email protected]
Abstract
Pancreatic ductal adenocarcinoma (PDAC) is among the most lethal cancers. Known risk factors for this disease are currently insufficient in predicting mortality. In order to better prognosticate patients with PDAC, we identified 20 genes by utilizing publically available high-throughput transcriptomic data from GEO, TCGA and ICGC which are associated with overall survival and event-free survival. A score generated based on the expression matrix of these genes was validated in two independent cohorts. We find that this “Pancreatic can-cer prognostic score 20 –PPS20” is independent of the confounding factors in multivariate analyses, is dramatically elevated in metastatic tissue compared to primary tumor, and is higher in primary tumors compared to normal pancreatic tissue. Transcriptomic analyses show that tumors with low PPS20 have overall more immune cell infiltration and a higher CD8 T cell/Treg ratio when compared to those with high PPS20. Analyses of proteomic data from TCGA PAAD indicated higher levels of Cyclin B1, RAD51, EGFR and a lower E-cad-herin/Fibronectin ratio in tumors with high PPS20. The PPS20 score defines not only prog-nostic and biological sub-groups but can predict response to targeted therapy as well. Overall, PPS20 is a stronger and more robust transcriptomic signature when compared to similar, previously published gene lists.
Introduction
PDAC is among the most lethal cancer types world-wide with records of 5 year survival of less than 5% [1]. A projection of cancer incidence and death rates in US showed that pancreas can-cer will become the second cause of cancan-cer-related death by 2030 [2].
Currently the only curative option for PDAC is surgical resection (pancreaticoduodenect-omy), however less than 20% of patients have resectable tumor due to the aggresiveness of the disease [3]. Standard therapy is gemcitabine and gemcitabine combinations with other drugs a1111111111 a1111111111 a1111111111 a1111111111 a1111111111 OPEN ACCESS
Citation: Demirkol Canlı S, Dedeoğlu E, Akbar MW, Ku¨c¸u¨kkaraduman B,İşbilen M, Erdoğan O¨ Ş, et al. (2020) A novel 20-gene prognostic score in pancreatic adenocarcinoma. PLoS ONE 15(4): e0231835.https://doi.org/10.1371/journal. pone.0231835
Editor: Nicola Silvestris, Cancer Institute, ITALY Received: February 21, 2020
Accepted: April 1, 2020 Published: April 20, 2020
Copyright:© 2020 Demirkol Canlı et al. This is an open access article distributed under the terms of theCreative Commons Attribution License, which permits unrestricted use, distribution, and reproduction in any medium, provided the original author and source are credited.
Data Availability Statement: All data used in this
study is from public databases as described in the methods.
Funding: This study was supported by the
Research Fund of Istanbul University (Project no: ONAP 46784) to BV. The funder had no role in study design, data collection and analysis, decision to publish, or preparation of the manuscript.
Competing interests: The authors have declared
[4]. In recent years FOLFIRINOX and targeted EGFR inhibition by erlotinib combined with gemcitabine showed only modest improvements in response rates and overall survival [5]. A deeper understanding of the biological factors contributing to the treatment response may have the potential to improve these outcomes.
A comprehensive study of death rate trends in pancreatic cancer since 1970 revealed com-plexity of the disease, is largely unexplainable by known risk factors [6]. Currently the only FDA approved biomarker is CA19-9 for the management of pancreatic ductal adenocarci-noma, despite its limitations [7]. AJCC TNM staging and performance status are critical indi-cators of prognosis in clinical practice [8,9]. Although multiple gene expression based prognostic prediction methods have been developed [10–16], no such test is currently used in routine practice and very few of these tests can be used as predictors of response to therapy [17], orin vitro sensitivity to chemotherapeutic agents in cell lines [18]. Therefore there is still much to contribute to the discovery of new risk predictors and new methodologies for prog-nostic assessments that can guide clinical approaches.
In this study we aimed to define a novel panel of prognostic genes for PDAC based onin sil-ico analysis of microarray and RNA sequencing datasets. We thus generated a 20-gene based
risk scoring method, PPS20, which can stratify patients when either overall survival or event-free survival are used as end-point measures. We show that tumors from these two patient groups are biologically distinct: tumors with high PPS20 show a higher proliferation, whereas tumors with low PPS20 have a higher rate of lymphocyte infiltration. By analyzing public cyto-toxicity databases, we find that these two tumor types show differential sensitivity to specific agents.
Methods
Processing public datasets
RNA-sequencing raw counts and clinical data of patients with pancreatic tumors from Inter-national Cancer Genome Consortium Pancreatic Cancer Canadian and Australian (ICGC, PACA-CA and PACA-AU) cohorts were downloaded from ICGC data portal (https://dcc. icgc.org/). Primary tissue was selected as Pancreas and the Specimen Type was selected as “Pri-mary Tumor”. Samples with sequencing based expression data “EXP-S” were downloaded. 156 and 81 patients in PACA-CA and PACA-AU cohorts, respectively, with available survival data were included in the study and raw read counts were downloaded. CPM values for each gene were calculated by the formula: (read count of the gene/total read count of sample)�1000000.
TCGA PAAD RNAseqv2 Level3 RSEM normalized data and clinical data were downloaded from Broad Institute GDAC data portal (http://gdac.broadinstitute.org/). Samples with avail-able overall survival data (n = 178) and event-free survival data (n = 133) were used. Genes which had 0 counts in more than 85% of samples were eliminated from the prognostic analyses in all RNAseq datasets. Mutational data of 150 pancreatic cancer patients within TCGA cohort was obtained fromhttps://www.cbioportal.org/[19]. Sample ‘TCGA-IB-7651-01” was
excluded from chi square analyses since over 80% of the screened genes are altered. RNA-seq based gene counts of 51 pancreatic adenocarcinoma tissues comprising the GSE79668 dataset were downloaded from GEO (https://www.ncbi.nlm.nih.gov/geo/). CPM values were calcu-lated using the same formula used for ICGC cohorts. Log expression was calcucalcu-lated as log (CPM+0.001) values for ICGC CA, ICGC AU and GSE79668 and Log2 (RSEM+0.001) for TCGA PAAD. Raw CEL files of GSE28735 dataset including 45 paired pancreatic tumor and normal tissues were downloaded from GEO and RMA normalized using BRB-array tools developed by Dr. Richard Simon and the BRB-ArrayTools Development Team. Clinical data were extracted from the series matrix file for GSE28735. 42 patients with survival data were
Abbreviations: PDAC, Pancreatic ductal
adenocarcinoma; PPS20, Pancreatic cancer prognostic score 20; ICGC, International Cancer Genome Consortium; PACA-CA, Pancreatic Cancer Canadian; PACA-AU, Pancreatic Cancer Australian; GEO, Gene Expression Omnibus; TCGA, The cancer genome atlas; PAAD, Pancreatic Adenocarcinoma; HR, Hazard ratio; RPKM, Reads per kilo base per million mapped reads; CTRP, Cancer Therapeutic Response Portal; AUC, Area under curve; CCLE, Cancer Cell Line Encyclopedia; GSEA, Gene set enrichment analysis.
included in survival analyses. Series matrix file of GSE21501 (n = 102) and GSE71729 (n = 123) datasets and the annotation files for GPL4133 and GPL20769, respectively, were downloaded from GEO and annotated accordingly. Clinical data was derived from the series matrix file for GSE21501. Patients with survival value “0” were eliminated from survival analy-ses in all datasets.
Survival analyses and prognostic gene ranking
Log expression of all the genes and the corresponding survival data of PACA-CA, PACA-AU, TCGA and GSE21501 datasets were analyzed by an in-house R script utilizing “survival” library [20] and “coxph” functions. For each gene, Cox proportional hazards regression p value and hazard ratio were obtained separately in each dataset. Genes were ranked based on (1) Cox p value- the smaller the p value the smaller the rank, (2) Hazard ratio (HR), the greater the HR the smaller the rank (HRs smaller than 1 were included as 1/HR to make them compa-rable to the HRs above 1), in PACA-CA, PACA-AU, TCGA. Summation of ranks generated “ranksum” which was considered as the criteria for priority sorting genes from the smallest ranksum to the biggest. Stromal score for TCGA PAAD samples were downloaded from (https://bioinformatics.mdanderson.org/estimate/disease.html) under “RNA-Seq-V2” plat-form type. Residual tumor inplat-formation for TCGA PAAD patients were obtained from supple-mentary data of the TCGA PDAC study [21]. Overall survival was used as “days to last follow-up” for censored patients and “days to death” for others, and event-free survival was calculated as “days to new tumor events” for patients with an event, “last follow time” or “days to death” for censored patients in TCGA PAAD. All survival times in days were converted to months via division by 30 for consistency in Kaplan Meier curves. Original survival values (days/months) were used for all datasets in cox regression analyses.
Calculation of the PPS20
Log expression of the 20 genes were used in the following formula for the calculation of the prognostic score. PPS20 = ARNTL2-KANK1+MAP4K4+LDHA+SLC20A1+TRIO-ZNF557+-
EPS8-CBX7+RAB7A-POLR3H+STX16-PITPNA+TFG-CADPS2+ERRFI1+-GSK3B-NDUFB2-C2orf42-MIA3. A PPS20 score was derived by the summation of the log expression of 11 genes related to worse outcome and subtraction of expression values of 9 genes related to favorable outcome. For genes with multiple probesets, their mean expression value was used in PPS20. For GSE28735 the score was calculated without STX16 gene as the gene was absent from the array platform. The median value of PPS20 was used as the cut-off for categorical comparisons generating “high PPS20” and “low PPS20” groups.
Gene set enrichment analysis (GSEA)
All GSEA analyses were run using Broad Institute’s GSEA software (http://www.broad.mit. edu/gsea/) [22]. For TCGA, PACA-CA, PACA-AU and GSE71729, a pre-ranked GSEA, based on the log fold change of the expression of each gene between high PPS20 and low PPS20 groups was performed. C5.all.v6.2.symbols.gmt [Gene Ontology] was used as “Gene sets data-base” for all analyses. Gene sets with less than 50 genes were not included in the analyses.
Drug sensitivity prediction analysis
To find drugs which can target low PPS20 and high PPS20 groups differentially, we used RNA sequencing data-RPKM values- produced by Cancer Cell Line Encyclopedia [23] and drug cytotoxicity data published by Cancer Therapeutic Response Portal (CTRP) [24]. CTRP
dataset contains cytotoxicity data corresponding to 543 drugs screened against 38 pancreatic cancer cell lines, among other cancer cell lines. The parameter used for reporting drug cytotox-icity in this dataset is area under curve (AUC). We restricted our analyses to the compounds which are used in treatments in 16 different concentrations. Additionally not all cell lines were screened against all drugs resulting in missing values for some combinations. So we chose drugs which were screened against at least 10 cell lines (475 drugs).
We calculated PPS20 for all 37 cell lines using CCLE (Cancer Cell Line Encyclopedia) expression data and correlated it with AUC values from CTRP data using Pearson correlation (QGP1 cell line was removed as its gene expression score resulted in highly skewed data and was truly an outlier). The drugs which showed positive correlation with the score are differen-tially effective on high PPS20 group and drugs with negative correlation are effective on low PPS20 group.
Re-evaluation of previously published signatures
Three previously published prognostic gene signatures for PDAC were compared to PPS20. Chen’s signature [11] is a 15 gene signature which we applied to our validation datasets (GSE62452, GSE79668). For GSE79668, staging information, which was available in T, N, and M format, was converted to TNM stage based on AJCC Staging system as a means to better compare all the validation datasets. The platform (Affymetrix Human Gene 1.0 ST Array) that was used in GSE62452, did not contain a probe for CAPN8, a gene that is part of Chen’s Signa-ture [11]. Therefore, when calculating risk scores for Chen’s signature CAPN8 was not consid-ered. The coefficients supplied by the authors were used and median dichotomization was used to determine the high and low risk groups. Yan’s signature [16] includes 4 genes, and the risk groups were calculated as described in the original manuscript. The third signature (Shi et al.) [17] was adapted with an approximation method. Utilizing the TCGA PAAD (Illumina HiseqV2) based outputs of Shi et al., a coefficient was generated for each gene via dividing the cut-off value of the gene that Shi et al. determined in their own article by median expression value of that gene. This coefficient was then used in other datasets to generate each dataset’s specific cut-off values by multiplication of the coefficient by the median of the specific genes. Then each gene was considered absent or present depending on that cut-off value. Absent genes were given the value 0 and present genes 1. Based on this 0–1 matrix and the cut-offs in the TCGA outputs of the paper, Shi et al. risk score was calculated as described [17]. A thresh-old of 1.709 was used to determine high and low risk groups.
Statistical analysis
Kaplan-Meier curves were generated and log-rank tests and Cox regression analyses were per-formed using SPSS Statistics v.19 (IBM, 2010, Chicago, IL, USA). Statistical analyses were done using GraphPad Prism 5.0 (Graphpad Prism 5 Software, San Diego, CA, USA). Student’s t-tests were performed to determine differences between two groups (unpaired and not assuming equal variance-except for GSE28735, for which paired t-test was performed). Chi-squared test with Yates’ continuity correction was performed using “stats” package in R Bioconductor for muta-tional frequency comparisons [25]. P values below 0.05 were considered statistically significant.
Results
PPS20 can predict clinical outcome in pancreatic cancer
To identify individual genes related to prognosis in pancreatic adenocarcinoma we performed cox regression analyses with overall survival as an end-point measure in three discovery
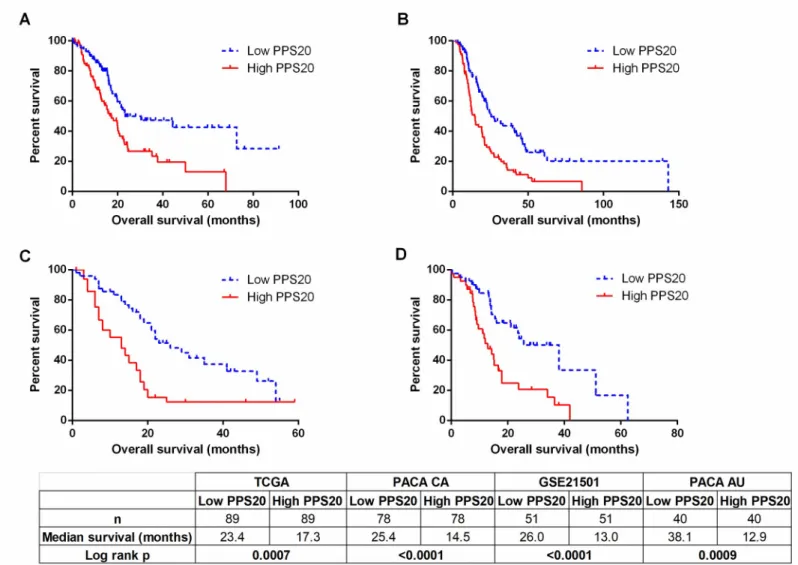
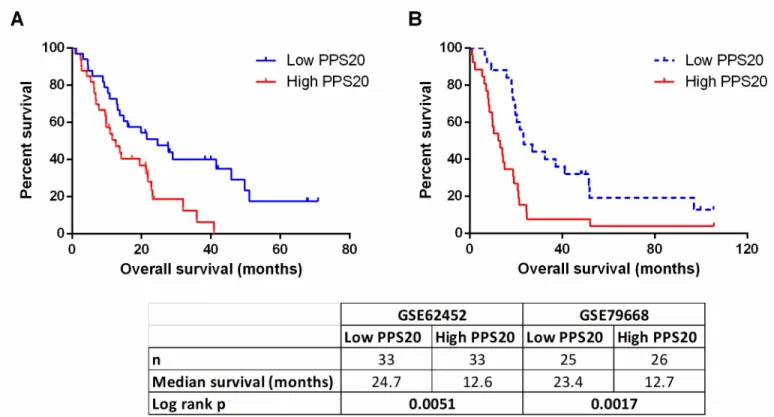
datasets: TCGA, PACA-CA and PACA-AU. Based on resulting HR and p values, we ranked the genes in all three datasets (seeMethods). Among the top 500 genes of each dataset, 85 genes that were common in at least 2 datasets were retested utilizing the GSE21501 dataset in order to restrict the number of genes as well as to further eliminate cohort specific effects. Thus, we identified 11 and 9 genes that were significantly associated with shorter and longer overall survival, respectively (S1 Table). A prognostic scoring system was generated based on log expression of these 20 genes in pancreatic cancer primary tumors (seeMethodsfor details), that we designate “Pancreatic cancer prognostic score 20 –PPS20”. As can be seen inFig 1, PPS20 can stratify the patients into prognostically distinct subgroups with HR (95% CI) and p values of, 2.016 (1.362–3.088) and 0.007, 2.040 (1.498–3.089) and <0.0001, 2.416 (1.696– 4.635) and <0.0001, 2.492 (1.551–5.044) and 0.0009, in TCGA, PACA-CA, GSE21501 and PACA-AU, respectively. PPS20 was then validated in GSE62452 and GSE79668 datasets, with HR (95% CI) and p values of 2.099 (1.335–4.241) and 0.0051, 2.438 (1.486–5.106) and 0.0017, respectively (Fig 2). A MVA that included patients without residual disease after operation and patients who did not receive targeted molecular therapy using the TCGA cohort, showed that PPS20 can predict overall survival independent of confounding factors (S2 Table). We then asked if PPS20 could also stratify patients when event-free survival (EFS) is used as an end-point. Indeed in the TCGA cohort, PPS20 is associated with event-free survival with an HR (95% CI) of 2.312 (1.393–3.982), p value of 0.0015 (Fig 3). Overall, we conclude that, PPS20 is a robust independent prognostic signature for pancreatic cancer.
PPS20 compared to other prognostic signatures
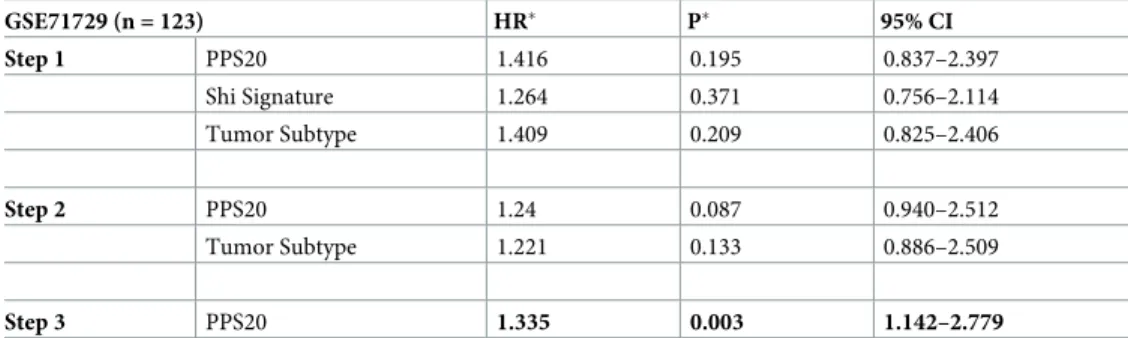
We aimed to assess how our scoring performs when compared to previously published prog-nostic classifiers, Chen et. al.[11], Yan. et. al [16], and Shi et. al. [17]. A multivariate cox regres-sion analysis which included parameters significant by univariate analyses (PPS20, Shi
signature and tumor subtype) identified PPS20 as the only independent prognostic factor in GSE71729 (Tables1and2). Similarly, PPS20 in GSE62452, PPS20 and Shi signature in GSE79668 were the only independent prognostic molecular signatures among the parameters significantly associated with survival in univariate analyses (S3andS4Tables). Therefore,
PPS20 remains significant in all three analyses performed in separate cohorts; indicating it is a superior and independent prognostic classifier of PDAC.
Molecular characteristics of PPS20-identified PDAC sub-groups
In order to understand the biological mechanisms underlying the differences in outcome in PPS20 identified PDAC sub-groups, we performed GSEA (Gene set enrichment analysis) between the high PPS20 and low PPS20 tumors in TCGA, PACA-CA, PACA-AU and GSE71729 datasets. The gene sets with nominal p values below 0.01 and FDR q-values below 0.25 were considered enriched. Among the enriched gene sets in high PPS20 and low PPS20 groups, those common to all four datasets are listed in (S5andS6Tables), representative
enrichment plots are shown in (S1 Fig).
Enrichment of digestion and potassium channel related gene sets in low PPS20 group sup-ports a ’normal like’ phenotype, as pancreas is a ductal organ where digestive enzymes are secreted. Secretion of insulin from pancreatic beta cells is regulated by ATP-sensitive K(+) (K (ATP)) channel dependent pathways [26]. In addition HCO3- secreted by pancreatic ductal epithelial cells to duodenum neutrilizing chyme acidity is transported by multiple ion
exchangers including Na+–K+–Cl– co-transporter (NKCC1) and Na+–K+-pump on the baso-lateral membrane [27]. Therefore the GSEA results suggest that tumors with a more favorable outcome are more differentiated, compared to those with worse outcome. In this line, we
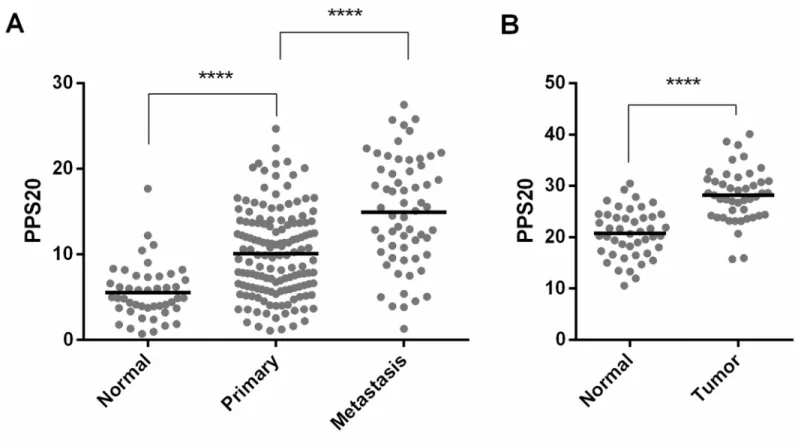
observe that the PPS20 score is lowest in normal pancreas when compared to primary tumors, and most elevated in metastatic tissues (Fig 4). The enrichment of protein activation cascade gene set, which mainly includes complement system proteins, might suggest a relatively higher immune activity in these tumors.
Keratinocyte differentiation, skin development and epidermis development gene sets enriched in the high PPS20 group include many genes belonging to the keratin family, among which KRT16 has been used as a basal cell marker [28,29]; KRT17 has been shown to induce cancer stem cell-like properties in cervical cancer [30] and tumor growth, motility and inva-sion in gastric cancer [31], which is also associated with poor prognosis in breast cancer [32]. Formation of primary germ layer and endoderm gene sets were also enriched in tumors with high PPS20. They include many genes related to extracellular matrix, collagens, laminins, integrins, fibronectin which are known mesenchymal markers [33] and matrix metalloprotei-nases which are involved in tumor growth, invasion and metastasis [34], as well as HMGA2 which is known to maintain oncogenic RAS-induced epithelial-mesenchymal transition (EMT) in pancreatic cancer [35]. These results suggest that high PPS20 tumors have relatively
Fig 1. Prognostic stratification by PPS20 in discovery cohorts. Kaplan Meier graphs based on PPS20 for TCGA (A), PACA-CA (B), GSE21501 (C), PACA-AU (D).
Cut-off for the score is the median in all cohorts. Statistics are given below the figure.
more invasive and mesenchymal properties which is consistent with shorter event-free survival times (Fig 3). The same group has a lower E-cadherin/Fibronectin ratio, in line with the fact that downregulation of E-cadherin and upregulation of Fibronectin are two indicators of EMT [36] (S2 Fig).
In order to understand the immune involvement in the prognostic sub-groups, we analyzed TCGA PAAD tumor RNAseq data using CIBERSORT Absolute mode which enables us to assess involvement of 22 immune cell types in absolute fraction scores [37]. There is a dramati-cally higher “CD8 T cell–T regulatory cell” score in low PPS20 tumor together with lower scores of “Plasma cell-B cell naïve” (S3 Fig). These observations, together with those showing a slight increase of M2 macrophages in low PPS20 tumors are in line with an inhibition of anti-tumor immune responses. High-PPS20 anti-tumors, however, have a larger proportion of M1 mac-rophages (S3 Fig)
The tumor-absolute score-, indicating the overall immune cell content is elevated in low PPS20 tumors (S3 Fig). PD-1 gene expression is significantly higher in the low PPS20 group (S4 Fig), when there is no significant difference in PD-L1 and CTLA-4 among PPS20 low and high groups in the TCGA dataset (S4 Fig).
To evaluate the mutational profile of the PPS20 groups, we utilized TCGA mutational data. Among the genes that have been altered in at least 10 patients, TP53 was the only gene which showed significantly different mutation frequency between PPS20 groups; with 79.3% mutated in high PPS20 and 56.4% mutated in low PPS20 tumors (S7 Fig). A multivariate analyses of PPS20 and TP53 mutation status resulted cox regression outputs of p = 0.02 HR = 1.74 (95% CI: 1.07–2.83) for PPS20 whereas no significance obtained for TP53. Overall these results
Fig 2. Prognostic stratification by PPS20 in validation cohorts. Kaplan Meier graphs based on PPS20 for GSE62452 (A), GSE79668 (B). Cut-off for the score is
median in all cohorts. Statistics are given below the figure.
Fig 3. PPS20 can predict event-free survival. Kaplan Meier graph based on PPS20 in TCGA PAAD tumors. Statistics
are given below the figure.
https://doi.org/10.1371/journal.pone.0231835.g003
Table 1. Univariate analyses.
GSE71729 (n = 123) Nr. HR� P� 95% CI PPS20 High 64 1.781 0.011 1.142–2.779 Low 59 Chen Signature High 64 1.173 0.471 0.760–1.809 Low 59 Shi Signature High 45 1.670 0.024 1.070–2.608 Low 78 Yan Signature High 57 0.841 0.436 0.544–1.300 Low 66 Tumor Subtype Basal (ref) 35 1.831 0.012 1.142–2.936 Classical 88 Stroma Subtype�� Low 17 1.216 0.251 0.871–1.700 Normal 29 Activated 77
�Cox proportional hazards regression performed with overall survival
��Stroma Subtype’s were treated as continuous variables 1: Low, 2: Normal, 3: Activated https://doi.org/10.1371/journal.pone.0231835.t001
indicate that there is no relationship between PPS20 and mutational status except for TP53, and PPS20 can predict prognosis independent of TP53 mutation status.
PPS20 as a predictor of response to targeted therapy
When we stratified TCGA PDAC patient data by PPS20, we observed that high PPS20 patients who received molecular targeted therapy had significantly better prognosis compared to patients who did not receive the same therapy (S5 Fig) while no significant difference was observed in the low PPS20 group, or in case of radiation therapy response (S5 Fig). Unfortu-nately, the specific drug information used in molecular targeted therapy of these patients is not given in TCGA. We also noted that EGFR, RAD51, Cyclin B1 protein level expressions are sig-nificantly higher in high PPS20 patients (S2 Fig), indicating a proliferative activity in this group. Overall, these results show that the PPS20 score can be an identifier of response to molecular targeted therapy in PDAC, especially for high PPS20 patients.
Identification of compounds selectively targeting individual risk groups
In order to identify compounds targeting low PPS20 and high PPS20 groups, the score was applied to CCLE pancreatic cancer cell lines. Pearson correlation analyses between the score and AUC of drugs in CTRP database resulted in the discovery of 40 drugs (S7 Table, most sig-nificant 5 drugs are shown for each group). The most effective drug for the high PPS20 group was BIRB-796, which is a p38 MAPK inhibitor (S6A Fig). Among the drugs that are effective on low PPS20 group, Ouabain was the most significant which is the inhibitor of the Na+/K +-ATPase (S6B Fig). This observation is also in line with our GSEA results showing enrich-ment for potassium ion transport and potassium channel activity.
Discussion
In contrast to other cancer types like colon and breast for which multiple molecular tests are available for risk prediction and/or molecular subtyping, such as PAM50 [38], MammaPrint [39], Oncotype Dx Breast [40], Oncotype Dx Colon [41], there are limited number of molecu-lar signatures defined for prognostication of pancreatic cancer in the literature and none are available to guide clinical therapeutic decisions in practice. A major reason for this is the lack of validation of the present signatures in multiple patient cohorts. As the number of publically available high-throughput transcriptomic data has increased over time, it became possible to include higher number of patient samples/cohorts into biomarker discovery methodologies that enabled identification of more robust biomarkers which are not cohort specific. Using
Table 2. Multivariate analyses (Backward wald).
GSE71729 (n = 123) HR� P� 95% CI Step 1 PPS20 1.416 0.195 0.837–2.397 Shi Signature 1.264 0.371 0.756–2.114 Tumor Subtype 1.409 0.209 0.825–2.406 Step 2 PPS20 1.24 0.087 0.940–2.512 Tumor Subtype 1.221 0.133 0.886–2.509 Step 3 PPS20 1.335 0.003 1.142–2.779
�Cox proportional hazards regression performed with overall survival https://doi.org/10.1371/journal.pone.0231835.t002
this strategy, we previously identified two mRNA based biomarkers, ULBP2 and SEMA5A, for the prognostication of colon cancer [42]; and identified an independent gene panel for predic-tion of prognosis in both diffuse and intestinal type gastric cancer (unpublished data); which shows that the growing transcriptomic data enables discovery of such biomarkers which could have been missed when less patients studied.
Therefore, in this study, we aimed to enlarge the number ofin silico cohorts and used 4
dis-covery and 2 validation PDAC gene expression datasets, including data from RNA sequencing and multiple microarray platforms. Indeed, eighteen of 20 genes identified in this study were not included in previously published prognostic gene signatures; two, ARNTL2 and SLC20A1, were used in Shi et al.[17], and Haider et al.[10], respectively. Our results show the robustness of PPS20 even when different assay platforms are used. Although tumor stage (I-IV), differen-tiation status (poor-moderate-well) and clinical characteristics as such as age and gender var-ied highly among the datasets analyzed, PPS20 could stratify prognostic subgroups
independent of clinical confounding parameters in all cohorts. Indeed these results clearly will be clinically more relevant when validatedex vivo in a large patient cohort.
We compared three different prognostic signatures generated for PDAC to PPS20. We applied these predictive signatures as they were described in their respective publications with modifications as described in the methods section. Two of these (Chen et al (Moffit)[11] & Yan et al[16]) were predictors of overall survival. The third signature that was compared to PPS20 was Shi et al’s signature [17] which predicts recurrence free survival. Although the coef-ficients that were determined from the original study were utilized in determining the cutoff
Fig 4. PPS20 is significantly different between normal, tumor and metastatic tissues. PPS20 in normal (n = 46), primary (n = 145) and metastasic tissues (n = 61) of
GSE71729 (A). PPS20 in 45 paired tumor and normal tissues in GSE28735 (B). Horizontal lines indicate mean. Statistical comparisons were performed with unpaired and paired ttest in A and B, respectivelly.����p<0.0001.
values for different datasets, the expression values of each gene might not be identical to those used in the original publication and this in turn might have caused some genes that would nor-mally be assigned a value of 1 to have a value of 0. Therefore our application of the Shi signa-ture should be considered only an approximation. In summary, although the aforementioned signatures are, in our analyses, not superior to PPS20, they would need to be further validated utilizing identical tumor samples for a conclusive analysis.
The risk groups identified in this study have distinct molecular features. In high PPS20 group, we found increased protein level expression of Cyclin B1, which is a marker of cell pro-liferation and as well as DNA repair [43] which is consistent with increased RAD51 which is involved in double stranded break repair, tumor progression and resistance to anti-cancer treatments [44]. TRIO, SLC20A1, MAP4K4 and ERRF1 genes which are upregulated in high PPS20 patients, were also shown to be involved in cellular proliferation and/or tumor growth [45–48]. EGFR, which is one of the major drivers of cell proliferation [49], was also higher in the high PPS20 group at the protein level. EGFR expression has been detected in 25–90% of the pancreatic adenocarcinomas in different studies and is associated with stage, metastasis, poor differentiation and survival [50].
We find a differential response to molecular targeted therapy, in high PPS20 group. When the patients are first stratified by PPS20, we have showed that high risk patients who were treated with targeted therapy have significantly longer overall survival (Log rank HR: 5.104, p value<0.0001) compared to untreated group, with median survivals of 23 and 6.1 months, respectively. Therefore PPS20 stratification can enable a striking contribution to prediction of targeted therapy success, from an overall survival benefit of 0.33 months to 16.9 months. Over-all, a better prediction of responders to molecular targeted therapy can be achieved whenex vivo validations are performed for PPS20 and when specified agents are known.
E-cadherin/Fibronectin ratio is slightly lower in high risk group, indicating mesenchymal properties, in line with the association of high PPS20 with shorter event-free survival. Consis-tently, EPS8, one of the genes related to worse prognosis in PPS20 which functions as part of the EGFR pathway also regulates actin cytoskeleton and promotes EMT [51,52]. Among the genes associated with shorter survival in PPS20, TRIO, LDHA, MAP4K4 and ARNTL2 con-tribute to cellular motility/invasiveness/tumor aggressiveness and thus can also be contribut-ing to shorter event-free survival [45,48,53,54]. Similarly, LDHA, EPS8, SLC20A1 and ARNTL2 expression are also related to metastasis or shorter survival in pancreatic cancer [10, 17,55,56].
We interpret the dramatically higher “CD8 T cell–T regulatory cell” score in low PPS20 tumors to show the presence of larger amounts of CD8 CTLs in these tumors. The higher scores of “Plasma cell-B cell naïve” in high PPS20 tumors, suggesting a stall in B cell activation, might support an ineffective CTL response in this tumor group. The dominance of M2 macro-phages which are known to inhibit anti-tumor T cell responses [57] in low PPS20 tumors, fur-ther supports this hypothesis. On the ofur-ther hand a larger M1 proportion in high-PPS20 tumors correlates with their mesenchymal phenotype, as inflammatory cytokines pro-duced by M1 macrophages are known to promote EMT [58]. As PD-1 gene expression is sig-nificantly higher in the low PPS20 group, despite the absence of a significant difference in PD-L1 and CTLA-4 among PPS20 low and high groups, these findings cumulatively suggest that PPS20 low tumors might benefit from anti-PDCD therapy.
GSEA results indicate an enrichment of complement system proteins which can promote T cell activation and maturation [59]. Our GSEA analysis also indicated a “normal like”, more differentiated phenotype of low PPS20 tumors with an enrichment of digestion and ion chan-nel transport related gene sets. Among genes upregulated in this group, CBX7, MIA3 and KANK1 have been shown to have tumor suppressive activities including roles in inhibition of
cellular motility/migration and/or proliferation, and induction of cell cycle arrest in various malignancies [60–67]. PITPNA which we found as a good prognostic indicator, is suggested as favorable prognostic marker in pancreatic, endometrial and renal cancers in the Human Pro-tein Atlas (www.proteinatlas.org) [68], and its overexpression was associated with longer sur-vival in PDAC [69]. Human protein atlas also suggests POL3HR and C2ORF42 are favorable prognostic markers in pancreatic cancer.
Via analyzing cell line drug cytotoxicity data we identified a list of compounds which are selectively effective on either low PPS20 or high PPS20 tumors. The most significant associa-tions were with BIRB-796, a p38 MAPK inhibitor for high PPS20 group and quabain which is a Na+/K+ATPase inhibitor for low PPS20 group. The role of p38 MAPK in regulating tumor cells’ proliferation, apoptosis and metastasis has been previously extensively reviewed [70]. Specifically in pancreatic tumors, p38 MAPK expression has been shown to be increased com-pared to normal tissues, and targeting p38α has shown to inhibit pancreatic cancer cell prolif-eration; in addition a higher expression level in tumors was associated with worse overall survival [71]. Another study showed that activation of p38 results in proliferation, invasion, and metastasis of pancreatic cancer cells leading to worse prognosis and its suppression pre-vents the progression of pancreatic cancer [72,73]. Additionally, under hyperglycemic condi-tions, increased 38 MAPK signaling is also responsible for epithelial to mesenchymal
transition of pancreatic cells and upon p38 MAPK inhibition, these cells reverted back to a rel-ative epithelial phenotype and tumor volume was decreased [74]. Increased expression of p38-MAPK has been also related to chemotherapy resistance in human gastric cancer cells [75]. The compound identified by our analysis has previously been shown to inhibit all 4 types of p38 MAPK isoforms bothin vivo and in vitro [76] and has been shown to increase the effi-ciency of other chemotherapeutic agents in drug resistant models [77]. Here in our analysis, we found that BIRB-796 (p38α inhibitor [78]) differentially target high PPS20 group.
In esophageal squamous cell carcinoma, overexpression of Na+/K+ ATPase is associated with severity of the disease and is also reported in medulloblastoma, glioblastoma, melanoma, hepatomas, and non-small-cell lung cancer [79], and in breast cancer, it is reported to increase invasion of endocrine resistant cancer cells [80]. Although Qubain causes Na+/K+ATPase to interact with Src and EGFR, and can actıvate ERK1/2, it also results in growth arrest in human breast cancer cells, possibly by increasing the expression of p53 and p21 [81]. Its antiprolifera-tive effects have been also shown in prostate cancer cells, and in pig kidney epithelial cells [82– 84]. Since our GSEA results showed enrichment of potassium ion transport and potassium channel activity in low PPS20 group, an inhibitor of a Na+/K+ pump can be a potential drug for this group of patients subsequent toin vitro and in vivo validation.
Conclusions
We identified a gene signature composed of 20 prognostic genes (PPS20), and a score gener-ated based on expression of these genes. PPS20 identifies both prognostically and biologically distinct sub-groups among PDAC tumors, and has potential as a predictive marker of response to molecular targeted therapy for PDAC.
Supporting information
S1 Fig. Examples to genesets enriched in low PPS20 and high PPS20 groups in TCGA and PACA CA datasets.
S2 Fig. Proteome analysis of pancreatic tumors in TCGA. Normalized protein expression
values shown for low PPS20 (n = 53) and high PPS20 (n = 70) TCGA PAAD primary tumors. Horizontal lines indicate mean. Unpaired ttest results are given.��p<0.01,�p<0.05.
(TIF)
S3 Fig. CIBERSORT based immune cell content of PPS20 based groups in TCGA. Immune
cell fraction scores were obtained for each tumor sample usinghttps://cibersort.stanford.edu. The samples with a deconvolution p value below 0.05 were included in the analysis. The differ-ences between two immune cell fractions are given for “T cells CD8 and Tregs”, “M1 and M2 macrophages”, and “Plasma cells and naive B cells”. Unpaired ttest results are given.����
p<0.0001,���p<0.001 (TIF)
S4 Fig. Patients with low PPS20 have elevated PD-1 expression. Log transformed RSEM
val-ues plotted for low PPS20 (n = 89) and high PPS20 (n = 89) TCGA PAAD primary tumors. Horizontal lines indicate mean expression. Unpaired ttest was performed.�p<0.05. (TIF)
S5 Fig. High PPS20 group shows a favorable outcome when treated with targeted molecu-lar therapy. Kaplan Meier graphs stratified by PPS20 in TCGA PAAD comparing patients
who received and did not receive radiation therapy and molecular targeted therapy. Statistics are shown below the figure.
(TIF)
S6 Fig. BIRB-796 sensitivity is negatively correlated with PPS20 and can preferentially target
cells with high PPS20 (A). Ouabain shows the opposite pattern (B). (TIF)
S7 Fig. Comparison of mutation frequencies between PPS20 groups in TCGA. The genes
which have been altered in at least 10 patients are shown. Chi-squared test with Yates’ continu-ity correction was performed for each gene (synonymous variants excluded). Blue: No alter-ations, Yellow: Synonymous variants, Red: Nonsynonymous variants.�indicates a p value
smaller than 0.05. (TIF)
S1 Table. Genes involved in PPS20.
(DOCX)
S2 Table. Cox regression analyses of PPS20 and clinicopathological parameters–OS.
(DOCX)
S3 Table. A: Univariate Analyses. B: Multivariate Analyses (Backward Wald).
(DOCX)
S4 Table. A: Univariate Analyses. B: Multivariate Analyses (Backward Wald).
(DOCX)
S5 Table. Gene sets enriched in high PPS20 tumors.
(DOCX)
S6 Table. Gene sets enriched in low PPS20 tumors.
(DOCX)
S7 Table. A: 5 drugs targeting cells with ‘high PPS20’. Negative correlation between PPS20
targeting cells with ‘low PPS20’. Positive correlation between PPS20 and drug cytotoxicity data (AUC) shows drugs targeting ‘low PPS20’ group.
(DOCX)
Author Contributions
Conceptualization: Sec¸il Demirkol Canlı, Ali Osmay Gu¨re.
Data curation: Sec¸il Demirkol Canlı, Ege Dedeoğlu, Muhammad Waqas Akbar, Barış Ku¨c¸u¨kkaraduman.
Formal analysis: Sec¸il Demirkol Canlı, Ege Dedeoğlu, Muhammad Waqas Akbar, Barış Ku¨c¸u¨kkaraduman.
Funding acquisition: Burc¸ak Vural. Investigation: Sec¸il Demirkol Canlı.
Methodology: Sec¸il Demirkol Canlı, Ali Osmay Gu¨re.
Software: Muratİşbilen.
Supervision: Ali Osmay Gu¨re.
Visualization: Sec¸il Demirkol Canlı.
Writing – original draft: Sec¸il Demirkol Canlı, Barış Ku¨c¸u¨kkaraduman, O¨ zge Şu¨kru¨oğlu Erdoğan, Seda Kılıc¸ Erciyas, Hu¨lya Yazıcı, Burc¸ak Vural, Ali Osmay Gu¨re.
Writing – review & editing: Sec¸il Demirkol Canlı, Muhammad Waqas Akbar, Barış Ku¨c¸u¨k-karaduman, O¨ zge Şu¨kru¨oğlu Erdoğan, Seda Kılıc¸ Erciyas, Hu¨lya Yazıcı, Burc¸ak Vural, Ali Osmay Gu¨re.
References
1. Hidalgo M. Pancreatic cancer. N Engl J Med. 2010; 362(17):1605–17. Epub 2010/04/30.https://doi.org/ 10.1056/NEJMra0901557PMID:20427809.
2. Rahib L, Smith BD, Aizenberg R, Rosenzweig AB, Fleshman JM, Matrisian LM. Projecting cancer inci-dence and deaths to 2030: the unexpected burden of thyroid, liver, and pancreas cancers in the United States. Cancer Res. 2014; 74(11):2913–21. Epub 2014/05/21.https://doi.org/10.1158/0008-5472. CAN-14-0155PMID:24840647.
3. Spanknebel K, Conlon KC. Advances in the surgical management of pancreatic cancer. Cancer J. 2001; 7(4):312–23. Epub 2001/09/20. PMID:11561607.
4. Burris HA 3rd, Moore MJ, Andersen J, Green MR, Rothenberg ML, Modiano MR, et al. Improvements in survival and clinical benefit with gemcitabine as first-line therapy for patients with advanced pancreas cancer: a randomized trial. J Clin Oncol. 1997; 15(6):2403–13. Epub 1997/06/01.https://doi.org/10. 1200/JCO.1997.15.6.2403PMID:9196156.
5. Saung MT, Zheng L. Current Standards of Chemotherapy for Pancreatic Cancer. Clin Ther. 2017; 39 (11):2125–34. Epub 2017/09/25.https://doi.org/10.1016/j.clinthera.2017.08.015PMID:28939405; PubMed Central PMCID: PMC5705388.
6. Ma J, Siegel R, Jemal A. Pancreatic cancer death rates by race among US men and women, 1970– 2009. J Natl Cancer Inst. 2013; 105(22):1694–700. Epub 2013/11/10.https://doi.org/10.1093/jnci/ djt292PMID:24203988.
7. Winter JM, Yeo CJ, Brody JR. Diagnostic, prognostic, and predictive biomarkers in pancreatic cancer. J Surg Oncol. 2013; 107(1):15–22. Epub 2012/06/26.https://doi.org/10.1002/jso.23192PMID:
22729569.
8. Allen PJ, Kuk D, Castillo CF, Basturk O, Wolfgang CL, Cameron JL, et al. Multi-institutional Validation Study of the American Joint Commission on Cancer (8th Edition) Changes for T and N Staging in Patients With Pancreatic Adenocarcinoma. Ann Surg. 2017; 265(1):185–91. Epub 2016/05/11.https:// doi.org/10.1097/SLA.0000000000001763PMID:27163957; PubMed Central PMCID: PMC5611666.
9. Le N, Sund M, Vinci A, Pancreas Gcgo. Prognostic and predictive markers in pancreatic adenocarci-noma. Dig Liver Dis. 2016; 48(3):223–30. Epub 2016/01/16.https://doi.org/10.1016/j.dld.2015.11.001 PMID:26769569.
10. Haider S, Wang J, Nagano A, Desai A, Arumugam P, Dumartin L, et al. A multi-gene signature predicts outcome in patients with pancreatic ductal adenocarcinoma. Genome Med. 2014; 6(12):105. Epub 2015/01/15.https://doi.org/10.1186/s13073-014-0105-3PMID:25587357; PubMed Central PMCID: PMC4293116.
11. Chen DT, Davis-Yadley AH, Huang PY, Husain K, Centeno BA, Permuth-Wey J, et al. Prognostic Fif-teen-Gene Signature for Early Stage Pancreatic Ductal Adenocarcinoma. PLoS One. 2015; 10(8): e0133562. Epub 2015/08/08.https://doi.org/10.1371/journal.pone.0133562PMID:26247463; PubMed Central PMCID: PMC4527782.
12. Newhook TE, Blais EM, Lindberg JM, Adair SJ, Xin W, Lee JK, et al. A thirteen-gene expression signa-ture predicts survival of patients with pancreatic cancer and identifies new genes of interest. PLoS One. 2014; 9(9):e105631. Epub 2014/09/03.https://doi.org/10.1371/journal.pone.0105631PMID:25180633; PubMed Central PMCID: PMC4152146.
13. Raman P, Maddipati R, Lim KH, Tozeren A. Pancreatic cancer survival analysis defines a signature that predicts outcome. PLoS One. 2018; 13(8):e0201751. Epub 2018/08/10.https://doi.org/10.1371/journal. pone.0201751PMID:30092011; PubMed Central PMCID: PMC6084949 currently employed by Stoke Therapeutics, his contributions occurred entirely during his time at Drexel University. This does not alter the authors’ adherence to PLOS ONE policies on sharing data and materials.
14. Stratford JK, Bentrem DJ, Anderson JM, Fan C, Volmar KA, Marron JS, et al. A six-gene signature pre-dicts survival of patients with localized pancreatic ductal adenocarcinoma. PLoS Med. 2010; 7(7): e1000307. Epub 2010/07/21.https://doi.org/10.1371/journal.pmed.1000307PMID:20644708; PubMed Central PMCID: PMC2903589.
15. Birnbaum DJ, Finetti P, Lopresti A, Gilabert M, Poizat F, Raoul JL, et al. A 25-gene classifier predicts overall survival in resectable pancreatic cancer. BMC Med. 2017; 15(1):170. Epub 2017/09/21.https:// doi.org/10.1186/s12916-017-0936-zPMID:28927421; PubMed Central PMCID: PMC5606023.
16. Yan X, Wan H, Hao X, Lan T, Li W, Xu L, et al. Importance of gene expression signatures in pancreatic cancer prognosis and the establishment of a prediction model. Cancer Manag Res. 2019; 11:273–83. Epub 2019/01/16.https://doi.org/10.2147/CMAR.S185205PMID:30643453; PubMed Central PMCID: PMC6312063.
17. Shi G, Zhang J, Lu Z, Liu D, Wu Y, Wu P, et al. A novel messenger RNA signature as a prognostic bio-marker for predicting relapse in pancreatic ductal adenocarcinoma. Oncotarget. 2017; 8(67):110849– 60. Epub 2018/01/18.https://doi.org/10.18632/oncotarget.22861PMID:29340021; PubMed Central PMCID: PMC5762289.
18. Kirby MK, Ramaker RC, Gertz J, Davis NS, Johnston BE, Oliver PG, et al. RNA sequencing of pancre-atic adenocarcinoma tumors yields novel expression patterns associated with long-term survival and reveals a role for ANGPTL4. Mol Oncol. 2016; 10(8):1169–82. Epub 2016/06/11.https://doi.org/10. 1016/j.molonc.2016.05.004PMID:27282075; PubMed Central PMCID: PMC5423196.
19. Cerami E, Gao J, Dogrusoz U, Gross BE, Sumer SO, Aksoy BA, et al. The cBio cancer genomics portal: an open platform for exploring multidimensional cancer genomics data. Cancer Discov. 2012; 2(5):401– 4. Epub 2012/05/17.https://doi.org/10.1158/2159-8290.CD-12-0095PMID:22588877; PubMed Cen-tral PMCID: PMC3956037.
20. Therneau T.M. GPM. Modeling Survival Data: Extending the Cox Model. New York: Springer; 2000.
21. Network CGAR. Integrated Genomic Characterization of Pancreatic Ductal Adenocarcinoma. Cancer Cell. 2017; 32(2):185–203 e13. Epub 2017/08/16.https://doi.org/10.1016/j.ccell.2017.07.007PMID: 28810144; PubMed Central PMCID: PMC5964983.
22. Subramanian A, Tamayo P, Mootha VK, Mukherjee S, Ebert BL, Gillette MA, et al. Gene set enrichment analysis: a knowledge-based approach for interpreting genome-wide expression profiles. Proc Natl Acad Sci U S A. 2005; 102(43):15545–50. Epub 2005/10/04.https://doi.org/10.1073/pnas.0506580102 PMID:16199517; PubMed Central PMCID: PMC1239896.
23. Barretina J, Caponigro G, Stransky N, Venkatesan K, Margolin AA, Kim S, et al. The Cancer Cell Line Encyclopedia enables predictive modelling of anticancer drug sensitivity. Nature. 2012; 483
(7391):603–7. Epub 2012/03/31.https://doi.org/10.1038/nature11003PMID:22460905; PubMed Cen-tral PMCID: PMC3320027.
24. Seashore-Ludlow B, Rees MG, Cheah JH, Cokol M, Price EV, Coletti ME, et al. Harnessing Connectiv-ity in a Large-Scale Small-Molecule SensitivConnectiv-ity Dataset. Cancer Discov. 2015; 5(11):1210–23. Epub 2015/10/21.https://doi.org/10.1158/2159-8290.CD-15-0235PMID:26482930; PubMed Central PMCID: PMC4631646.
25. Team RC. R: A language and environment for statistical computing. Vienna, Austria.: R Foundation for Statistical Computing; 2019.
26. MacDonald PE, Wheeler MB. Voltage-dependent K(+) channels in pancreatic beta cells: role, regulation and potential as therapeutic targets. Diabetologia. 2003; 46(8):1046–62. Epub 2003/06/28.https://doi. org/10.1007/s00125-003-1159-8PMID:12830383.
27. Hayashi M, Novak I. Molecular basis of potassium channels in pancreatic duct epithelial cells. Channels (Austin). 2013; 7(6):432–41. Epub 2013/08/22.https://doi.org/10.4161/chan.26100PMID:23962792; PubMed Central PMCID: PMC4042478.
28. Yu KD, Zhu R, Zhan M, Rodriguez AA, Yang W, Wong S, et al. Identification of prognosis-relevant sub-groups in patients with chemoresistant triple-negative breast cancer. Clin Cancer Res. 2013; 19 (10):2723–33. Epub 2013/04/04.https://doi.org/10.1158/1078-0432.CCR-12-2986PMID:23549873; PubMed Central PMCID: PMC3655097.
29. Pirsko V, Cakstina I, Priedite M, Dortane R, Feldmane L, Nakazawa-Miklasevica M, et al. An Effect of Culture Media on Epithelial Differentiation Markers in Breast Cancer Cell Lines MCF7, MDA-MB-436 and SkBr3. Medicina (Kaunas). 2018; 54(2). Epub 2018/10/23.https://doi.org/10.3390/
medicina54020011PMID:30344242; PubMed Central PMCID: PMC6037242.
30. Wu L, Han L, Zhou C, Wei W, Chen X, Yi H, et al. TGF-beta1-induced CK17 enhances cancer stem cell-like properties rather than EMT in promoting cervical cancer metastasis via the ERK1/2-MZF1 sig-naling pathway. FEBS J. 2017; 284(18):3000–17. Epub 2017/07/14.https://doi.org/10.1111/febs.14162 PMID:28703907.
31. Chivu-Economescu M, Dragu DL, Necula LG, Matei L, Enciu AM, Bleotu C, et al. Knockdown of KRT17 by siRNA induces antitumoral effects on gastric cancer cells. Gastric Cancer. 2017; 20(6):948–59. Epub 2017/03/17.https://doi.org/10.1007/s10120-017-0712-yPMID:28299464.
32. Merkin RD, Vanner EA, Romeiser JL, Shroyer ALW, Escobar-Hoyos LF, Li J, et al. Keratin 17 is overex-pressed and predicts poor survival in estrogen receptor-negative/human epidermal growth factor recep-tor-2-negative breast cancer. Hum Pathol. 2017; 62:23–32. Epub 2016/11/07.https://doi.org/10.1016/j. humpath.2016.10.006PMID:27816721.
33. Mani SA, Guo W, Liao MJ, Eaton EN, Ayyanan A, Zhou AY, et al. The epithelial-mesenchymal transition generates cells with properties of stem cells. Cell. 2008; 133(4):704–15. Epub 2008/05/20.https://doi. org/10.1016/j.cell.2008.03.027PMID:18485877; PubMed Central PMCID: PMC2728032.
34. Nabeshima K, Inoue T, Shimao Y, Sameshima T. Matrix metalloproteinases in tumor invasion: role for cell migration. Pathol Int. 2002; 52(4):255–64. Epub 2002/05/29.https://doi.org/10.1046/j.1440-1827. 2002.01343.xPMID:12031080.
35. Watanabe S, Ueda Y, Akaboshi S, Hino Y, Sekita Y, Nakao M. HMGA2 maintains oncogenic RAS-induced epithelial-mesenchymal transition in human pancreatic cancer cells. Am J Pathol. 2009; 174 (3):854–68. Epub 2009/01/31.https://doi.org/10.2353/ajpath.2009.080523PMID:19179606; PubMed Central PMCID: PMC2665746.
36. Lamouille S, Xu J, Derynck R. Molecular mechanisms of epithelial-mesenchymal transition. Nat Rev Mol Cell Biol. 2014; 15(3):178–96. Epub 2014/02/22.https://doi.org/10.1038/nrm3758PMID: 24556840; PubMed Central PMCID: PMC4240281.
37. Newman AM, Liu CL, Green MR, Gentles AJ, Feng W, Xu Y, et al. Robust enumeration of cell subsets from tissue expression profiles. Nat Methods. 2015; 12(5):453–7. Epub 2015/03/31.https://doi.org/10. 1038/nmeth.3337PMID:25822800; PubMed Central PMCID: PMC4739640.
38. Parker JS, Mullins M, Cheang MC, Leung S, Voduc D, Vickery T, et al. Supervised risk predictor of breast cancer based on intrinsic subtypes. J Clin Oncol. 2009; 27(8):1160–7. Epub 2009/02/11.https:// doi.org/10.1200/JCO.2008.18.1370PMID:19204204; PubMed Central PMCID: PMC2667820.
39. van de Vijver MJ, He YD, van’t Veer LJ, Dai H, Hart AA, Voskuil DW, et al. A gene-expression signature as a predictor of survival in breast cancer. N Engl J Med. 2002; 347(25):1999–2009. Epub 2002/12/20. https://doi.org/10.1056/NEJMoa021967PMID:12490681.
40. Paik S, Shak S, Tang G, Kim C, Baker J, Cronin M, et al. A multigene assay to predict recurrence of tamoxifen-treated, node-negative breast cancer. N Engl J Med. 2004; 351(27):2817–26. Epub 2004/12/ 14.https://doi.org/10.1056/NEJMoa041588PMID:15591335.
41. O’Connell MJ, Lavery I, Yothers G, Paik S, Clark-Langone KM, Lopatin M, et al. Relationship between tumor gene expression and recurrence in four independent studies of patients with stage II/III colon can-cer treated with surgery alone or surgery plus adjuvant fluorouracil plus leucovorin. J Clin Oncol. 2010; 28(25):3937–44. Epub 2010/08/04.https://doi.org/10.1200/JCO.2010.28.9538PMID:20679606; PubMed Central PMCID: PMC2940392.
42. Demirkol S, Gomceli I, Isbilen M, Dayanc BE, Tez M, Bostanci EB, et al. A Combined ULBP2 and SEMA5A Expression Signature as a Prognostic and Predictive Biomarker for Colon Cancer. J Cancer.
2017; 8(7):1113–22. Epub 2017/06/14.https://doi.org/10.7150/jca.17872PMID:28607584; PubMed Central PMCID: PMC5463424.
43. Schnittger A, De Veylder L. The Dual Face of Cyclin B1. Trends Plant Sci. 2018; 23(6):475–8. Epub 2018/04/24.https://doi.org/10.1016/j.tplants.2018.03.015PMID:29680634.
44. Chen Q, Cai D, Li M, Wu X. The homologous recombination protein RAD51 is a promising therapeutic target for cervical carcinoma. Oncol Rep. 2017; 38(2):767–74. Epub 2017/06/20.https://doi.org/10. 3892/or.2017.5724PMID:28627709; PubMed Central PMCID: PMC5561999.
45. Debant A, Serra-Pages C, Seipel K, O’Brien S, Tang M, Park SH, et al. The multidomain protein Trio binds the LAR transmembrane tyrosine phosphatase, contains a protein kinase domain, and has sepa-rate rac-specific and rho-specific guanine nucleotide exchange factor domains. Proc Natl Acad Sci U S A. 1996; 93(11):5466–71. Epub 1996/05/28.https://doi.org/10.1073/pnas.93.11.5466PMID:8643598; PubMed Central PMCID: PMC39269.
46. Beck L, Leroy C, Salaun C, Margall-Ducos G, Desdouets C, Friedlander G. Identification of a novel function of PiT1 critical for cell proliferation and independent of its phosphate transport activity. J Biol Chem. 2009; 284(45):31363–74. Epub 2009/09/04.https://doi.org/10.1074/jbc.M109.053132PMID: 19726692; PubMed Central PMCID: PMC2781533.
47. Cairns J, Fridley BL, Jenkins GD, Zhuang Y, Yu J, Wang L. Differential roles of ERRFI1 in EGFR and AKT pathway regulation affect cancer proliferation. EMBO Rep. 2018; 19(3). Epub 2018/01/18.https:// doi.org/10.15252/embr.201744767PMID:29335246; PubMed Central PMCID: PMC5835844.
48. Zhao G, Wang B, Liu Y, Zhang JG, Deng SC, Qin Q, et al. miRNA-141, downregulated in pancreatic cancer, inhibits cell proliferation and invasion by directly targeting MAP4K4. Mol Cancer Ther. 2013; 12 (11):2569–80. Epub 2013/09/10.https://doi.org/10.1158/1535-7163.MCT-13-0296PMID:24013097.
49. Wee P, Wang Z. Epidermal Growth Factor Receptor Cell Proliferation Signaling Pathways. Cancers (Basel). 2017; 9(5). Epub 2017/05/18.https://doi.org/10.3390/cancers9050052PMID:28513565; PubMed Central PMCID: PMC5447962.
50. Guo M, Luo G, Liu C, Cheng H, Lu Y, Jin K, et al. The Prognostic and Predictive Role of Epidermal Growth Factor Receptor in Surgical Resected Pancreatic Cancer. Int J Mol Sci. 2016; 17(7). Epub 2016/07/12.https://doi.org/10.3390/ijms17071090PMID:27399694; PubMed Central PMCID: PMC4964466.
51. Innocenti M, Frittoli E, Ponzanelli I, Falck JR, Brachmann SM, Di Fiore PP, et al. Phosphoinositide 3-kinase activates Rac by entering in a complex with Eps8, Abi1, and Sos-1. J Cell Biol. 2003; 160(1):17– 23. Epub 2003/01/08.https://doi.org/10.1083/jcb.200206079PMID:12515821; PubMed Central PMCID: PMC2172734.
52. Fang D, Chen H, Zhu JY, Wang W, Teng Y, Ding HF, et al. Epithelial-mesenchymal transition of ovarian cancer cells is sustained by Rac1 through simultaneous activation of MEK1/2 and Src signaling path-ways. Oncogene. 2017; 36(11):1546–58. Epub 2016/09/13.https://doi.org/10.1038/onc.2016.323 PMID:27617576; PubMed Central PMCID: PMC5346482.
53. Im DK, Cheong H, Lee JS, Oh MK, Yang KM. Protein kinase CK2-dependent aerobic glycolysis-induced lactate dehydrogenase A enhances the migration and invasion of cancer cells. Sci Rep. 2019; 9(1):5337. Epub 2019/03/31.https://doi.org/10.1038/s41598-019-41852-4PMID:30926903; PubMed Central PMCID: PMC6441004.
54. Mazzoccoli G, Pazienza V, Panza A, Valvano MR, Benegiamo G, Vinciguerra M, et al. ARNTL2 and SERPINE1: potential biomarkers for tumor aggressiveness in colorectal cancer. J Cancer Res Clin Oncol. 2012; 138(3):501–11. Epub 2011/12/27.https://doi.org/10.1007/s00432-011-1126-6PMID: 22198637.
55. Ohshima K, Hatakeyama K, Kanto K, Ide T, Watanabe Y, Moromizato S, et al. Comparative proteomic analysis identifies exosomal Eps8 protein as a potential metastatic biomarker for pancreatic cancer. Oncol Rep. 2019; 41(2):1019–34. Epub 2018/11/16.https://doi.org/10.3892/or.2018.6869PMID: 30431134.
56. Fukuhisa H, Seki N, Idichi T, Kurahara H, Yamada Y, Toda H, et al. Gene regulation by antitumor miR-130b-5p in pancreatic ductal adenocarcinoma: the clinical significance of oncogenic EPS8. J Hum Genet. 2019; 64(6):521–34. Epub 2019/03/13.https://doi.org/10.1038/s10038-019-0584-6PMID: 30858505.
57. Lee KY. M1 and M2 polarization of macrophages: a mini-review. Med Biol Sci Eng. 2019; 2(1):1–5. Epub 2019/01/31.https://doi.org/10.30579/mbse.2019.2.1.1
58. Bednarczyk RB, Tuli NY, Hanly EK, Rahoma GB, Maniyar R, Mittelman A, et al. Macrophage inflamma-tory factors promote epithelial-mesenchymal transition in breast cancer. Oncotarget. 2018; 9
(36):24272–82. Epub 2018/06/01.https://doi.org/10.18632/oncotarget.24917PMID:29849939; PubMed Central PMCID: PMC5966261.
59. Kwan WH, van der Touw W, Heeger PS. Complement regulation of T cell immunity. Immunol Res. 2012; 54(1–3):247–53. Epub 2012/04/06.https://doi.org/10.1007/s12026-012-8327-1PMID: 22477527; PubMed Central PMCID: PMC4081859.
60. Pallante P, Sepe R, Federico A, Forzati F, Bianco M, Fusco A. CBX7 modulates the expression of genes critical for cancer progression. PLoS One. 2014; 9(5):e98295. Epub 2014/05/29.https://doi.org/ 10.1371/journal.pone.0098295PMID:24865347; PubMed Central PMCID: PMC4035280.
61. Nawaz Z, Patil V, Arora A, Hegde AS, Arivazhagan A, Santosh V, et al. Cbx7 is epigenetically silenced in glioblastoma and inhibits cell migration by targeting YAP/TAZ-dependent transcription. Sci Rep. 2016; 6:27753. Epub 2016/06/14.https://doi.org/10.1038/srep27753PMID:27291091; PubMed Cen-tral PMCID: PMC4904208.
62. Peng X, Guan L, Gao B. miRNA-19 promotes non-small-cell lung cancer cell proliferation via inhibiting CBX7 expression. Onco Targets Ther. 2018; 11:8865–74. Epub 2018/12/26.https://doi.org/10.2147/ OTT.S181433PMID:30584339; PubMed Central PMCID: PMC6290863.
63. Bao Z, Xu X, Liu Y, Chao H, Lin C, Li Z, et al. CBX7 negatively regulates migration and invasion in gli-oma via Wnt/beta-catenin pathway inactivation. Oncotarget. 2017; 8(24):39048–63. Epub 2017/04/08. https://doi.org/10.18632/oncotarget.16587PMID:28388562; PubMed Central PMCID: PMC5503594.
64. Yu T, Wu Y, Hu Q, Zhang J, Nie E, Wu W, et al. CBX7 is a glioma prognostic marker and induces G1/S arrest via the silencing of CCNE1. Oncotarget. 2017; 8(16):26637–47. Epub 2017/05/04.https://doi. org/10.18632/oncotarget.15789PMID:28460453; PubMed Central PMCID: PMC5432285.
65. Gao H, Cong X, Zhou J, Guan M. MicroRNA-222 influences migration and invasion through MIA3 in colorectal cancer. Cancer Cell Int. 2017; 17:78. Epub 2017/09/01. https://doi.org/10.1186/s12935-017-0447-1PMID:28855850; PubMed Central PMCID: PMC5576312.
66. Arndt S, Bosserhoff AK. Reduced expression of TANGO in colon and hepatocellular carcinomas. Oncol Rep. 2007; 18(4):885–91. Epub 2007/09/06. PMID:17786351.
67. Kakinuma N, Roy BC, Zhu Y, Wang Y, Kiyama R. Kank regulates RhoA-dependent formation of actin stress fibers and cell migration via 14-3-3 in PI3K-Akt signaling. J Cell Biol. 2008; 181(3):537–49. Epub 2008/05/07.https://doi.org/10.1083/jcb.200707022PMID:18458160; PubMed Central PMCID: PMC2364698.
68. Uhlen M, Zhang C, Lee S, Sjostedt E, Fagerberg L, Bidkhori G, et al. A pathology atlas of the human cancer transcriptome. Science. 2017; 357(6352). Epub 2017/08/19.https://doi.org/10.1126/science. aan2507PMID:28818916.
69. Birnbaum DJ, Bertucci F, Finetti P, Adelaide J, Giovannini M, Turrini O, et al. Expression of Genes with Copy Number Alterations and Survival of Patients with Pancreatic Adenocarcinoma. Cancer Genomics Proteomics. 2016; 13(3):191–200. Epub 2016/04/24. PMID:27107061.
70. Wagner EF, Nebreda AR. Signal integration by JNK and p38 MAPK pathways in cancer development. Nat Rev Cancer. 2009; 9(8):537–49. Epub 2009/07/25.https://doi.org/10.1038/nrc2694PMID: 19629069.
71. Yang L, Sun X, Ye Y, Lu Y, Zuo J, Liu W, et al. p38alpha Mitogen-Activated Protein Kinase Is a Drug-gable Target in Pancreatic Adenocarcinoma. Front Oncol. 2019; 9:1294. Epub 2019/12/13.https://doi. org/10.3389/fonc.2019.01294PMID:31828036; PubMed Central PMCID: PMC6890821.
72. Chen J, Zhao T, Jia S, Zhou S, Zhou L, Wang S, et al. High Expression of P38αand Preoperative Car-bohydrate Antigen 19–9 Indicate Poor Prognosis in Patients with Pancreatic Ductal Adenocarcinoma. Journal of Cancer. 2018; 9(4):650.https://doi.org/10.7150/jca.21683PMID:29556322
73. Handra-Luca A, Lesty C, Hammel P, Sauvanet A, Rebours V, Martin A, et al. Biological and prognostic relevance of mitogen-activated protein kinases in pancreatic adenocarcinoma. Pancreas. 2012; 41 (3):416–21.https://doi.org/10.1097/MPA.0b013e318238379dPMID:22158075
74. Wang L, Bai YY, Yang Y, Hu F, Wang Y, Yu Z, et al. Diabetes mellitus stimulates pancreatic cancer growth and epithelial-mesenchymal transition-mediated metastasis via a p38 MAPK pathway. Oncotar-get. 2016; 7(25):38539–50. Epub 2016/10/23.https://doi.org/10.18632/oncotarget.9533PMID: 27413117; PubMed Central PMCID: PMC5122409.
75. Guo X, Ma N, Wang J, Song J, Bu X, Cheng Y, et al. Increased p38-MAPK is responsible for chemother-apy resistance in human gastric cancer cells. BMC cancer. 2008; 8(1):375.
76. Kuma Y, Sabio G, Bain J, Shpiro N, Ma´rquez R, Cuenda A. BIRB796 inhibits all p38 MAPK isoforms in vitro and in vivo. Journal of Biological Chemistry. 2005; 280(20):19472–9.https://doi.org/10.1074/jbc. M414221200PMID:15755732
77. He D, Zhao X-q, Chen X-g, Fang Y, Singh S, Talele TT, et al. BIRB796, the inhibitor of p38 mitogen-acti-vated protein kinase, enhances the efficacy of chemotherapeutic agents in ABCB1 overexpression cells. PloS one. 2013; 8(1):e54181.https://doi.org/10.1371/journal.pone.0054181PMID:23349819
78. Pargellis C, Tong L, Churchill L, Cirillo PF, Gilmore T, Graham AG, et al. Inhibition of p38 MAP kinase by utilizing a novel allosteric binding site. Nat Struct Biol. 2002; 9(4):268–72. Epub 2002/03/16.https:// doi.org/10.1038/nsb770PMID:11896401.
79. Wu I-C, Chen Y-K, Wu C-C, Cheng Y-J, Chen W-C, Ko H-J, et al. Overexpression of ATPase Na+/K+ transporting alpha 1 polypeptide, ATP1A1, correlates with clinical diagnosis and progression of esoph-ageal squamous cell carcinoma. Oncotarget. 2016; 7(51):85244.https://doi.org/10.18632/oncotarget. 13267PMID:27845894
80. Khajah MA, Mathew PM, Luqmani YA. Na+/K+ ATPase activity promotes invasion of endocrine resis-tant breast cancer cells. PloS one. 2018; 13(3):e0193779.https://doi.org/10.1371/journal.pone. 0193779PMID:29590154
81. Kometiani P, Liu L, Askari A. Digitalis-induced signaling by Na+/K+-ATPase in human breast cancer cells. Mol Pharmacol. 2005; 67(3):929–36. Epub 2004/12/17.https://doi.org/10.1124/mol.104.007302 PMID:15602003.
82. Huang YT, Chueh SC, Teng CM, Guh JH. Investigation of ouabain-induced anticancer effect in human androgen-independent prostate cancer PC-3 cells. Biochem Pharmacol. 2004; 67(4):727–33. Epub 2004/02/06.https://doi.org/10.1016/j.bcp.2003.10.013PMID:14757172.
83. Yeh JY, Huang WJ, Kan SF, Wang PS. Inhibitory effects of digitalis on the proliferation of androgen dependent and independent prostate cancer cells. J Urol. 2001; 166(5):1937–42. Epub 2001/10/05. PMID:11586264.
84. Tian J, Li X, Liang M, Liu L, Xie JX, Ye Q, et al. Changes in sodium pump expression dictate the effects of ouabain on cell growth. J Biol Chem. 2009; 284(22):14921–9. Epub 2009/03/31.https://doi.org/10. 1074/jbc.M808355200PMID:19329430; PubMed Central PMCID: PMC2685674.