Ž .
Journal of Non-Crystalline Solids 227–230 1998 1142–1145
Alteration of spontaneous emission in hydrogenated amorphous
silicon nitride microcavities
Ali Serpenguzel
), Atilla Aydinli, Alpan Bek
¨
Bilkent UniÕersity, Physics Department, Bilkent, Ankara 06533, Turkey
Abstract
A Fabry–Perot microcavity is used for the alteration of the spontaneous emission spectrum in hydrogenated amorphous silicon nitride. The modified photon density of states of the Fabry–Perot microcavity are responsible for the alteration of the spontaneous emission spectrum. The Fabry–Perot microcavity enhances the intensity of the spontaneous emission signal by a factor of 4 at the photon energies corresponding to the microcavity resonances. The 0.075 eV wide spontaneous emission linewidth of the Fabry–Perot microcavity resonances is 7 times smaller than the 0.5 eV wide spontaneous emission linewidth of the bulk hydrogenated amorphous silicon nitride. q 1998 Elsevier Science B.V. All rights reserved.
PACS: 71.23.Cq; 73.61.Jc; 78.66.Jg; 78.55.-m; 78.30.-j
Keywords: Fabry–Perot microcavity; Spontaneous emission spectrum; Hydrogenated amorphous silicon nitride
1. Introduction
There has been a lot of progress made in the study
Ž .
of the modification of the spontaneous emission SE w x in planar microcavities in a number of organic 1
w x
and inorganic 2 semiconductors. In a planar micro-cavity, electromagnetic and quantum electrodynamic effects occur. First, the microcavity acts as an optical resonator for photons with specific energies, which after one round trip, return to their starting position in phase. Second, the SE cross-sections at the micro-cavity resonance photon energies are larger than the bulk SE cross-sections because of the modified
pho-w x
ton density of states of the microcavity 3 . For the
)
Corresponding author. Tel.: q90-312 266 4000 ext. 1965; fax: q90-312 266 4579; e-mail: [email protected].
same reason, the SE cross-sections in between the cavity resonances are smaller than the bulk SE cross-sections. In a planar microcavity, the photon states are the cavity resonances, while for bulk sam-ples, the photon states are the continuum modes of
w x
an infinite system 4,5 . Planar microcavity effects w x
on the SE of porous silicon 6 , and SirSiO super-x w x
lattices 7 have been reported.
There is a great deal of interest in silicon as a potential optoelectronic material. With modern pro-cess techniques, it will be possible to integrate lasers, photodetectors and waveguides on optoelectronic sil-icon motherboards. Hydrogenated amorphous silsil-icon Ža-Si:H has been used for the realization of planar.
w x
waveguides, 8,9 which will be able to route optical signals within such silicon motherboards. a-Si:H can be deposited by plasma-enhanced chemical vapor
Ž .
deposition PECVD on almost any substrate at
tem-0022-3093r98r$19.00 q 1998 Elsevier Science B.V. All rights reserved.
Ž .
( )
A. Serpenguzel et al.r Journal of Non-Crystalline Solids 227–230 1998 1142–1145¨ 1143
peratures below 500 K, which makes it compatible w x
with the microelectronic technology. a-Si:H 10 ,
w x
porous silicon 11 , and other silicon based materials w12 also exhibit high external quantum efficiencyx electroluminescence and photoluminescence at room temperature. These properties make silicon-based materials potential candidates for novel optical gain media.
Recently, we have observed visible SE from
a-Ž .
Si:H, as well as its oxides and nitrides a-SiN :Hx
w x
grown by low temperature PECVD. 13,14 . In this paper, we report the alteration of the SE in an a-SiN :H Fabry–Perot microcavity.x
2. Experimental procedures
In our samples, the planar microcavity was
real-Ž .
ized by a gold Au back mirror and an a-SiN :H-airx interface front mirror. First, the thin glass substrates were coated with Au. Second, a thin layer of
a-SiN :H was deposited on the Au coated substratesx
by PECVD at 373 K with a gaseous mixture of 98%
N2 and 2% SiH . The flow rate of the gaseous4
Ž .
mixture was 180 sccm, the radio frequency RF power 10 W, and the deposition chamber pressure 1
Ž .
Torr. The metric thickness L of the a-SiN :H layerx was measured with a surface texture analysis system ŽVeeco Dektak 3030 ST to be 1.40 " 0.05 mm. For. reference, another microcavity without the Au back mirror was also fabricated by depositing only a-SiN :H on the glass substrates. Hereafter, the micro-x cavity with the Au back mirror will be referred as
Ž .
the metallic microcavity MM , while the reference microcavity without the Au back mirror will be
Ž .
referred to as the dielectric microcavity DM . The SE spectra were measured with a 1-m double
Ž .
spectrometer Jobin–Yvon U1000 with a resolution of 0.001 eV and whose exit slit was equipped with a
Ž .
GaAs photomultiplier tube PMT . The SE spectra were later corrected for the responsivity of the spec-trometer and the photomultiplier tube. An Arq
laser with a photon energy of 2.41 eV and a power of 420 mW was focused with a 15-cm focal length cylindri-cal lens on the samples. The SE spectra were taken at 08 with the laser at 308 with respect to the surface normal. The reflectance spectra were measured at 08 with respect to the surface normal using a Varian
Cary 5 spectrophotometer with a resolution of 0.01 eV.
While the exact mechanism of the occurrence of the SE in bulk a-SiN :H is still under discussion, wex
w x
have suggested in Ref. 14 the use of the quantum w x
confinement model 15 . There, it was proposed that our samples consist of small a-Si clusters in a matrix
of a-SiN :H. The regions with Si–H and Si–N,x
having larger energy gaps due to strong Si–H and Si–N bonds, isolate these a-Si clusters, and form barrier regions around them. The SE originates from these a-Si clusters.
3. Results
The reflectance and SE spectra show Fabry–Perot
Ž .
resonances at photon energies Em satisfying the
microcavity resonance condition:
hcm
E sm ,
Ž .
12 Ln
where h is the Planck constant, c the speed of light,
m the quantized mode number, L the metric
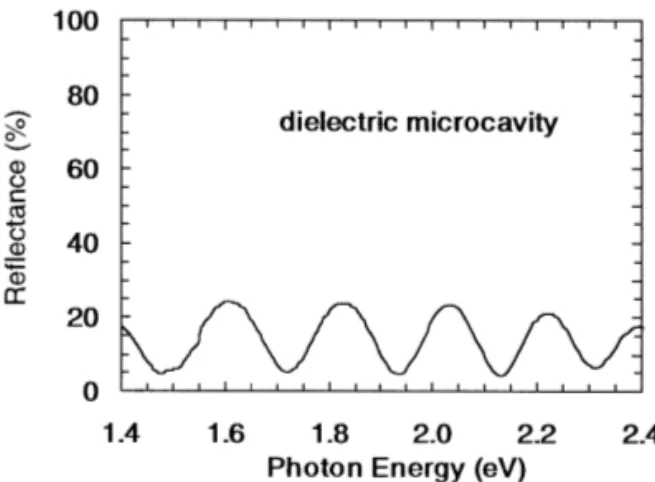
thick-ness, and n the refractive index of the microcavity. Fig. 1 shows the experimentally measured re-flectance spectrum of the DM. The metric thickness of the DM is found to be L s 1.376 mm from the spacing of the reflectance dips, which correspond to the Fabry–Perot resonances. This value agrees well with the measured thickness of 1.40 " 0.05 mm for a refractive index value of n s 2.1. The mode numbers of the Fabry Perot resonances were found to range
( )
A. Serpenguzel et al.r Journal of Non-Crystalline Solids 227–230 1998 1142–1145¨
1144
Fig. 2. Reflectance spectrum of the metallic microcavity.
Ž . Ž
from m s 7 E s 1.49 eV to m s 11 E s 2.317 11
.
eV . These Fabry–Perot resonances have quality fac-tors of Q s 20. The decrease of the reflectance towards higher photon energies is due to the absorp-tion of the a-SiN :H.x
Fig. 2 depicts the reflectance spectrum of the MM. The metric thickness of the MM was found to be L s 1.438 mm from the spacing of the reflectance dips, which correspond to the Fabry–Perot reso-nances. This value agrees well with the experimental thickness of 1.40 " 0.05 mm for a refractive index of
n s 2.1. The Fabry–Perot resonances have a quality
factor of Q s 30. The mode numbers of these reso-Ž
nances were found to range from m s 7 E s 1.427
. Ž .
eV to m s 11 E s 2.26 eV . The decrease of the11
reflectance towards higher photon energies is due to
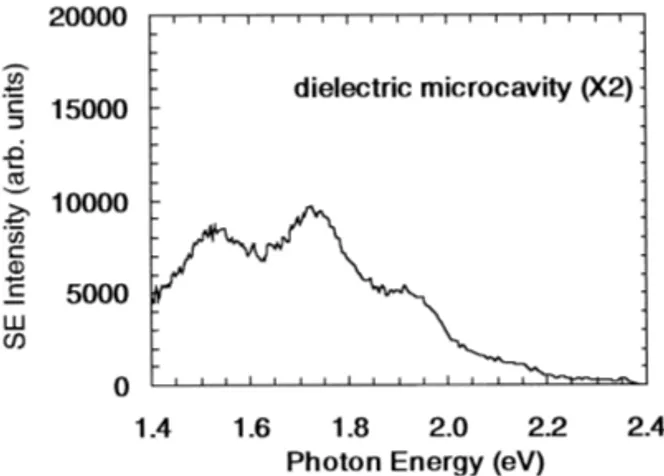
Fig. 3. Spontaneous emission spectrum of the dielectric microcav-ity.
Fig. 4. Spontaneous emission spectrum of the metallic microcav-ity.
the absorption of the a-SiN :H and the Au backx
mirror.
Fig. 3 shows the SE spectrum of the DM. The SE is modulated by the weak Fabry–Perot resonances, which correlate well with the reflectance minima of Fig. 1. Above E s 2 eV, the resonances start to wash out by the absorption of the a-SiN :H. The loadingx of the resonances by the a-SiN :H absorption stopsx below E s 2 eV.
The SE of a-SiN :H has a broad linewidthx
ŽFWHM s 0.5 eV and an external peak efficiency.
of 3%, both of which correlate well with the values w x
measured for a-Si:H 16 . While the external SE peak efficiency of a-SiN :H is 3 times lower than that ofx
Ž . Ž
GaAs 10% , the linewidth of a-SiN :H FWHM sx
.
0.5 eV is 5 times greater than the linewidth of GaAs
ŽFWHM s 0.1 eV . The external SE efficiency and.
linewidth of the a-SiN :H show that, a-SiN :H hasx x potential as a novel photonic material.
Fig. 4 shows the SE spectrum of the MM. The SE is modulated by the strong Fabry–Perot resonances, which correlate well with the reflectance minima of Fig. 2. Above E s 2 eV, the resonances start to wash out by the absorption of the a-SiN :H and Au. Thex
loading of the resonances by the a-SiN :H and Aux
absorption stops below E s 2 eV.
4. Discussion
The two SE spectra of Figs. 3 and 4 were ob-tained under the same experimental conditions. The
( )
A. Serpenguzel et al.r Journal of Non-Crystalline Solids 227–230 1998 1142–1145¨ 1145
SE spectrum of the DM in Fig. 3 was multiplied by a factor of 2, in order to compare it with the SE spectrum of the MM in Fig. 4. When comparing the spectra in Figs. 3 and 4, the SE of the MM has several noteworthy features with respect to the SE of
Ž .
the DM: 1 there is a 2.2 times increase of the Ž
overall spectrum average i.e., averaging out the
. Ž .
Fabry–Perot resonances , 2 there is a 4 times en-Ž .
hancement of the SE peaks, and 3 the SE dips have similar amplitude in the unmultiplied spectra.
The Au mirror reflects the SE light that would otherwise be lost from the back surface and increases the SE by a factor of 2. The reflection of the excitation laser from the Au mirror also increases the SE by a factor of 1.2, since the metric thickness
1.438 mm of the MM is shorter than the a-SiN :Hx
Ž
absorption depth of 2 mm corresponding to the
y1.
measured absorption coefficient of 0.5 mm at the
Arq
laser photon energy. Therefore, the expected increase of the overall spectrum average is 2.4, which is the multiplication of both factors and com-parable with the measured value of 2.2. The 4 times enhancement at the resonances, is due to the com-bined effect of the enhancement of the SE by the resonances with that of the SE and the laser light reflecting from the Au mirror. The SE dips having the same amplitude in both spectra is due to the inhibition of the SE in between the resonances.
5. Conclusions
In conclusion, a planar microcavity is used for the alteration of SE in a-SiN :H. The alteration of thex SE is understood by the microcavity modified pho-ton density of states. The microcavity with a Au back mirror enhances the SE signal by a factor of 4 at the resonant photon energies. The SE linewidth Ž0.075 eV of the microcavity resonances is 7 times.
Ž .
smaller than the SE linewidth 0.5 eV of the
a-SiN :H. The microcavity alteration of the SE inx
a-SiN :H opens up the way for a novel generation ofx resonant cavity enhanced optoelectronic light emit-ting devices.
Acknowledgements
We would like to thank M. Gure for his help with
¨
the growth of the samples. We would like to ac-knowledge the support of this research by the Scien-tific and Technical Research Council of Turkey Grants TBAG-1368 and 1244 and the International
Center for Theoretical Physics Grant 95-500
RGrPHYSrAS.
References
w x1 A. Dodabalapur, L.J. Rothberg, R.H. Jordan, T.M. Miller, Ž .
R.E. Slusher, J.M. Phillips, J. Appl. Phys. 80 1996 6954.
w x2 H. Yokoyama, Science 256 1992 66.Ž . w x3 E.M. Purcell, Phys. Rev. 69 1946 681.Ž .
w x4 F. De Martini, G. Innocenti, G.R. Jacobowitz, P. Mataloni, Ž .
Phys. Rev. Lett. 59 1987 2955.
w x5 H. Yokoyama, K. Nishi, T. Anan, H. Yamada, S.D. Brorson, Ž .
E.P. Ippen, Appl. Phys. Lett. 57 1990 2814.
w x6 L. Pavesi, R. Guardini, C. Mazolleni, Solid State Commun. Ž .
97 1996 1051.
w x7 B.T. Sullivan, D.J. Lockwood, H.J. Labbe, Z.-H. Lu, Appl. Ž .
Phys. Lett. 69 1996 3149.
w x8 A.M. Agarwal, L. Liao, J.S. Foresi, M.R. Black, X. Duan, Ž .
L.C. Kimerling, J. Appl. Phys. 80 1996 6120.
w x9 G. Cocorullo, F.G. Della Corte, I. Rendina, C. Minarini, A. Ž .
Rubino, E. Terzini, Opt. Lett. 21 1996 2002.
w10 D.J. Lockwood, Solid State Commun. 92 1994 101.x Ž . w11 T. Canham, Appl. Phys. Lett. 57 1990 1046.x Ž .
w12 W.B. Pollard, G. Lucovsky, Phys. Rev. B 26 1982 3172.x Ž . w13 F.N. Timofeev, A. Aydinli, R. Ellialtioglu, K. Turkoglu, M.x ¨
Gure, V.N. Mikhailov, O.A. Lavrova, Solid State Commun.¨
Ž .
95 1995 443.
w14 A. Aydinli, A. Serpenguzel, D. Vardar, Solid State Commun.x ¨ Ž .
98 1996 273.
w15 M.H. Brodsky, Solid State Commun. 36 1980 55.x Ž . w16 G.A.N. Connell, in: M.H. Brodsky Ed. , Amorphous Semi-x Ž .