Designing a Competitive Electric Vehicle Charging
Station with Solar PV and Storage
Ilhami COLAK
Istanbul Gelisim University, Istanbul, Turkey [email protected]
Eklas HOSSAIN
University of Wisconsin Milwaukee, USA
[email protected]
Ramazan BAYINDIR; Ahmet AKSOZ
Gazi University, Ankara-Turkey [email protected]; [email protected]Sabri SAYILGAN
Turkish Aerospace Industry (TAI) Ankara-Turkey
[email protected]
Abstract— An electrical vehicle charging station is a charging power supply for electrical vehicles. This paper proposes design of a model for a PV based electrical vehicle that forecasts total power output under particular conditions of Ankara city. First PV cell parameters are determined and then PV array formed including cells designed in order to calculate cumulative effect. Using actual irradiation and temperature values we try to catch an approximation of output power for the future needs.
Keywords—Electric vehicles, Charging station, Green energy.
I. INTRODUCTION
In the last decade two fundamental issues emerged in terms of energy throughout the world. The first one is running out of limited petroleum in the near future and the other one is carbon emission result in global warming. Many countries currently rely heavily on coal, oil, and natural gas for its energy. Fossil fuels are non-renewable, that is, they draw on finite resources that will eventually dwindle, becoming too expensive or too environmentally damaging to retrieve. In contrast, the many types of renewable energy resources-such as wind, and solar energy-are constantly replenished and will never run out. Renewable energy [1] is mostly called “clean energy” or “green power” because it doesn’t pollute the air or the water and does not result carbon emission. Most renewable energy comes either directly or indirectly from the wind or sun. Sunlight, or solar energy can be used directly for heating and lighting homes and other buildings, for generating electricity, and for hot water heating, solar cooling, or charging vehicles in any charging station and a variety of commercial and industrial uses. So PV based system is a very effective system for using in EV based charging station by utilizing solar energy. There can be seen so many scientific researches on this subject covering analyze, find solution, apply technical methods for overcoming this problems as one looks up literature. Speaking generally renewable energy is proposed dominantly all around the world due to its benefits and less harm for the natural beings. As it is well known these resources are wind, solar energy, etc. in this application as replacement of conventional energy types like fuel, diesel and natural gas. A detailed literature research has been done and under this enlightenment of research a PV based EV/PHEV charging station characteristics, specifications and
requirements are revealed by using real data for specific area. The paper consists of a system description, system model, computer-aided simulations and conclusion with suggestions for the future works to be done.
II. SYSTEM DESCRIPTION
The modeled PV array includes 310 solar panels (5 Nseries and 66 Nparallel). Each panel has an open circuit voltage of 30.8V with the maximum power point voltage of 30V. This provides the array an open circuit voltage of 154 V and a maximum power voltage (Vmpp) of 150V [2]. Besides, proposed model has an energy storage system battery of 120V and 1000Ah. A block diagram of the system is given below in Fig 1. Solar Panel Buck Converter Li Ion Battery Buck Converter and PI Controller Buck Converter and PI Controller
Fig. 1: Block Diagram of the system A. Solar Cell Model
Typically a solar cell can be modeled as a current source in parallel with a diode, shunt resistor, and a series resistor as displayed in Fig.2 [2].
Fig. 2: Equivalent circuit for a solar cell [1]
The current i produced by solar cell is given in equation below [3].
݅ ൌ ܫ݄െ ܫͲ൬݁
ݒܴ݅ݏ
݊ ݏܸݐ െ ͳ൰ െݒܴ݅ݏ
ܴݏ݄ (1)
Where; Iph=photo generated current produced, IO=reverse
saturation current, Vt=junction thermal voltage, v=terminal voltage, Rs=panel series resistance, Rsh=panel shunt resistance
and ns= the number of cells in the panel connected in series.
It is expected that the performance of a given solar PV system depends mainly on the solar irradiation and the temperature [4]. PV panel cell has two basic inputs directly affect output power of panel, which are irradiance and temperature. Talking generally about characteristic of solar cell as we set temperature fixed and then increase irradiance, the output current of panel also rises, while applying the same procedure for the fixed irradiance and incremental temperature inversely output current decreased. This paper verified this characteristic via simulations graphed in Fig 4. Values provided in Table 1 is derived from a specific condition of 1000W/m2
irradiance and 25 °C temperature. B. PV Array Model
According to the Fig. 2 an array of 3 solar cells are connected in serial. There are two inputs for that circuit S corresponds to irradiance and T corresponds to temperature in Celsius. PV array model is shown in Fig. 4.
C. Weather Condition
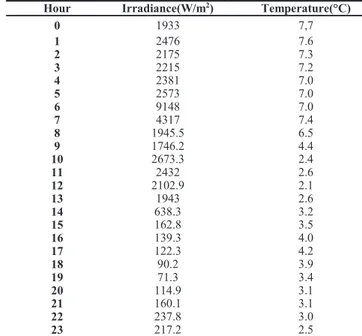
In designed system of such PV panel module, weather condition is a significant point to be taking into account. Since solar irradiance and panel temperature are variable, the worst case should be preferred as input for the expected output total energy. So we took actual data from Turkish State Meteorological Service for Ankara city and the filtered the worst irradiance day of 2013 for our system model input, can be seen from Table 1.
D. Battery Models
Hence we proposed only PV based EV charging station we have to make a good decision about which type and what specification battery model should it be. The excessive amount of solar energy after feeding the charging station demand, we are going to store in system battery. Table 2 classified some battery types according to their energy efficiency, energy density and power density. The graph with 19 January 2013 Irradiance and temperature values are given below in Fig 3.
Fig. 3: Graph with 19 January 2013 Irradiance and Temperature Values
TABLE 1. 19JANUARY 2013IRRADIANCE ANDTEMPERATURE VALUES
Hour Irradiance(W/m2) Temperature(°C)
0 1933 7,7 1 2476 7.6 2 2175 7.3 3 2215 7.2 4 2381 7.0 5 2573 7.0 6 9148 7.0 7 4317 7.4 8 1945.5 6.5 9 1746.2 4.4 10 2673.3 2.4 11 2432 2.6 12 2102.9 2.1 13 1943 2.6 14 638.3 3.2 15 162.8 3.5 16 139.3 4.0 17 122.3 4.2 18 90.2 3.9 19 71.3 3.4 20 114.9 3.1 21 160.1 3.1 22 237.8 3.0 23 217.2 2.5
Table2. Energy Storage Technologies [5]
Type Energy
Efficient [%] Energy Density [Wh/kg] Power Density [W/kg] Batteries Pb-Acid 70-80 20-35 25 Batteries Ni-Cd 60 40-60 140 Batteries Ni-MH 50-80 60-80 220 Batteries Li-ion 85-95 100-200 300-2000 Batteries Li-polymer 80-90 100-200 300-2000 Super-caps 90+ 25-75 5,000-20,000
E. Charging Station Standards
In Table 3, the settling of the charging station can differ depending on frequency, voltage, electrical grid connection and standards.
TABLE 3. COMPARISON OF CHARGING STATION STANDARDS PRESENTS A COMPARISON BETWEENTHE EUROPEAN AND AMERICAN STANDARDS
CHARGING LEVEL POWER LEVEL UTILITY INTERFACE
Level 1 1.5 kW 120VAC, 15A, 1-Phase
Level 2 6.6 kW 230VAC, 40A, 1-Phase
Level 3
SAE for North American [1]
Voltage:300-600V DC or 3-phase AC Current:80-400A
Power output: 90-240 kW [6]
IEC for Europe [2]
Maximum AC power output: 172.5 kW Voltage:690 V, 50-60 Hz
Max. AC current: 250A Max. DC power output: 240 kW Voltage: 600V
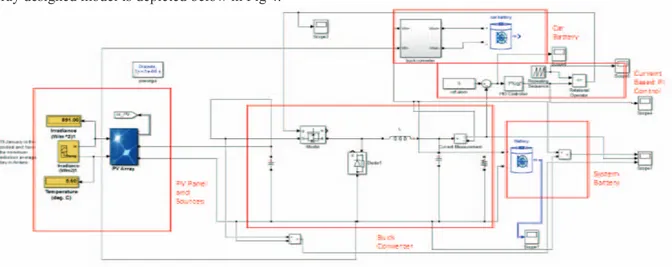
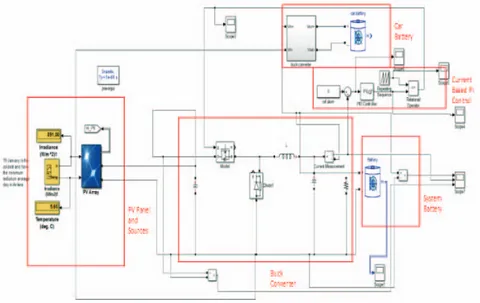
III. SIMULATION PLATFORM AND RESULTS The PV array designed model is depicted below in Fig 4.
Fig. 4: PV Array Designed Model The algorithm as well as the flow diagram of the model is
given below STEP 1: START
STEP 2: Sunlight present or not
STEP 3: Which is acting as source and load?
STEP 4A: Is PV Power >EV Power and How is the State of Charge Condition?
STEP 4B: Battery is in charging or discharging mode STEP 5: END
Fig. 5: Flow Diagram of PV based system
The I-V and P-V Characteristics of One Module at 25C°V, I-V and P-V Characteristics of Array at 25C° as well as I-V and P-V Characteristics of Array at 1000W/m2 are given below
respectively in Fig. 6, 7 and 8.
Fig. 6: I-V and P-V Characteristics of One Module at 25C°
Fig. 8: I-V and P-V Characteristics of Array at 1000W/m^2[7]
In Fig. 8, PV Panel produces 152.73V and 487.6 A for 891 W/m2 and 5.6 °C. The PV Based EV Charging Station Model,
PV Panel Current and Voltage, SOP of system battery as well
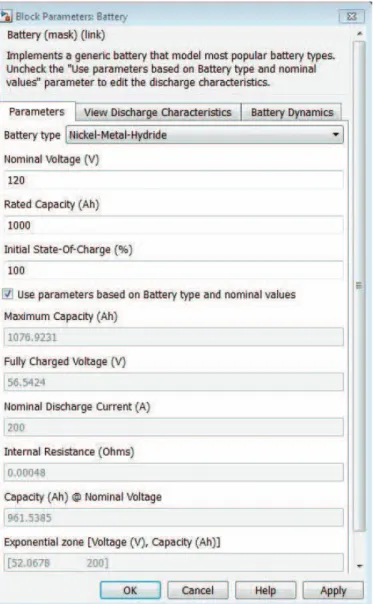
as the entire system have been represented in Fig. 9 and the system battery parameters are depicted in Fig. 10.
This data is taken General Directorate of Meteorology for every day in Ankara city. The lowest data is used for one day the worst electric production in last year
PV panel current and voltage is given Fig. 10, where the red color graph represents the charging and discharging current and another shows the voltage graph correspondingly. The nominal voltage of system battery is 120 V as shown in Fig. 12, along with it parameters Table. In our proposed system, battery is considered for energy storage helping in cloudy days to keep the system stable as PV Panels don’t produce enough energy at this time. Other important factor is SOC (State-of-Charge). Battery SOP must have low discharge time for long winter days and it is shown in Fig.11. In addition, the nominal voltage of car battery is 24 V and the parameter of it also indicates it in Fig. 11.
A buck converter with PI controller is used to maintain the system in stable within design band range.
Fig. 9: PV Based EV Charging Station Model
Fig. 10: PV Panel Current and Voltage of system battery
Fig. 12: System Battery Parameters system battery
The output power of PV array and EV charging are shown in Fig. 13 and Fig. 14 respectively. Battery Power, which is illustrated in Fig. 15, is represented as the combined power of PV array output power and EV charging station power. From the figures it can be calculated the required output power of storage either in charging or discharging mode. The charging station power is 30 kW for the period of 0 to 2 second. The Electrical Vehicle charging power is always constant for 25 kW from 0 to 6 second. So, from 0 to 2 second the combination of the two output powers is 5 kW. Now, the PV array output power drops for 20 kW from 2 to 3 second. So, the combination power (battery power) is -5 kW at this moment. Again, the output power of Solar PV is calculated from the given steps in Fig. 13, since the Electric Vehicle power remains constant, the battery power follows the Potential Array Voltage Output power simultaneously.
Fig 13: PV Array Output Power
Fig. 14:EV Charging Station Power
Fig. 15:Battery Power
IV. CONCLUSION
As a consequence of finite petroleum original resources, renewable energy sources became indispensable for our daily life energy demand. In this perspective we intended to give an efficient, applicable and cost effective model of PV based EV charging station through the environmental data of Ankara city in particular circumstance. This study shows that it is possible to implement and market Solar PV based EV charging station without grid connection. In accordance available irradiance and temperature values, one can produce sufficient energy while battery used as a backup. Instead of using the grid power as backup source, energy storage system (ESS) batteries are chosen so that whenever solar power is inadequate to supply power for charging of EV, ESS takes the control and injects the necessary energy to the charging system [8-21]. The presented model of solar power energy can be a good initiative for the future appliances and implementation to be carried out in this area.
REFERENCES
[1] Heba Allah Essam E Khalil; E E Khalil, "Energy efficiency in the urban environment", The CRC Press Series in Mechanical and Aerospace Engineering, 2015
[2] M. Jensen. "Model and simulation of a 75kW PVsolar array", IEEE PES T&D 2010, 04/2010.
[3] D. Sera, R. Teodorescu, P. Rodriguez. “PV Panel Model Based on Datasheet Values”, IEEE International Symposium on Industrial Electronics, pp. 2392-2396, June 2007.
[4] M. Bouzguenda, T. Salmi, A. Gastli and A. Masmoudi "Evaluating Solar Photovoltaic System Performance using MATLAB", Renewable Energies and Vehicular Technology (REVET), 2012 First International Conference on, pp. 55-59 March 2012
[5] Falvo, M.C. ,Sbordone, D. ; Bayram, I.S.; Devetsikiotis, M. "EV Charging Stations and Modes: International Standards", International Symposium on Power Electronics, Electrical Drives, Automation and Motion, June 2014
[6] F. Huang, P. Sarikprueck, Y. Cheng, and W. Lee." Design opt imization of PHEV charging station", 48th IEEE Industrial & Comm ercial Power
Systems Conference, 2012.
[7] Alqarni, Mohammed, and Mohamed K. Darwish. “Maximum power point tracking for photovoltaic system: Modified Perturband Observe algorithm”, 2012 47th International Universities Power Engineering
Conference (UPEC) 2012
[8] Rasinab, Z., Rahmana, M.F. "Grid-connected quasi-Z-source PV inverter for electricvehicle charging station", International Conference on Renewable Energy Research and Applications, October 2013.
[9] Mohammad SaadAlam "Conceptual framework of a Solar PV based high voltage Battery charging strategyfor PHEVs and EVs", American Journal of Electrical Power and Energy Systems, November 2013.
[10] Mingchao Xia, Xuanhu He, and Xiaoqing Zhang, “Distributed Generation System Control Strategies in Microgrid Operation”, Hindawi Publishing Corporation, Mathematical Problems in Engineering, Volume 2013, http://dx.doi.org/10.1155/2013/686508.
[11] E. Hossain, E. Kabalci, R. Bayindir and R. Perez “Microgrid testbeds around the world: State of art”, Energy Conversion and Management 86 (2014) 132–153.
[12] E. Hossain, E. Kabalci, R. Bayindir and R. Perez “A Comprehensive Study on Microgrid Technology”, International Journal of Renewable Energy Research, Vol.4, No.4, 2014 1094–1107.
[13] E. Hossain, S. Khan and A. Ali “Low voltage power line characterization as a data transfer method in public electricity distribution networks and indoor distribution networks”, Electric Power Conference in Canada, 2008. (EPEC) 2008, Pg. No. 1-7.
[14] E. Hossain, S. Khan and A. Ali “Modeling Low Voltage Power Line as a Data Communication Channel”, World Academy of Science, Engineering and Technology) 2008, Vol. 45, Pg. No. 148-152.
[15] E. Hossain, R. Muhida, A. Faris Dzulkipli and K. Azizi Abdul Rahman “Solar cell efficiency improvement using compound parabolic concentrator and an implementation of sun tracking system”, International Conference on Computer and Information Technology (ICCIT) 2008, Pg. No. 723-728.
[16] E. Hossain, R. Muhida, and A. Ali “Efficiency improvement of solar cell using compound parabolic concentrator and sun tracking system”, Electric Power Conference in Canada, (EPEC) 2008, Pg. No. 1-8. [17] E. Kabalci, R. Bayindir and E. Hossain “Hybrid microgrid testbed
involving wind/solar/fuel cell plants: A desing and analysis testbed”, International Conference on Energy Research and Application (ICRERA), 2014, Pg. No. 880-885.
[18] R. Bayindir, E.Bekiroglu, E.Hossain and E.Kabalci “Microgrid facility at European union”, International Conference on Energy Research and Application (ICRERA), 2014, Pg. No. 865-872.
[19] E. Kabalci, E.Hossain and R.Bayindir “Microgrid test-bed design with renewable energy sources”, International Conference on Power Electronics and Motion Control Conference and Exposition (PEMC), 2014, Pg. No. 907-911.
[20] E. Hossain, R.Bayindir, E.Kabalci and E.Bekiroglu “Microgrid facility at European union”, International Conference on Energy Research and Application (ICRERA), 2014, Pg. No. 873-879.
[21] R. Bayindir, E. Hossain, E. Kabalci and K. Md Masum Billah “Investigation on North American Microgrid Facility”, International Journal of Renewable Energy Research, Vol.5, No.2, 2015.
![Fig. 2: Equivalent circuit for a solar cell [1]](https://thumb-eu.123doks.com/thumbv2/9libnet/3580586.19905/1.893.461.664.900.1006/fig-equivalent-circuit-a-solar-cell.webp)