Laser oscillator with nonlinear saturable absorber:
A pump to signal noise transfer function model
P. Elahi, I. Levent Budunoglu, Kutan Gurel, and F. ¨Omer Ilday Department of Physics, Bilkent University, TR-06800 Ankara, Turkey
Abstract: We report a model to describe the characterization of pump noise transfer in an laser oscillator consist of nonlinear saturable absorber. At the first, we obtained a linear superposition relation for modulation transfer function of amplifier part. By using the nonlinear characteristics of saturable absorber, a nonlinear quadratic equation for MTF of laser oscillator obtained . The theory then validate with experiment and good consistency observed. © 2011 Optical Society of America
OCIS codes: (060.7140) Ultrafast processes in fibers; (140.3538) Lasers pulsed; (320.7090) Ultrafast Lasers.
The measurement of amplifier and laser noise has long been an important part of laser science. Theoretical modeling and measurement of noise transfer in fiber amplifiers are being reported in many literatures [1–3] while, noise of fiber oscillators has not received such that attention. . According to the major contributor of noise in lasers during amplification and oscillation is the transfer of noise of the pump lasers, the main aim of this paper is introduing a model to calculate the pump intensity modulation transfer function(MTF) describing coupling of modulation of pump to the laser pulse. Here, we present a simple, yet accurate theoretical model for transfer of pump modulations using a modulation transfer function approach. We considered an oscillator consisting of two main transfer elements, amplifier and nonlinear part and derived a model to describe pump noise transfer function.
1. Theoretical Model
We model modulation of the pump powers as well as population levels at frequencyω= 2πνas:
Pp(s)(z,t) = Pp(s),0(z)(1 + qp(s)(z,ω)eiωt) (1)
n1(2)(z,t) = n1(2),0(z)(1 + q1(2)(z,ω)eiωt), (2)
where Pp(s)(z,t) are the pump (signal) powers and n1(2)(z,t) are the fractional population densities of the lower (up-per) states, and q(ω, z) represent the complex modulation function. Pp(s),0(z) and n1(2),0(z) correspond to power and population equations solutions without modulation. The complex modulated pump and signal at the entrance the gain medium in the nthroundtrip can be written by
qp,s(n)=δPp,s(n)
Pp,s(n)
(3)
where Pp,s(n) is the pump(signal) power at entering the gain medium at the nth roundtrip . Similarly, the complex modulated pump and signal after passing thought the gain medium in the nthroundtrip can be written as follow
q′p,s(n)=δ
Pp,s(n)′
Pp,s(n)′ (4)
By definition of modulation transfer function, the corresponding pump(signal) modulation transfer function after pass-ing through the gain at the nthroundtrip is
ξp,s(n)=
q′s(n)
qp,s(n) (5)
NLO/ISOM/ODS © 2011 OSA
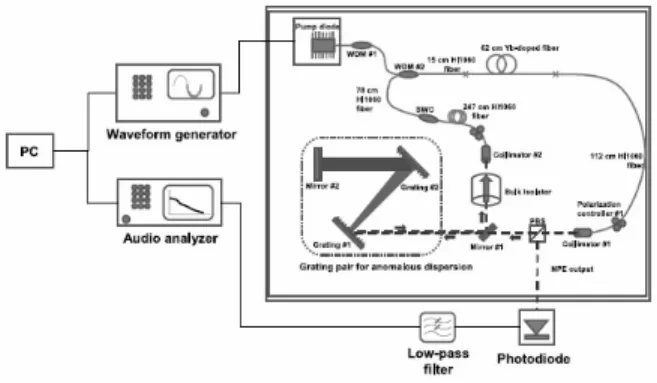
Fig. 1. Experimental setup for MTF mesearment
The total variation of signal power after passing through the gain medium is due to the variation of entrance pump and signal, so, the total variation of signal power can be written as
∆Ps(n)′ =
δPs(n)′
δPs(n)δPs(n)+
δPs(n)′
δPp(n)δPp(n) (6)
Use Eqs. (3-5) by dividing to Ps(n)′ , the following relation will be obtained
q′s(n)=ξs(n)qs(n)+ξp(n)qp(n) (7) This main equation shows that the total output signal modulation is a linear superposition of each individual entrance pump and signal modulation. Now consider a nonlinear element which nonlinear transmittance can be describes as follow
Ps(n)′′ = Ps(n)′ T (Ps(n)′ ) (8) where Ps(n)′ is the input powerT (Ps(n)′ ) is transmitance. By calculation of signal power flactuation after passing through the nonlinear transmitance element, the following relation for outgoing pulse flactuation will be obtained
∆Ps(n)′′ = (ξs(n)qs(n)+ξp(n)qp(n))P ′′ s(n)− (ξs(n)qs(n)+ξp(n)qp(n))2 T1 T0 G2Ps(n)2 Ps(n)′′ (9)
where T0is the maximums transmitance, G is gain and T1is a parameters shows the nonlinearity of transmitance. By dividing to Pp(n)′′ , we find q′′s(n)= (ξs(n)qs(n)+ξp(n)qp(n))− (ξs(n)qs(n)+ξp(n)qp(n))2T1 T0 G2Ps(n)2 (10) by considering q′′s(n)= qs(n+1),β =T1 T0G 2P2
s(n),ξs(n)=|ξs(n)|eiϕs(n) andξp(n)=|ξp(n)|eiϕp(n) after some simplification, the above equation can be written as
qs(n+1)= aq2s(n)+ bqs(n)+ c (11)
where a = −β|ξs(n)|2e2iϕs(n), b = |ξ
s(n)|eiϕs(n)(1 − 2βqp(n)|ξp(n)|eiϕp(n)) and c = qp(n)|ξp(n)|eiϕp(n)(1 −
βqp(n)|ξp(n)|eiϕp(n)) The magnitude and phase of modulation transfer function can be considered the same of the amplifier system and as an good approximation could be considered independent of rountrips. By considering
qs(n+1)= qs(n)= q∗s as n−→ ∞ , the modulation transfer function of pump,ξp∗, can be calculated asξp∗=|qq∗ p|
NLO/ISOM/ODS © 2011 OSA
100 101 102 103 104 105 106 0.2 0.4 0.6 0.8 1 1.2 1.4 1.6 1.8
Modulation Transfer Ratio
Modulation Frequency (Hz) 10 0 101 102 103 104 105 106 0 0.1 0.2 0.3 0.4 0.5 0.6 0.7
Modulation Transfer Ratio
Modulation Frequency (Hz)
Fig. 2. Modulation transfer function measured experimentally(top), by theory (bottom)
2. Results and Discussion
Figure (1) shows the experimental setup to measure MTF. The RIN measurements are taken by using the standard method [4]. The optical signal is detected with a photodiode (InGaAs). The signal at baseband is obtained by low-pass filtering (dc to 1.9 MHz) the photocurrent and analyzed with a high dynamic range base-band spectrum analyzer (bandwidth of 250 kHz). Integrated noise is obtained by integrating the noise spectrum, multiplying by 2 (to account for the double sidebands), and taking the square root over the desired bandwidth. The transfer function is also obtained by a wellknown method .We modulated the pump diode with an arbitrary waveform generator over a frequency range from DC to 250 kHz.experimental verification, we used . As a first step we have obtained the MTF for both YDFL and EDFL. The MTF measurements for the YDFL and EDFL are shown in Fig. 2. As expected, the MTFs are essentially flat up to a 3 dB cut-off frequency of 40 kHz for the YDFL and 8.5 kHz for the EDFL(top figures). The obtained MTF for both Yb and Er oscillator have good consistency with theory(bottom figures)
In summary, we have modeled the pump to signal noise transfer function of an oscillator with nonlinear saturable absorber. We developed a simple theoretical model describing these dynamics, which shows excellent agreement with the experiments. We find that pump modulations are not transferred at low high frequencies. In spite of amplifier, the initial pump modulation influence the MTF. We use our model to predict the intensity noise of an oscillator, obtaining excellent agreement with experiments. Finally, we show that fiber oscillator can be achieved with little excess noise if the low-frequency noise of the pump is suppressed .
References
1. I. L. Budunoglu, C. ¨Ulg¨ud¨ur, B. Oktem, and F. ¨O. Ilday, “Intensity noise of mode-locked fiber lasers,” Opt. Lett. 34, 2516 (2009).
2. C. R. Giles and E. Desurvire, “Modeling erbium-doped fiber amplifiers,” J. Lightwave Technol. 9 (2), 271 (1991). 3. T. D. Mulder, R. P. Scott, B. H. Kolner, “Amplitude and envelope phase noise of a modelocked laser predicted from its noise
transfer function and the pump noise power spectrum,” Opt. Express,16, 14186 (2008). 4. H. Hodara, “Statistics of thermal and laser radiation,” Proc. IEEE 53, 696 (1965).
NLO/ISOM/ODS © 2011 OSA