© 2020 (Olha Ilyash, Osman Yildirim, Liubov Smoliar, Dariia Doroshkevych, Taras Vasylciv and Ruslan Lupak) This is an open access article licensed under the Creative Commons Attribution-NonCommercial-NoDerivs License (http://creativecommons.org/licenses/by-nc-nd/4.0/).
ISSN 1732–4254 quarterly
journal homepages: https://content.sciendo.com/view/journals/bog/bog-overview.xml http://apcz.umk.pl/czasopisma/index.php/BGSS/index
BULLETIN OF GEOGRAPHY. SOCIO–ECONOMIC SERIES
Evaluation of enterprise investment attractiveness under
circumstances of economic development
Olha Ilyash
1, CDMR, Osman Yildirim
2, CDM, Liubov Smoliar
3, CFR, Dariia Doroshkevych
4, CDMR,
Taras Vasylciv
5, CDFM, Ruslan Lupak
6, CDFM1,3,4National Technical University of Ukraine “Igor Sikorsky Kyiv Polytechnic Institute”, Ukraine, 1e-mail: [email protected] (corre-sponding author), https://orcid.org/0000-0002-7882-3942, 2Istanbul Arel University, Turkey, 2e-mail: [email protected], 3e-mail: [email protected], 4e-mail: [email protected], 5State Enterprise “Dolishniy Institute of Regional Research of NAS of Ukraine”, Ukraine, e-mail: [email protected], Lviv University of Trade and Economics, Ukraine, 6e-mail: [email protected]
How to cite:
Ilyash O. et al. (2020). Evaluation of enterprise investment attractiveness under circumstances of economic development. Bulletin of Geography. Socio-economic Series, 47(47): 95-113. DOI: http://doi.org/10.2478/bog-2020-0006
Abstract. This article introduces a step-by-step methodology for evaluating an en-terprise’s investment attractiveness in the context of economic development, using appropriate valuation parameters at macro, meso and micro levels. A system of indicators of macro-level investment attractiveness has been formed based on the criteria of socio-economic and legal attractiveness and investment risks. The in-dicators for assessing investment attractiveness of the industry have been grouped by the criteria of: prospects of the industry, positioning of the enterprise in the industry market, and sectoral investment risks. The indicators of investment at-tractiveness have been systematised with the use of three-dimensional current and operational analysis, as well as the method of risk assessment, which helped to determine the area of reaction to risk zones of the enterprise’s investment po-tential. The research allowed us to assess the position of a company in the mar-ket and to predict the risks of investing in the chemical industry.
Contents:
1. Introduction . . . 96
2. Material and research methods. . . 96
3. Results . . . 98 4. Discussion . . . 108 5. Conclusions . . . 111 References . . . 112 Article details: Received: 27 November 2019 Revised: 13 January 2020 Accepted: 21 January 2020 Key words: Investment attractiveness, Investment potential, Investment evaluation, Economic development, Investment risks
1. Introduction
The development of economic processes is cyclical: each growth is accompanied by a recession, which then gives way to recovery and new growth. Finan-cial crises in the economy are inevitable, as well as further economic growth. However, crises in the global economy, coupled with a rapid decline in the world’s largest indices, have caused investors to minimise their risk and reduce the volume of in-vestment in developing countries, and they have emphasised the need to develop a system of effec-tive management of investment attraceffec-tiveness.
With the completion of the fifth technological wave, the world is waiting for the “thaw” – the next phase of growth. Moreover, with the acceleration of scientific and technological progress and the emer-gence of more and more new economic activities, the pace of evolution in the business world is be-coming faster and faster (Paul Weaver et al., 2017; Evolutionary Theories of Economic and Technolog-ical Change, 2018). This means that today the aver-age time within which a company is able to retain a competitive advantage – that is, get an econom-ic return in addition to the cost of capital – has shortened significantly. This trend is potentially im-portant for investors in terms of valuation, portfolio turnover and diversification. In view of this, the se-lection of adequate methods, criteria and indicators for assessing the investment attractiveness of an en-terprise and developing an effective model of man-aging the investment attractiveness of an enterprise in the market in conditions of economic instabili-ty becomes more and more relevant (Zhukovskaya et al., 2016).
2. Material and research methods
A significant contribution to the development of the theory and methodology of evaluating the invest-ment activity of enterprises was made by foreign scientists (Keynes, 2013; Davidson, 1968; Harrod, 1952; Domar, 1952; Solow, 1956; Graham, 1962; Gitman and Joehnk, 2011). It is worth considering the opinion of Schumpeter (1954), who believed that economic development is a cyclical process,
driven by the abrupt nature of innovation, which means that innovation is part of economic devel-opment and one of the components of investment attractiveness. If we summarise the interpretations of investment attractiveness of the above authors, it can be argued that this is a set of quantitative and qualitative indicators-assessments of the investment object, which together determine the potential sol-vent demand for business investment.
Today, modern scientists are continuing research on this topic. Thus, Goncharuk and Karavan (2013) propose using a comprehensive approach, which re-quires detailed research employing analytical and expert methods to evaluate investment attractive-ness. If there is no opportunity for such analysis, market information can help in the assessment. Akhmetshin et al. (2017) suppose that there are at least three approaches to evaluating investment at-tractiveness. Each approach uses either indicators of financial and economic activities of an enterprise or investment potential, investment risk, the methods of evaluation of investment projects or valuation of an enterprise.
Strokov (2014: 2) supposes that it is advisable to use “an algorithmic process projection as a series of steps that allow determining the quality of retro-spective development of these business entities” as a methodology for researching investment attrac-tiveness. Yakupova et al. (2017) propose using the Kendall rank correlation coefficient to evaluate the investment attractiveness of an enterprise, which al-lows a large number of different indicators to be systematised and the economic indicator to be rep-resented visually.
In turn, the investment attractiveness of an en-terprise largely determines the investment attrac-tiveness of the industry in which it operates and, therefore, it has an impact on the investment attrac-tiveness of the region and the national economy as a whole. Scientists, in particular Stroeva et al. (2015), draw attention to the methods for evaluating invest-ment activity at the meso level; Mustafakulov (2017) focuses on the investment attractiveness of regions in terms of the definition and classification of im-pacting factors; Dorożyński and Kuna-Marszałek (2016) explore the investment attractiveness of the Visegrad Group countries; Jantoń-Drozdowska and Majewska (2016) evaluate the investment attrac-tiveness of countries through the prism of their
locational characteristics and the development of industries in the country. According to the scientists Majewska-Bator and Jantoń-Drozdowska (2007) and Ushakov (2011), in order to enhance invest-ment attractiveness, sustainable developinvest-ment must be prioritised.
As we can see, determining the effectiveness of an enterprise, which is an integral part of its invest-ment attractiveness, is a complex and multifaceted problem that needs new solutions and sparks debate and disagreement when being solved. Therefore, the question of assessing investment attractiveness and determining how to improve it is currently crucial for investors, whose aim is to make a profit and at the same time define the degree of risk and diversify or minimise it; the same is true for companies inter-ested in strategic business development. This raises the question of identifying the key criteria that de-termine investment attractiveness at: the organisa-tional level – the micro level, i.e. the company or the project; the (inter) sectoral level – the meso-lev-el, i.e. the industry, the region, the competitive envi-ronment; and the territorial level – the macro level, i.e. the state.
The choice of methods for assessing invest-ment attractiveness is conditioned by the ambigu-ity of the notion of “investment attractiveness” in the economic literature. We have concluded that it is expedient to adhere to the position of O. Koyu-da (2008), who defines investment attractiveness from the point of view of assessing the manage-ment and financial and economic activity of an enterprise. Despite the fact that, in the existing sci-entific literature, the assessment of investment at-tractiveness is certainly true, it neglects the events and factors that affect the investment attractiveness of specific industries. In this context, we support H. Strokovych (2011) concerning the need to eval-uate the investment attractiveness of an enterprise from the standpoint of systematic analysis (a set of factors that affect the financial and economic con-dition of an enterprise) and economic and mathe-matical methods (a set of indicators that express the effectiveness of the financial and economic activity of an enterprise).
Based on the theory and methodology of eval-uating the investment attractiveness of a business, we ask two research questions: (1) How does the combination of economic and mathematical
meth-ods of assessing the country and industry’s invest-ment attractiveness and systematic analysis (using the methods of current, operational and prospec-tive analysis) of the investment attracprospec-tiveness of an enterprise influence the prospects of the investment attractiveness of business in the conditions of eco-nomic development? (2) Does the chosen algorithm for using the methods of estimating the investment attractiveness of an enterprise provide the choice of a model of investment attractiveness management? To answer these questions, we have consistently ex-amined the investment attractiveness of a compa-ny using the example of “Avgust-Ukraine” LLC, and carried out an assessment of the company’s posi-tioning in the market and made a prediction of the risks of investing in the chemical industry.
Of course, in the process of compiling an al-gorithm for the investment attractiveness estima-tion, we have used three main approaches, based on the recommendations of the International Val-uation Standards (2017) developed by The Interna-tional Valuation Standards Council such as: a cost (income) approach that includes the single-peri-od capitalisation methsingle-peri-od, discounted cash-flows, weighted average cost of capital; an expense ap-proach that includes the net asset method and the liquidation value method; and a comparative ap-proach that includes the capital market method, the transaction method (sales method), the indus-try coefficient method and the statistical value mod-elling method.
We reckon that in current scientific research it is worth paying attention to the firm belief of El-vir M. Akhmetshin (2017) and Williamson (1998) that it is important for potential investors to assess a company’s investment attractiveness. In addition, we agree that for the most accurate assessment of the investment attractiveness of a company, inves-tors pay attention to the macro-economic indica-tors of the country over the last 3–5 years and the results of financial and economic activities of the company, as part of the effectiveness of the develop-ment of a particular industry. Thus, an appropriate algorithm for estimating the investment attractive-ness of a country, industry and enterprise has been drawn up; each of them contains the calculation of the integral index of the investment attractiveness.
We have divided the system of indicators of the macro-level investment attractiveness into three
sig-nificant groups: 1) socio-economic attractiveness (the main indicators are based on 12 components, which comprise three groups: basic requirements, efficiency, innovation and development (World Eco-nomic Forum, 2018); 2) legal attractiveness – the ease of doing business index (Doing Business Re-port, 2018); and 3) investment risks, by which in-dicators are ranked in a specific order and divided into five main groups, namely: cohesion, econom-ic, political, social and cross-sectoral (The Fund for Peace, Fragile States Index, 2018). It is clear that we have analysed the performance of each of the three groups over a five-year period. In addition, we have used such a methodology for calculating the integral index as Investment Attractiveness of the Country (IAC) based on the summation of the Index of Socio-Economic Attractiveness (ISEA), the Legal Attractiveness Index (IA) and the country’s Investment Risk Index (IR).
Since it is difficult to gather reliable information to calculate the components of the Investment At-tractiveness Index of the chemical industry, because the market (in our case, oligopolistic) is sufficiently closed, each of the companies in the market has its own tools to make such an assessment. Therefore, we calculated the Investment Attractiveness of the Industry Index (IAI) by summing up the Industry Perspectives Index (IP), the Company Position dex (ICP) and the Investment Risks to Industry In-dex (IRI).
Continuing the study, we decided to group the system of indicators of the company’s investment at-tractiveness into a step-by-step evaluation method. At the first stage of the assessment, using the meth-ods of current analysis, in particular the analysis of the property condition, we identified the sources of property formation and evaluated how it is used. An assessment of the financial condition (indicators of liquidity, solvency, business activity, financial stabil-ity [debt]) made it possible to discover the abilstabil-ity of the enterprise to make timely and full payments on its obligations. With the help of indicators of finan-cial stability, we determined the finanfinan-cial strength margin of the firm, that is, the stability of its activ-ity in the long-term. The calculation of profitabili-ty indicators allowed us to evaluate the economic efficiency of financial and economic activity of the enterprise, and, in fact, the use of indicators of busi-ness activity revealed the ability of the investigated
enterprise to develop dynamically, achieve the cho-sen goals and increase its market share.
At the second stage of assessing the investment attractiveness of the enterprise, we identified the ar-eas of response to “problem spots” using operation-al anoperation-alysis tools and risk assessment methods, in particular, the VaR method (the VaR methodology was developed by “J.P. Morgan Chase” in the late 1980s and subsequently disclosed in a publication about the systems of risk management “Risk Met-rics”) to determine currency risk. In recent years, this method has become one of the most popular methods of risk management and control not only in banking institutions but also in the world’s lead-ing companies.
At the third stage of assessing the investment attractiveness of the enterprise, we employed pro-spective analysis methods, evaluating the probable bankruptcy of the enterprise using statistical meth-ods (models by Ye. Altman, [2019] I. Balabanov, U. Beaver, V. Kovalov, R. Lees, R. Saifullin, G. Sprin-gate, J. Tuffler, D. Fulmer, O. Tereshchenko), and assessing the investment attractiveness of the en-terprise with the determination of the taxonomic indicator of the development of the enterprise’s in-vestment attractiveness. We also managed to gener-ate a strgener-ategic map of the company’s development in the field of finance with the construction of a matrix of financial strategies (J. Franchon and I. Romane, Dorofeev, 2011). As a result, building a three-di-mensional graphical model of the integral evalu-ation of the enterprise’s investment attractiveness provided an opportunity to combine a comprehen-sive assessment of the investment attractiveness of the enterprise and the external environment (mar-ket) in which it operates.
3. Results
The signs that show that enterprises are competitive and function effectively are systematic modernisa-tion of business processes, capitalisamodernisa-tion of financial and investment potential, expansion of participation in the implementation of investment programmes of socio-economic development of territories, and business projects of inter-sectoral and inter-regional cooperation. These trends will intensify in the short
and medium term and their importance will grow accordingly.
In order to make quality management decisions regarding the investment support of enterprises, it is vital to develop a comprehensive system for evalu-ating their investment attractiveness, which consists of analysing the relevant parameters at the macro, meso and micro levels. The results of a comprehen-sive assessment serve as an important criterion for making management decisions regarding the choice of an investment entity.
When assessing the investment attractiveness at the first, macro-economic level, we employed indi-cators by the following groups:
• socio-economic attractiveness • legal attractiveness;
• investment risks.
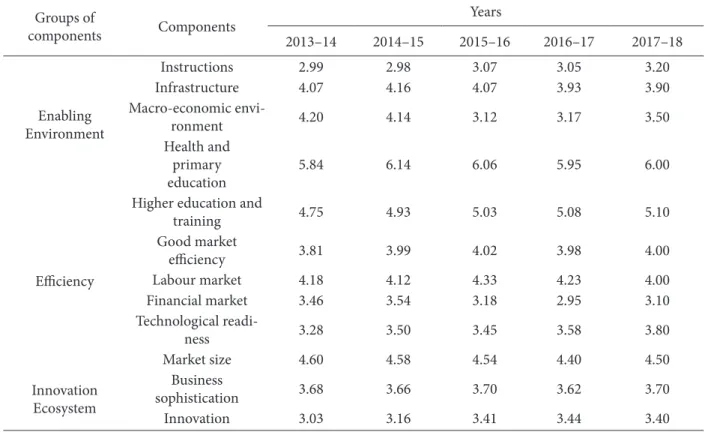
The socio-economic attractiveness of the coun-try is analysed using the Global Competitiveness In-dex, which is divided into three main groups and 12 components (Table 1).
Thus, the indicators of socio-economic growth of Ukraine after a two-year slowdown in 2014–16 (about 3.0%), started growing, which is 0.6% more than in 2013, and 1.7% more compared to 2016.
The following formulas are used to calculate the
country’s socio-economic attractiveness index (ISEA):
,
(1)
where: Nit – the average value of the і-th
compo-nent indices for the t-period.
(2)
where: pi – the absolute values of the i-th indices of the components for the t-period.
Table 1. Indices of Ukraine in the Global Competitiveness Rating of the World Economic Forum in 2013–18
Groups of components Components Years 2013–14 2014–15 2015–16 2016–17 2017–18 Enabling Environment Instructions 2.99 2.98 3.07 3.05 3.20 Infrastructure 4.07 4.16 4.07 3.93 3.90 Macro-economic envi-ronment 4.20 4.14 3.12 3.17 3.50 Health and primary education 5.84 6.14 6.06 5.95 6.00 Efficiency
Higher education and
training 4.75 4.93 5.03 5.08 5.10 Good market efficiency 3.81 3.99 4.02 3.98 4.00 Labour market 4.18 4.12 4.33 4.23 4.00 Financial market 3.46 3.54 3.18 2.95 3.10 Technological readi-ness 3.28 3.50 3.45 3.58 3.80 Market size 4.60 4.58 4.54 4.40 4.50 Innovation Ecosystem Business sophistication 3.68 3.66 3.70 3.62 3.70 Innovation 3.03 3.16 3.41 3.44 3.40
The analysis of the country’s legal attractiveness was done according to the ease of doing business index (Table 2). At the same time, the lower the val-ue of the indicator is, the more attractive for busi-ness activities the country is.
In recent years, the level of ease of doing busi-ness in Ukraine has increased, as evidenced by the positive dynamics of the indicator in internation-al ratings. In particular, in 2018, Ukraine improved its position by 76 points and was ranked 76th out of 191 countries.
At the same time, the following formula should be used to calculate the country’s Political
Attrac-tiveness Index (ІLA):
(3)
where: rt – the country’s ranking by the ease of
do-ing business index in the t-period; kt – the number
of t-periods.
Accordingly, the value of Ukraine’s Political At-tractiveness Index is as follows:
The basic indicator for assessing investment risks is the disability index of a country, which is divided into five groups and 12 components belonging to these groups (Table 3). At the same time, the high-er the value of the indicator is, the highhigh-er the in-vestment risk in the country is, and an increase in the rating characterises its decrease.
The calculation of the level of investment risks in
the country (ІR) is made according to formula 4,
which takes into account the value of all compo-nents of assessing its inability.
Accordingly, the value of the index of socio-economic attractiveness of Ukraine is as follows:
Table 2. Ukraine’s rank in the Ease of Doing Business Index by the World Bank in 2013–18
Year Rank Total number of countries Index value
2013 137 186 – 2014 112 190 – 2015 96 190 62.52 2016 83 190 64.04 2017 80 191 64.90 2018 76 191 66.75
(4)
where: C1,2,3 , Е1,2,3 , Р1,2,3 , S1,2 , Х1 – the value of the country’s inability components.
As for Ukraine, the value of the indicator is as follows:
The data obtained allow us to calculate a generalised index of a country’s investment attractiveness (IIAS) (Formula 5); the greater its value is, the higher its attractiveness for investment activities becomes.
(5)
According to the data of recent years, the index of investment attractiveness of Ukraine was 0.017, which we can see from the corresponding calculation:
Table 3. Ukraine’s place in the disability rating of a country by the International Fund For Peace in 2013–18
Ye
ar
Ran
ki
ng
Cohesion Indicators Economic Indicators Political Indicators IndicatorsSocial cutting Cross- Indicators Re su lt C1 C2 C3 E1 E2 E3 P1 P2 P3 S1 S2 X1 Se cur ity a pp a-rat us Fac tio na lis ed Eli tes Gr ou p Gr ie v-an ce Eco no mic D e-clin e U ne ve n D eve l-op m ent H um an Flig ht an d B ra in Dra in St at e L eg iti -ma cy Pu blic S er vices H um an R ig ht an d R ule o f Law D em og ra phic Pr es sur es Ref ug ees a nd ID PS Ext er na l I nt er -ven tio n 2013 117 4.4 8.0 5.9 5.4 5.3 5.7 7.8 3.6 5.7 4.7 3.2 6.2 65.9 2014 113 4.7 8.0 6.4 5.5 5.0 6.4 8.0 3.9 6.1 4.5 3.4 6.3 67.2 2015 84 4.5 4.4 7.0 5.5 4.7 6.5 8.5 3.8 6.4 7.9 8.0 9.1 76.3 2016 85 4.4 4.3 6.9 5.4 4.4 7.0 8.4 3.9 6.2 7.8 8.0 8.8 75.5 2017 90 7.6 8.0 6.7 6.8 4.2 5.2 8.2 3.7 6.2 4.2 4.6 8.6 74.0 2018 86 7.4 8.0 6.4 6.6 3.9 4.9 7.9 3.9 6.5 3.9 4.9 8.3 72.6 5.50 6.78 6.55 5.87 4.58 5.78 8.13 3.80 6.18 5.50 5.35 7.88 71.92
Source: Developed by the authors according to the source (Fragile States Index, 2019)
We want to note that the main factors that hinder the growth of investment attractiveness of Ukraine are:
• insufficiency and complexity of access to re-sources for the implementation of invest-ment projects in the field of innovation, intellectual property, creation and imple-mentation of advanced technologies, digiti-sation of the economy;
• lack of institutional elements of the infra-structure of inter-sectoral and cross-func-tional cooperation focused on the formation and realisation of the investment potential of the economy;
• critically low volumes of scientific and tech-nical research, and impossibility to practi-cally apply their results, including a small number of innovative enterprises;
• low activity of enterprises in creating and using advanced technologies and intellectu-al property objects, including a significant lack of budgetary state support in this area; • small volumes and low efficiency of selling
innovative products in the real sector of the economy.
In addition to macro-economic preconditions, the investment attractiveness of enterprises is large-ly determined by the sectoral growth rate of invest-ment activity. Thus, the high investinvest-ment potential in Ukraine is inherent in the chemical industry, whose share in the country’s GDP exceeds 5.0%. Given its high integration, it is worth focusing on specif-ic areas of development, in partspecif-icular on the field of plant protection agents. The relevance of such a line of research is confirmed both by natural aspects (the share of agricultural land in the total land fund of Ukraine is more than 70.0%), and market-polit-ical aspects (in Ukraine, politmarket-polit-ical processes of the land market formation are actively ongoing, and hence the development of farms is predicted, but their functioning is impossible without plant pro-tection agents) (Panukhnyk et al., 2019; Vasyltsiv et al., 2017).
To evaluate the investment attractiveness of the industry, the indicators are divided into three main groups that define the levels of:
• prospects of the industry;
• positioning of the enterprise in the sectoral market;
• sectoral investment risks.
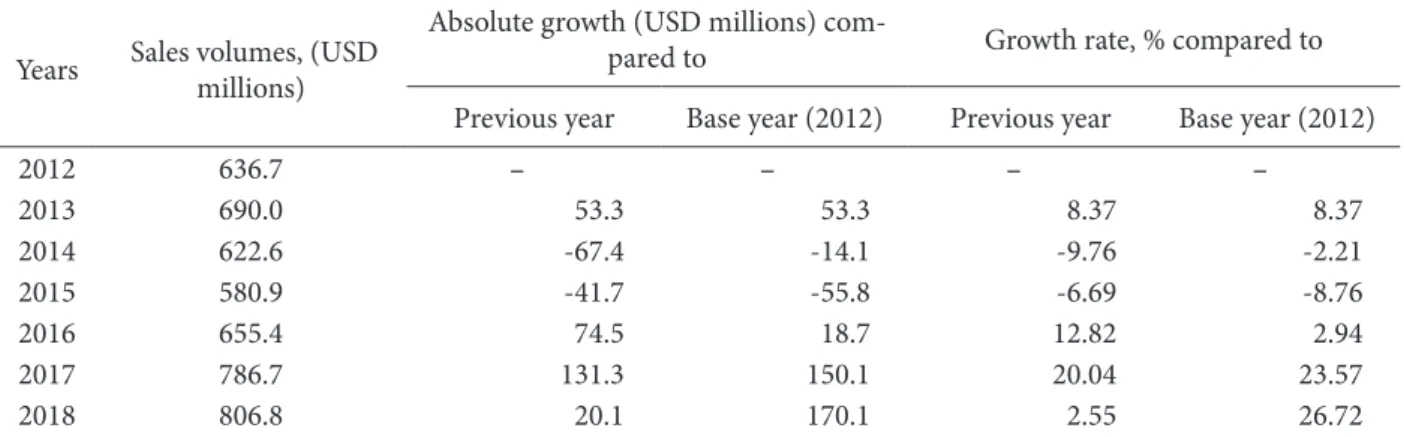
The market for plant protection products in Ukraine is dynamic and promising, as evidenced
by the volume of sales of such products in recent years (Table 4).
During 2012–18, the volume of sales of plant protection products in Ukraine increased by USD 170.1 million, or 26.72%, and in 2018 it amounted to USD 806.8 million. Annual sales of plant protec-tion products in the domestic market of Ukraine rose by USD 28.4 million, or 4.6%, which confirms the previous conclusions about its high investment attractiveness and prospects for progress.
To determine the Industry Prospect Index (IIP), we must use the following formula:
(6)
where: Gt – the growth rate of sold products in the
industry for the t-period; kt – the number of
t-pe-riods.
For Ukraine, the value of the indicator is as fol-lows:
The next stage of evaluating the investment at-tractiveness of the industry is to determine the lev-el of positioning of enterprises participating in the industry market. In particular, almost 100 enterpris-es operate in the Ukrainian market for plant pro-tection products, with 10 of them occupying more than 80.0% of the market (Table 5).
Table 4. Sales volume of plant protection products in Ukraine in 2012–18 (at prices of import into the territory of the country)
Years Sales volumes, (USD millions)
Absolute growth (USD millions)
com-pared to Growth rate, % compared to
Previous year Base year (2012) Previous year Base year (2012)
2012 636.7 – – – – 2013 690.0 53.3 53.3 8.37 8.37 2014 622.6 -67.4 -14.1 -9.76 -2.21 2015 580.9 -41.7 -55.8 -6.69 -8.76 2016 655.4 74.5 18.7 12.82 2.94 2017 786.7 131.3 150.1 20.04 23.57 2018 806.8 20.1 170.1 2.55 26.72
Table 5. TOP-10 enterprises in the market for plant protection products in Ukraine in 2014–18 Pl ace in T O P-10 Enterprises
Years / USD millions
Av era ge va lue o f s ales, (US D mi llio ns) Sh ar e o f en ter pr ises in th e m ar
ket, % Market
re-distribution Pl ace in T O P-10 Enterprises (USD 2018 millions) Sh ar e o f en ter pr ises in th e m ar ket, % 2014 2015 2016 2017 1 Syngenta 104.8 122.3 121.1 146.2 123.6 18.7 Merger DuPont Pioneer and Dow Agro-Sciences (June, 2018) 3 Syngenta 133.6 16.6 2 BASF 97.2 95.5 127.8 127.8 112.1 16.9 1 BASF 143.7 17.8
3 Bayer 109.3 68.5 80.9 110.0 92.2 13.9 2 MonsantoBayer+ 136.6 16.9
4 DuPont Pioneer 48.9 52.4 56.4 68.6 56.5 8.5 4 Pioneer+ Dow DuPont
AgroSciences 89.9 11.1
5 ADAMA 31.3 39.1 55.1 68.6 48.5 7.3 5 ADAMA 75.8 9.4
6 Dow Agro-Sciences 41.9 26.8 25.3 29.0 30.8 4.7
Merger Bayer and Monsanto (August, 2017) 6 UkraineAvgust- 20.3 2.5
7 UkraineAvgust- 36.1 19.0 22.4 19.1 24.2 3.7 7 Shtefes 20.3 2.5
8 Shtefes 15.9 13.8 14.2 16.2 15.0 2.3 9 Arysta 15.7 1.9
9 Arysta 14.7 13.0 17.0 14.3 14.8 2.2 8 ExpressGreen 16.6 2.1
10 ExpressGreen 7.2 10.4 13.6 16.4 11.9 1.8 10 FMC 8.6 1.1
Total market
volume 622,6 580.9 655.4 786.7 661.4 80.1 806,8 82.0
Source: Developed by the authors according to the source (SuperAgronom.com. Plants protecting agents, 2019)
The following formula is employed to calculate the Company Positioning Index (ІСР)
(7)
where: Ft – the company’s share in the market in the t-period; kt – the number of t-periods.
Among the market leaders, we have chosen “Avgust-Ukraine” LLC as the target of this research. In 2018, this company sold USD 24.2 million worth of products and occupied 2.5% of the market. The posi-tioning index of “Avgust-Ukraine” LLC in the industry is 0.286; it was calculated on the basis of the data in Table 5 and formula 7:
The assessment of investment sectoral risks in-volves conducting an expert survey, where risks are divided into three groups (natural, financial, polit-ical), each of which is placed in the areas of high, medium and low impact (Table 6). At the same time, each zone of influence is defined by the fol-lowing ranking scores: high impact – 3; medium – 2, low – 1.
The following formula should be used to
deter-mine the Investment Sectoral Risks Index (I
R):
(8)
where: Rin – ranking scores by і-th risk n-th
im-pact group.
As for the Ukrainian market for plant protec-tion products, the investment risk index was 0.091, which was calculated in this way:
The results of calculations of the respective dices allow us to calculate the overall level of in-vestment attractiveness of the industry using the following formula:
(9)
For the Ukrainian market of plant protection products, the investment attractiveness was 0.412 and, given the active development of farms in the country and the opening of the domestic land market, it can be predicted that the investment at-tractiveness of such a market will be significantly increased.
To determine the investment attractiveness of the company we employed the method of calculating the integral indicator, because such an assessment enables us to combine many different characteris-tics in a single indicator. All this simplifies the pro-cedure for evaluating a specific investment proposal for an enterprise.
At the same time, in order to carry out an in-tegral evaluation of the investment attractiveness of an enterprise, one should stick to the following sequence: 1) formulate a set of indicators; 2) de-termine actual values of indicators; 3) normalise indicators; 4) determine weight coefficients; 5) cal-culate the integral index of the investment attrac-tiveness of an enterprise.
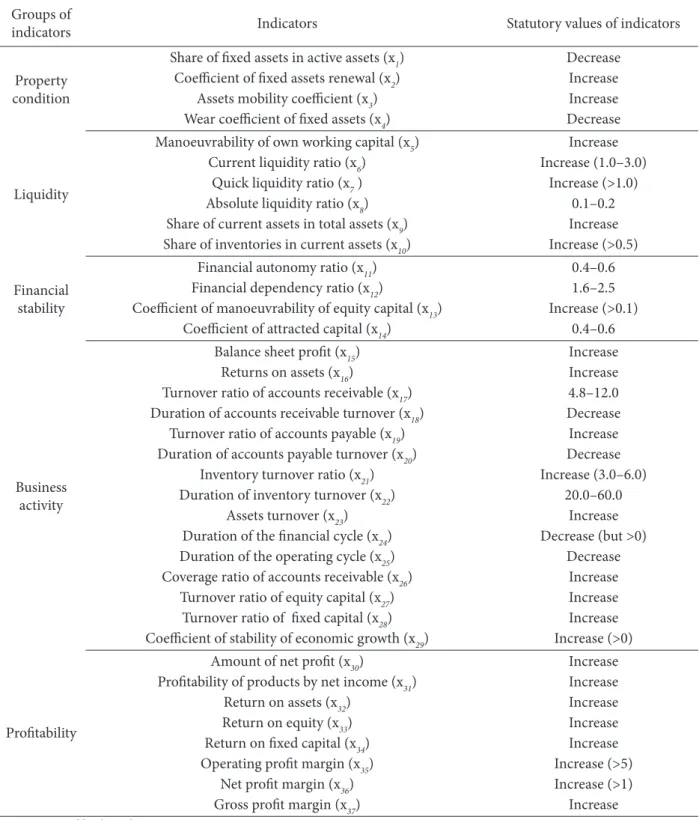
In order to evaluate the investment attractiveness of the enterprise, the indicators are divided into sev-eral groups (property condition, liquidity, financial stability, profitability), which are shown in Table 7.
An empirical evaluation of the investment at-tractiveness of the enterprise was conducted based on the methodological tools of the principal com-ponent method, which eliminates subjectivism in determining the weighted coefficients of indicators and components of investment attractiveness and involves the use of a wide mathematical and sta-tistical apparatus. At the same time, the weighted coefficients were calculated in three stages: 1)
con-Table 6. Major risks in the market for plant protection products in Ukraine in 2014–18
Groups of
risks Risks
Risk zones
high medium low
Natural risks Spread of natural disastersDecrease in yield 22 Financial risks
Increase in accounts receivable 1
Increased foreign exchange risks 2
Destabilisation of internal market 2
Political risks Bureaucratisation of registration proceduresUnpredictable changes in legislation 1 0.5
Increased market monopolisation 0.5
Table 7. Indicators for evaluating the investment attractiveness of an enterprise
Groups of
indicators Indicators Statutory values of indicators
Property condition
Share of fixed assets in active assets (х1) Decrease
Coefficient of fixed assets renewal (х2) Increase
Assets mobility coefficient (х3) Increase
Wear coefficient of fixed assets (х4) Decrease
Liquidity
Manoeuvrability of own working capital (х5) Increase
Current liquidity ratio (х6) Increase (1.0–3.0)
Quick liquidity ratio (х7 ) Increase (>1.0)
Absolute liquidity ratio (х8) 0.1–0.2
Share of current assets in total assets (х9) Increase
Share of inventories in current assets (х10) Increase (>0.5) Financial
stability
Financial autonomy ratio (х11) 0.4–0.6
Financial dependency ratio (х12) 1.6–2.5
Coefficient of manoeuvrability of equity capital (х13) Increase (>0.1)
Coefficient of attracted capital (х14) 0.4–0.6
Business activity
Balance sheet profit (х15) Increase
Returns on assets (х16) Increase
Turnover ratio of accounts receivable (х17) 4.8–12.0
Duration of accounts receivable turnover (х18) Decrease
Turnover ratio of accounts payable (х19) Increase
Duration of accounts payable turnover (х20) Decrease
Inventory turnover ratio (х21) Increase (3.0–6.0)
Duration of inventory turnover (х22) 20.0–60.0
Assets turnover (х23) Increase
Duration of the financial cycle (х24) Decrease (but >0)
Duration of the operating cycle (х25) Decrease
Coverage ratio of accounts receivable (х26) Increase
Turnover ratio of equity capital (х27) Increase
Turnover ratio of fixed capital (х28) Increase
Coefficient of stability of economic growth (х29) Increase (>0)
Profitability
Amount of net profit (х30) Increase
Profitability of products by net income (х31) Increase
Return on assets (х32) Increase
Return on equity (х33) Increase
Return on fixed capital (х34) Increase
Operating profit margin (х35) Increase (>5)
Net profit margin (х36) Increase (>1)
Gross profit margin (х37) Increase
Source: Designed by the authors
struction of the correlation matrix; 2) singling out the main components and the calculation of factor loadings; 3) identification of principal components.
The general calculation of the investment
attrac-tiveness index of the enterprise (ІIAE) is made
(10)
where: xij – the value of the i-th indicator of the j-th
group of indicators; dі – the level of significance of
the i-th indicator; n – the number of indicators; xij
– the value of the i-th indicator of the j-th group
of indicators; ximin – the minimum value of the i-th
indicator (when minimising); хimax – the maximum
value of the i-th indicator (when maximising). According to previous arguments for determin-ing the significance levels of indicators, their values are calculated using the following formula:
(11)
where: Rі – the rank of the i-th indicator
accord-ing to the final rankaccord-ing by the method of princi-pal components.
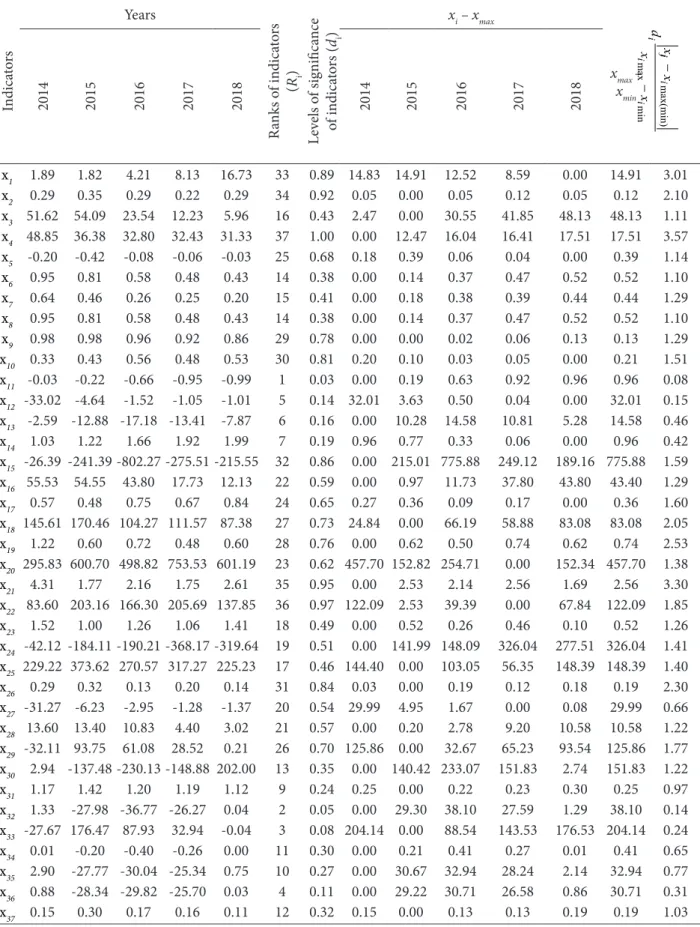
The obtained results of calculations of the indi-cators of “Avgust-Ukraine” LLC make it possible to conclude that the company urgently needs invest-ment capital to ensure its proper functioning and development (Table 8). In particular, it does not sufficiently update the material and technical base, constantly requires funds for the timely settlement of current financial liabilities, is unable to generate sufficient working capital to ensure proper business activity, and does not reach an acceptable level of efficiency of trade and production operations. Nev-ertheless, the investment attractiveness of the com-pany is optimally acceptable (at the level of 0.493), as evidenced by the sufficient level of suitability of fixed assets, a high share of working capital, consid-erable volumes of production stocks, optimum vol-umes of accounts receivable, an increase in the level of profitability of business operations, etc.
According to the data obtained, a graphical mod-el of the investment attractiveness of the enterprise (Fig. 1) was built. This model is formed on the basis of three axes – one vertical and two horizontal. The vertical axis shows the investment attractiveness of “Avgust-Ukraine” LLC (0.493), while the horizontal axes define the indices of the investment attractive-ness of the industry (0.468) and the country (0.325) in which the enterprise operates.
The range of possible integral values of the enter-prise’s investment attractiveness is conditionally di-vided into two zones, ranging from 0.5 to 1.0 (zone of high investment attractiveness) and less than 0.5 (zone of low investment attractiveness). Then there are two possible cases on each axis – for example,
“HIAE” in case of high investment attractiveness of
the enterprise, when it, as an investment object, is more likely to meet the interests of the investor, and
“LIAE” in case of low investment attractiveness of
the enterprise and, as an investment object, it does not meet the interests of the investor.
Accordingly, “HIAC” and “LIAC” characterise the
high and low attractiveness of the country,
where-as “HIAI” and “LIAI” indicate the high and low
at-tractiveness of the industry. As a result, eight pairs of possible combinations of the results of the esti-mation of three values are formed – the investment attractiveness of the enterprise, industry, country; seven combinations of the eight possible combina-tions are indicated in the figure as segment capcombina-tions. The eighth segment is not shown in the figure; it is located in the lower bottom corner and corresponds
to the combination “LIAC, LIAI, LIAE” – “low
invest-ment attractiveness of the country, low investinvest-ment attractiveness of the industry, low investment attrac-tiveness of the enterprise”.
It is difficult to estimate the entry of an enter-prise into the remaining six segments – for example,
into the sector “HIAC, HIAI, LIAE” – “high
invest-ment attractiveness of the country, high investinvest-ment attractiveness of the industry, low investment at-tractiveness of the enterprise”. Since changes in the country’s investment attractiveness are slow enough, a positive assessment of the enterprise’s investment attractiveness from the standpoint of this model will be characterised by a tendency towards an increase in the dynamics of its investment attractiveness and, accordingly, towards moving down the vertical axis
in order to reach “LIAC, HIAI, HIAE” – “low
invest-ment attractiveness of the country, high investinvest-ment attractiveness of the industry, low investment attrac-tiveness of the enterprise”. The location of the ob-tained point X (0.017; 0.412; 0.493) allows the level of the enterprise’s investment attractiveness at the beginning of 2019 to be viewed as optimally
accept-able, since point X is located in the sector “LIAC,
HIAI, LIAE” – “low investment attractiveness of the
in-Table 8. Results of the investment attractiveness evaluation of “Avgust-Ukraine” LLC in 2014–18 In di ca to rs Years Ra nks o f in dic at or s (Rі ) Le ve ls o f sig nific an ce of in dic at or s ( dі ) xi – xmax xmax – xmin min max max(min) i i i ij i x x x x d − − 2014 2015 2016 2017 2018 2014 2015 2016 2017 2018 х1 1.89 1.82 4.21 8.13 16.73 33 0.89 14.83 14.91 12.52 8.59 0.00 14.91 3.01 х2 0.29 0.35 0.29 0.22 0.29 34 0.92 0.05 0.00 0.05 0.12 0.05 0.12 2.10 х3 51.62 54.09 23.54 12.23 5.96 16 0.43 2.47 0.00 30.55 41.85 48.13 48.13 1.11 х4 48.85 36.38 32.80 32.43 31.33 37 1.00 0.00 12.47 16.04 16.41 17.51 17.51 3.57 х5 -0.20 -0.42 -0.08 -0.06 -0.03 25 0.68 0.18 0.39 0.06 0.04 0.00 0.39 1.14 х6 0.95 0.81 0.58 0.48 0.43 14 0.38 0.00 0.14 0.37 0.47 0.52 0.52 1.10 х7 0.64 0.46 0.26 0.25 0.20 15 0.41 0.00 0.18 0.38 0.39 0.44 0.44 1.29 х8 0.95 0.81 0.58 0.48 0.43 14 0.38 0.00 0.14 0.37 0.47 0.52 0.52 1.10 х9 0.98 0.98 0.96 0.92 0.86 29 0.78 0.00 0.00 0.02 0.06 0.13 0.13 1.29 х10 0.33 0.43 0.56 0.48 0.53 30 0.81 0.20 0.10 0.03 0.05 0.00 0.21 1.51 х11 -0.03 -0.22 -0.66 -0.95 -0.99 1 0.03 0.00 0.19 0.63 0.92 0.96 0.96 0.08 х12 -33.02 -4.64 -1.52 -1.05 -1.01 5 0.14 32.01 3.63 0.50 0.04 0.00 32.01 0.15 х13 -2.59 -12.88 -17.18 -13.41 -7.87 6 0.16 0.00 10.28 14.58 10.81 5.28 14.58 0.46 х14 1.03 1.22 1.66 1.92 1.99 7 0.19 0.96 0.77 0.33 0.06 0.00 0.96 0.42 х15 -26.39 -241.39 -802.27 -275.51 -215.55 32 0.86 0.00 215.01 775.88 249.12 189.16 775.88 1.59 х16 55.53 54.55 43.80 17.73 12.13 22 0.59 0.00 0.97 11.73 37.80 43.80 43.40 1.29 х17 0.57 0.48 0.75 0.67 0.84 24 0.65 0.27 0.36 0.09 0.17 0.00 0.36 1.60 х18 145.61 170.46 104.27 111.57 87.38 27 0.73 24.84 0.00 66.19 58.88 83.08 83.08 2.05 х19 1.22 0.60 0.72 0.48 0.60 28 0.76 0.00 0.62 0.50 0.74 0.62 0.74 2.53 х20 295.83 600.70 498.82 753.53 601.19 23 0.62 457.70 152.82 254.71 0.00 152.34 457.70 1.38 х21 4.31 1.77 2.16 1.75 2.61 35 0.95 0.00 2.53 2.14 2.56 1.69 2.56 3.30 х22 83.60 203.16 166.30 205.69 137.85 36 0.97 122.09 2.53 39.39 0.00 67.84 122.09 1.85 х23 1.52 1.00 1.26 1.06 1.41 18 0.49 0.00 0.52 0.26 0.46 0.10 0.52 1.26 х24 -42.12 -184.11 -190.21 -368.17 -319.64 19 0.51 0.00 141.99 148.09 326.04 277.51 326.04 1.41 х25 229.22 373.62 270.57 317.27 225.23 17 0.46 144.40 0.00 103.05 56.35 148.39 148.39 1.40 х26 0.29 0.32 0.13 0.20 0.14 31 0.84 0.03 0.00 0.19 0.12 0.18 0.19 2.30 х27 -31.27 -6.23 -2.95 -1.28 -1.37 20 0.54 29.99 4.95 1.67 0.00 0.08 29.99 0.66 х28 13.60 13.40 10.83 4.40 3.02 21 0.57 0.00 0.20 2.78 9.20 10.58 10.58 1.22 х29 -32.11 93.75 61.08 28.52 0.21 26 0.70 125.86 0.00 32.67 65.23 93.54 125.86 1.77 х30 2.94 -137.48 -230.13 -148.88 202.00 13 0.35 0.00 140.42 233.07 151.83 2.74 151.83 1.22 х31 1.17 1.42 1.20 1.19 1.12 9 0.24 0.25 0.00 0.22 0.23 0.30 0.25 0.97 х32 1.33 -27.98 -36.77 -26.27 0.04 2 0.05 0.00 29.30 38.10 27.59 1.29 38.10 0.14 х33 -27.67 176.47 87.93 32.94 -0.04 3 0.08 204.14 0.00 88.54 143.53 176.53 204.14 0.24 х34 0.01 -0.20 -0.40 -0.26 0.00 11 0.30 0.00 0.21 0.41 0.27 0.01 0.41 0.65 х35 2.90 -27.77 -30.04 -25.34 0.75 10 0.27 0.00 30.67 32.94 28.24 2.14 32.94 0.77 х36 0.88 -28.34 -29.82 -25.70 0.03 4 0.11 0.00 29.22 30.71 26.58 0.86 30.71 0.31 х37 0.15 0.30 0.17 0.16 0.11 12 0.32 0.15 0.00 0.13 0.13 0.19 0.19 1.03
dustry, low investment attractiveness of the enter-prise”.
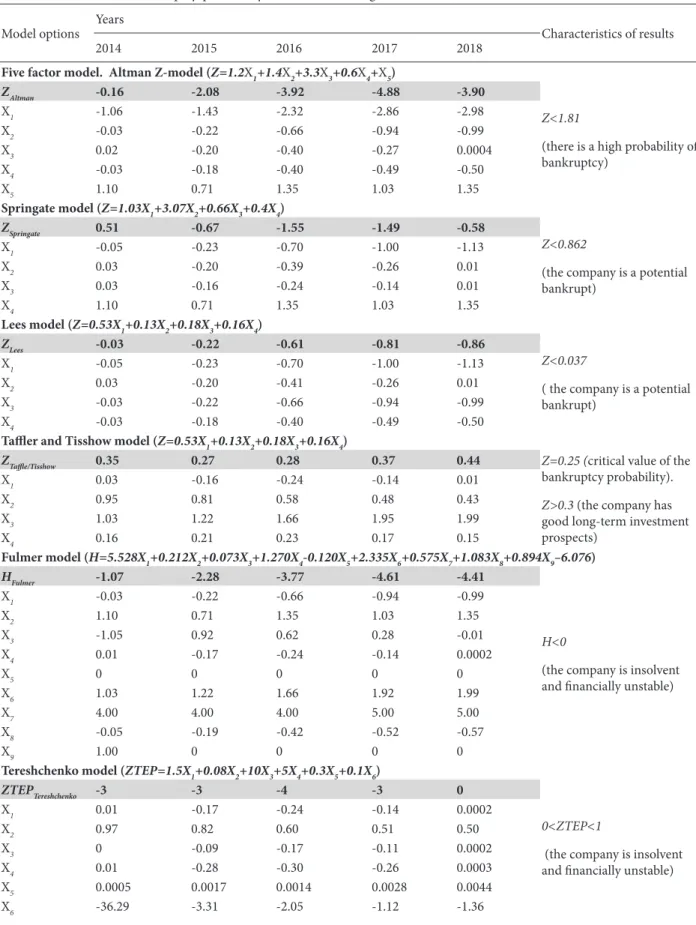
Given such a level of the enterprise’s investment attractiveness, it is crucial to assess the likelihood of bankruptcy (Table 9), which will serve as the main criterion for reaching conclusions on the accepta-bility of investment and the fulfilment of financial and investment expectations of direct investors.
The results of the bankruptcy probability as-sessment of the company confirmed the previous assumptions about its insufficient investment at-tractiveness and increased degree of riskiness of in-vestment. Also, the conclusion on the maximum closeness of the enterprise to potential bankruptcy is proven by the common nature of all the methods used. However, given the significant advantages of the enterprise in the formation of its material and technical base, the development of financial and credit relations, the expansion of trade and part-nership relations, it is expected that its investment attractiveness will increase and at the same time the probability of bankruptcy will decrease.
4. Discussion
Due to the fact that economic growth is an integral part of economic development, and business is its driving force, the processes of monitoring and man-aging investment attractiveness are part of the sys-tem of assessing the ability of business entities to withstand risks and increase their own economic potential – particularly in view of the crisis in the global economy, namely, due to the rapid fall of the world’s largest indices, which has caused investors to be more risk-averse and to reduce the volume of investment in developing countries. Nowadays, the issues of evaluating investment attractiveness and determining ways to increase it are key for inves-tors aiming to generate profit and be aware of the degree of risk, and to diversify or minimise it, as well as for companies interested in strategic busi-ness development. This raises the problem of iden-tifying the key criteria that determine investment attractiveness at the micro level (company, project),
Fig. 1. Modelling the indicators of the investment attractiveness of the enterprise
Table 9. Results of the bankruptcy probability assessment of “Avgust-Ukraine” LLC in 2014–2018
Model options Years Characteristics of results
2014 2015 2016 2017 2018
Five factor model. Altman Z-model (Z=1.2Х1+1.4Х2+3.3Х3+0.6Х4+Х5)
ZAltman -0.16 -2.08 -3.92 -4.88 -3.90
Z<1.81
(there is a high probability of bankruptcy) Х1 -1.06 -1.43 -2.32 -2.86 -2.98 Х2 -0.03 -0.22 -0.66 -0.94 -0.99 Х3 0.02 -0.20 -0.40 -0.27 0.0004 Х4 -0.03 -0.18 -0.40 -0.49 -0.50 Х5 1.10 0.71 1.35 1.03 1.35 Springate model (Z=1.03Х1+3.07Х2+0.66Х3+0.4Х4) ZSpringate 0.51 -0.67 -1.55 -1.49 -0.58 Z<0.862
(the company is a potential bankrupt) Х1 -0.05 -0.23 -0.70 -1.00 -1.13 Х2 0.03 -0.20 -0.39 -0.26 0.01 Х3 0.03 -0.16 -0.24 -0.14 0.01 Х4 1.10 0.71 1.35 1.03 1.35 Lees model (Z=0.53Х1+0.13Х2+0.18Х3+0.16Х4) ZLees -0.03 -0.22 -0.61 -0.81 -0.86 Z<0.037
( the company is a potential bankrupt)
Х1 -0.05 -0.23 -0.70 -1.00 -1.13
Х2 0.03 -0.20 -0.41 -0.26 0.01
Х3 -0.03 -0.22 -0.66 -0.94 -0.99
Х4 -0.03 -0.18 -0.40 -0.49 -0.50
Taffler and Tisshow model (Z=0.53Х1+0.13Х2+0.18Х3+0.16Х4)
ZTaffle/Tisshow 0.35 0.27 0.28 0.37 0.44 Z=0.25 (critical value of the bankruptcy probability). Z>0.3 (the company has good long-term investment prospects) Х1 0.03 -0.16 -0.24 -0.14 0.01 Х2 0.95 0.81 0.58 0.48 0.43 Х3 1.03 1.22 1.66 1.95 1.99 Х4 0.16 0.21 0.23 0.17 0.15 Fulmer model (H=5.528Х1+0.212Х2+0.073Х3+1.270Х4-0.120Х5+2.335Х6+0.575Х7+1.083Х8+0.894Х9–6.076) HFulmer -1.07 -2.28 -3.77 -4.61 -4.41 H<0
(the company is insolvent and financially unstable)
Х1 -0.03 -0.22 -0.66 -0.94 -0.99 Х2 1.10 0.71 1.35 1.03 1.35 Х3 -1.05 0.92 0.62 0.28 -0.01 Х4 0.01 -0.17 -0.24 -0.14 0.0002 Х5 0 0 0 0 0 Х6 1.03 1.22 1.66 1.92 1.99 Х7 4.00 4.00 4.00 5.00 5.00 Х8 -0.05 -0.19 -0.42 -0.52 -0.57 Х9 1.00 0 0 0 0
Tereshchenko model (ZTEP=1.5Х1+0.08Х2+10Х3+5Х4+0.3Х5+0.1Х6)
ZTEPTereshchenko -3 -3 -4 -3 0
0<ZTEP<1
(the company is insolvent and financially unstable)
Х1 0.01 -0.17 -0.24 -0.14 0.0002 Х2 0.97 0.82 0.60 0.51 0.50 Х3 0 -0.09 -0.17 -0.11 0.0002 Х4 0.01 -0.28 -0.30 -0.26 0.0003 Х5 0.0005 0.0017 0.0014 0.0028 0.0044 Х6 -36.29 -3.31 -2.05 -1.12 -1.36
at the meso level, (industry, region, competitive en-vironment) and at the macro level (the state).
Summarising the scientific controversy over the interpretation of investment attractiveness, we have come to the conclusion that this is a set of quan-titative and qualitative indicators-assessments of the investment object, which together determine the potential solvent demand for investment in the enterprise. At the same time, management of in-vestment attractiveness is the process of influenc-ing these indicators-assessments by “transforminfluenc-ing” them further, or maintaining them at a certain lev-el. We are convinced that the interpretation of the notion “investment attractiveness management” should be equated with the notion “investment po-tential”, which is characterised by a set of strategic prerequisites and factors for sustainable develop-ment of the enterprise, including by attracting ex-ternal investments.
The prerequisite and key to effective manage-ment of the investmanage-ment attractiveness of a business is its quality comprehensive assessment as an in-vestment object. This approach allowed us to dis-tinguish and apply methods of current, operational and prospective analysis and a way of responding
to “problem spots” using risk determination meth-ods, in particular, the VaR method for determin-ing currency risk and so on. The construction of an integral three-dimensional model of assessing investment attractiveness, taking into account the coefficients of the investment attractiveness of a business, enabled us to combine a comprehensive assessment of the enterprise and the market envi-ronment in which it operates.
The Ukrainian market for pesticides is dynam-ic and promising, whdynam-ich, according to experts’ pre-dictions will increase by 17% and reach USD 960 million by 2020. According to the theory of indus-try markets, this market is oligopolistic: eight of its major players occupy 74% of the market. Un-derstanding the fact that, in the context of oligop-oly, the struggle for a market share is the core of competition, it seems obvious that in order to ful-ly evaluate the investment potential of a business, it will be necessary to analyse the competitive en-vironment (industry and competitors), as well as to predict the strategic behaviour of companies in this market. The main tools for analysing and fore-casting should be the BCG matrix; McKinsey Mul-tifactor Portfolio Matrix (GE/McKinsey); kinked
Matviichuk model (Z=0.033Х1+0.268Х2+0.045Х3–0.018Х4–0.004Х5–0.015Х6+0.702Х7)
ZMatviichuk 1.93 1.76 0.63 0.13 -0.06
Z<1.104
(there is a threat of financial and investment crisis and the probability of bankruptcy increases) Х1 51.62 54.09 23.54 12.23 5.96 Х2 1.22 0.60 0.72 0.48 0.60 Х3 -1.07 -0.46 -0.43 -0.27 -0.68 Х4 0.67 1.01 0.81 0.98 0.76 Х5 -0.05 -0.19 -0.42 -0.52 -0.57 Х6 1.03 1.22 1.66 1.95 1.99 Х7 -0.03 -0.18 -0.40 -0.49 -0.50
Four factor model of bankruptcy risk forecasting (R=8.380Х1+Х2+0.054Х3+0.630Х4)
Rmodel -0.66 -1.21 -5.34 -8.29 -9.41
R<0
(there is a maximum likeli-hood of bankruptcy) Х1 -0.05 -0.23 -0.70 -1.00 -1.13 Х2 -0.32 0.94 0.61 0.28 0 Х3 1.10 0.71 1.35 1.03 1.35 Х4 0.04 -0.36 -0.25 -0.40 0 Postiushkov model (Z=0.125Х1+2.5Х2+0.04Х3+1.25Х4) ZPostiushkov -0.08 0.07 -1.47 -2.57 -3.24 Z<1
(there is a threat of financial and investment crisis and the probability of bankruptcy increases) Х1 0.95 0.81 0.58 0.48 0.43 Х2 -0.05 -0.24 -0.73 -1.10 -1.32 Х3 0.37 0.25 0.31 0.26 0.33 Х4 -0.07 0.44 0.22 0.08 -0.0001
Source: Designed by the authors
demand curve (Gutenberg diagram); game theory: Bertrand/Forheimer models (for pricing policy con-trol) and Cournot/Stackelberg models (for sales vol-ume control).
However, recent research in behavioural eco-nomics, including Richard H. Taller (2018), as well as the work of Daniel Kahneman and Amos Tver-sky (1979), has shown that the market is no less dependent on the behaviour of its players, who are often irrational, than on the influence of fundamen-tal economic factors.
As we can see, at the current stage of economic development, in order to achieve investment attrac-tiveness and efficient management of the investment potential of the company, it is necessary to carry out a comprehensive analysis of it at micro, meso and macro levels using effective valuation tools and fi-nancing analysis. The result of such work should be a universal model for managing the investment at-tractiveness of the enterprise.
However, financing and investing, which are in-terconnected, have traditionally been implemented using two methods: the weighted average cost of marginal capital (WACC), that is, the cost of financ-ing additionally required to implement the project, and the adjusted net present value, or APV.
A set of solved problems (systematic consider-ation of risk in the formconsider-ation of financing struc-ture, the possibility of balancing it, the mechanism to justify the acceptable level of risk, taking into ac-count various factors that affect the choice of source of funding, a clear relationship between the capital structure of the project and its effectiveness, justifi-cation of the choice of discount rate, the possibility of using short- and long-term sources of funding, improving the methodology for calculating the APV performance index) altogether help to carry out the task of forming the optimal capital structure of the project, ensuring its high efficiency and security im-plementation on the one hand and high investment attractiveness on the other.
5. Conclusions
At the stage of determining the theoretical and methodological foundations of a company’s invest-ment attractiveness, it was found that, according to
the scientists, a company’s investment attractiveness should be determined not only at the micro-level, but also at the level of the industry in which it op-erates. The investment attractiveness of the region and the country as a whole must also be taken into account.
In the first place, it was decided to evaluate the investment attractiveness at the macro-economic level by the indicators of socio-economic attractive-ness, legal attractiveness and investment risks. Thus, it was established that in Ukraine, after a slight two-year decline of 3%, the indicators of socio-economic attractiveness began to grow. The level of ease of do-ing business increased. In 2018, Ukraine improved its position by 76 points and ranked 76th out of 191 countries, while the country’s investment attractive-ness index was 0.017. Therefore, we can conclude that the investment attractiveness of Ukraine is in-creasing, but there are still reasons that impede fur-ther positive dynamics.
To evaluate the investment attractiveness at the meso-level, we considered the indicators that deter-mine the levels of prospects of the industry, the po-sitioning of the enterprise in the industry market and investment sectoral risks. The study showed that the plant protection industry in which the company operates increased its volumes of sales by 26.72%. At the same time, the stable growth of the indus-try over the last years has been proven. According to the level of positioning of the enterprises partic-ipating in the sectoral market, 10 of the 100 enter-prises operating in this market occupy 80% of the total market. The assessment of investment sectoral risks was conducted on the basis of an expert sur-vey, according to which the index was 0.091. Thus, the investment attractiveness of the Ukrainian mar-ket for plant protection products was estimated at 0.412. Given the active development of farms in the country and the potential opening of the domes-tic land market, the investment attractiveness of the market will increase.
To assess the investment attractiveness of the enterprise at the micro level, the method of calcu-lating the integral indicator was used. For this pur-pose, many indicators were formed, actual values of the indicators were determined, the indicators were normalised and weighted factors were singled out. Then the integral index of enterprise’s investment attractiveness was calculated. An empirical
evalu-ation of the investment attractiveness of the enter-prise was carried out based on the methodological toolkit of the principal component method. As a result, it was concluded that “Avgust-Ukraine” LLC has a significant need of investment capital to en-sure its proper functioning and development. At the same time, the investment attractiveness of the company is optimally acceptable (at the level of 0.493). According to the data obtained, a graph-ical model of the enterprise’s investment attrac-tiveness was devised, which was developed by the authors. This model is formed on the basis of three axes – one vertical and two horizontal. The verti-cal axis illustrates the investment attractiveness of “Avgust-Ukraine” LLC (0.493), while the horizontal axes define the indices of the investment attractive-ness of the industry (0.468) and the country (0.325) in which the enterprise operates. According to the data obtained, at the beginning of 2019, the level of the enterprise’s investment attractiveness was con-sidered to be optimally acceptable. The results of the use of the author model confirm all the previ-ous calculations, which indicate a high probability of its use for evaluating the investment attractive-ness of other enterprises.
References
Akhmetshin, E. Artemova, E. Vermennikova, L. Shi-chiyakh, R. Prodanova, N. and Kuchukova, N. (2017). Management of Investment Attractiveness of Enterprises: Principles, Methods, Organization.
Inter-national Journal of Applied Business and Economic Re-search. Serials Publications Pvt. Ltd. 15(23).
Altman, E.I. Hotchkiss, E. and Wang, W. (2019). Corpo-rate Financial Distress, Restructuring, and Bankrupt-cy: Analyze Leveraged Finance, Distressed Debt, and Bankruptcy. Wiley Finance, 4th Edition
Davidson, P. (1968). Money, Portfolio Balance, Capi-tal Accumulation, and Economic Growth”.
Econo-metrica. 36(2): 291–321. DOI: https://doi. org/10.2307/1907491
Doing Business. Measuring Business Regulations, 2019. http://www.doingbusiness.org
Domar, E.A. (1952). Theoretical Analysis of Economic Growth. AER. 137.
Dorofeev, M.L. (2009). Peculiarities of Application of Franchon and Roman’s Financial Strategy Matrix in Strategic Financial Analysis of the Company. Finance
and Credit. 23(359): 51–56.
Dorożyński, T. and Kuna-Marszałek, A. (2016). In-vestment Attractiveness. The Case Of The Visegrad Group Countries. Comparative Economic Research, 19(1). DOI: https://doi.org/10.1515/cer-2016-0007/
Evolutionary Theories of Economic and Techno-logical Change: Present Status and Future Pros-pects, (2018). Edited by P. Paolo Saviotti and J.
Stanley Metcalfe. USA, Routledge. DOI: https://doi. org/10.4324/9781351127707
Fragile States Index (2019). https://fragilestatesindex.org
Gitman, L.J. Joehnk, M.D. Smart, S. Juchau, R. Ross, D. and Wright, S. (2011). Fundamentals of Investing.
Prentice Hall. 593.
Goncharuk, A.G. and Karavan, S. (2013). The Invest-ment Attractiveness Evaluation: Methods and Meas-urement features. Polish Journal of Management
Studies. 7: 160—166.
Graham, B. (1962). Some Investment Aspects of Accu-mulation Through Equities. The Journal of Finance. 17(2): 203–214. DOI: https://doi.org/10.2307/2977419
Harrod, R. (1952). Economic Essays. London,
Macmil-lan. 140.
International Institute for Management Development (2019). https://www.imd.org
International Valuation Standards. https://www.ivsc. org/standards/international-valuation-standards/con-sultation/IVS-review
Jantoń-Drozdowska, E. and Majewska, M. (2016). Investment Attractiveness of Central and East-ern European Countries in the Light of New Lo-cational Advantages Development. Equilibrium.
Quarterly Journal of Economics and Economic Poli-cy, 11(1): 97-119, DOI: http://dx.doi.org/10.12775/ EQUIL.2016.005
Kahneman, D. and Tversky, A. (1979). Prospect Theo-ry: An Analysis of Decisions under Risk //
Economet-rica. 47(2). Mar.
Keynes, J.M. (2013). The General Theory of Employ-ment, Interest and Money. The Postulates of the Clas-sical Economics. Cambridge, King’s College. 340. Koyuda, V.O. Lepeyko, T.I. and Koyuda, A.P. (2008).
Fundamentals of Investment Management: Tutorial. manual. K.: Condor. 340.
Majewska-Bator, M. and Jantoń-Drozdowska, E. (2007). International knowledge spillovers and the
impor-The proofreading of articles, positively reviewed and approved for publishing in the ‘Bulletin of Geography. Socio-economic Series’, was financed from the funds of the Ministry of Science and Higher Education earmarked for activities popularizing science, in line with Agreement No 695/P-DUN/2018. tance of human capital in this process: empirical
re-search for Poland. In W. M. Grudzewski, I. Heiduk, S. Trzcieliński (Eds). Organizations in Changing En-vironment. Current Problems, Concepts and Methods of Management, Poznań: IEA Press.
Mustafakulov, S. (2017). Investment Attractiveness of Regions: Methodic Aspects of the Definition and Classification of Impacting Factors. European
Scien-tific Journal. 13(10).
Panukhnyk, O. Popadynets, N. and Fedotova, Y. 2019. Analysis and modeling of factor determinants of food provision at consumer market of Ukraine.
Glob-al JournGlob-al of EnvironmentGlob-al Science and Manage-ment, 5(SI): 215-226. DOI: https://doi. org/10.22034/ GJESM.2019.05.SI.24
Schumpeter, J. A. (1954). History of Economic Analy-sis. Great Britain, Allen and Unwin (Publishers) Ltd. Solow, R.M. (1956). A Contribution to the Theory of
Economic Growth. Quarterly Journal of Economics.
70(1): 65-94. DOI: https://doi.org/10.2307/1884513
Stroeva, O. Shinkareva, L. Lyapina, I. and Petruchina, E. (2015). Optimization of Approaches to the Man-agement of Investment Projects in Regions of Rus-sia. Mediterranean Journal of Social Sciences. 6(3), S6. DOI: https://doi.org/10.5901/mjss.2015.v6n3s6p87
Strokov, A. (2014). The Methodological Aspects of As-sessing the Attractiveness of Investments made into Financial Assets and Real Projects. Life
Sci-ence Journal. 11(10). https://www.researchgate.net/ publication/290571327_The_methodological_as- pects_of_assessing_the_attractiveness_of_invest-ments_made_into_financial_assets_and_real_projects
Strokovych, H.V. (2011). Enterprise strategy. People’s Ukrainian Academy. Kharkiv: Publishing House of
PUA. 180.
SuperAgronom.com. Plants protecting tools, (2019).
https://superagronom.com/news/zzr
Taller, R. (2018). Zachowania niepoprawne. Media
Ro-dzina. 440.
The World Bank, (2018). Doing Business Report. http:// www.doingbusiness.org/en/reports/global-reports/do-ing-business-2018
The World for Peace, (2018). Fragile States Index.
http://fundforpeace.org/fsi/category/analysis/frag-ile-states-index-2018-analysis/
Ushakov, D.S. (2011). The Problems of Country’s In-novative Capacity and Investment Attractiveness Growth Synchronization. Research Journal of
Busi-ness Management, 5(4).
Vasyltsiv, T. Lupak, R. and Osadchuk, Y. (2017). Assess-ment of the level of penetration of import depend-ence in the context of the import substitution policy in Ukraine. Economic Annals-XXI, 167 (9-10): 13-17. DOI: https://doi.org/10.21003/ea.V167-03
Weaver, P. Jansen, L. van Grootveld, G. van Spiegel, E. and Vergragt, P. (2017). Sustainable Technolo-gy Development. USA, Routledge. DOI: https://doi. org/10.4324/9781351283243
Williamson, O. (1998). Mechanisms of Governance. New York: Oxford University Press.
World Economic Forum. https://www.weforum.org/re-ports
Yakupova, N. Levachkova, S. Iskhakova, G. Kadoch-nikova, E. and Lelyuk, A. (2017). Integral Assess-ment of the Enterprise InvestAssess-ment Attractiveness: Testing the Hypothesis of Non-Conformity to In-vestor’s Interest. Journal of Engineering and Applied
Sciences, 12(19): 4927-4930.
Zhukovskaya, I. Shinkevicha, A. Yaluninab, E. Lush-chikc, E. Zhukovad, M. Mokhovad, G. and Os-tanina, L. (2016). Features of Economic Zones’ Regulation in terms of Economic Instability.
Inter-national Journal of Environmental and Science Edu-cation. 11(18). https://pdfs.semanticscholar.org/61a4/ ea8da8bc0484b704557 adabb272fb42207c5.pdf