Date Accepted: 16.12.2019 2020, Vol. 28(43), 119-134
Forecasting Stock Market Indices with the Composite Leading
Indicators: Evidence from Turkey
Esra Nazmiye KILCI (https://orcid.org/0000-0002-2239-4560), Department of International Trade and Finance, İstanbul Arel University, Turkey; e-mail: [email protected]
Hisse Senedi Endekslerinin Bileşik Öncü Göstergeler Endeksi Kullanılarak
Tahmin Edilmesi: Türkiye Örneği
Abstract
The objective of this study is to evaluate the empirical performance of composite leading indicators (CLIs) in forecasting stock market indices for Turkey in the period from 2007:03 through 2019:07. After examining the stationarity of the series by using Narayan and Popp (2010) and Enders and Lee (2012) Fourier ADF unit root tests, the causality relationship from the composite leading indicators to stock market indices are tested by employing Enders and Jones (2016) Fourier Granger causality test. The results support the evidence of a causality relationship from composite leading indicators to BIST100, BIST Financial and BIST Industrial Indexes under structural breaks.
Keywords : Composite Leading Indicators, Stock Market Indices, Structural Breaks.
JEL Classification Codes : C10, E44, G10. Öz
Bu çalışmanın amacı, Türkiye’de, bileşik öncü göstergeler endeksinin (MBÖNCÜ-SÜE) kullanılarak hisse senedi endekslerinin tahmin edilebilirliğinin 2007:03-2019:07 dönemi için araştırılmasıdır. Analizde, serilerin durağanlığının test edilmesi için, Narayan ve Popp (2010) ve Enders ve Lee (2012) Fourier ADF birim kök testlerinin uygulanmasını takiben, bileşik öncü göstergeler endeksinden hisse senedi endekslerine olan nedensellik ilişkisinin araştırılması için Enders ve Jones (2016) Fourier Granger nedensellik testi kullanılmaktadır. Bu testlerin kullanılmasıyla, analizde yapısal kırılmalar dikkate alınmaktadır. Analiz sonuçları, bileşik öncü göstergeler endeksinden BIST100, BIST Finansal ve BIST Sınai endekslerine doğru bir nedensellik olduğuna işaret etmektedir.
Anahtar Sözcükler : Bileşik Öncü Göstergeler, Hisse Senedi Endeksleri, Yapısal Kırılmalar.
1. Introduction
Forecasting of recession, swings and reversals in economic activity has been a rather powerful motive for policy makers, economists, researchers and businesses. With the development of the appropriate tools of forecasting, it is seen that the methodology which tries to synthesize the factors that are linked with the changes in economic development has also developed. One outcome of methodological experimentation is forming some leading indexes of economic activity that would bring close together the partial economic indicators. These leading indexes, of which current behavior is closely linked with the changes in the future, aim to give early information about the future economic activity and signal to turning points in business cycles (Dovolil, 2016). Therefore, developing of early warning systems taking into account the turning points contribute significantly to policy makers, investors and businesses in their decision-making processes. Hence, they have the ability to analyze the economic performance in a timely manner in the short and long-run.
Investors and the other participants in the financial markets intensely rely on forecasts of stock exchange indices and turning points because such predictions allow them to readjust their portfolios. In this study, we focus on the relationship between composite leading indicators and stock market indices for Turkey. Recently, interest in the use of composite leading indicators (CLIs) in forecasting macro-financial variables has grown. CLIs approach has been widely used in several studies but we see that it has been frequently used in forecasting business cycles. Using this approach in forecasting stock market indices is indeed new and there are very few studies in Turkey focusing on this issue. Therefore, in this study, we aim to examine the predictive ability of the composite index of leading economic indicators to forecast future movements in stock market indices, one of the important indicators relating to financial markets. There are a few previous examinations of predictive performance in Turkey. Unlike previous evaluations, we use Fourier framework, which takes into account multiple structural breaks in the analysis. Given that the composite leading indicators have been pretty strong in giving early information about future turning points and there are a few studies exist which try to analyze the impact of CLIs on stock market index for Turkey, we believe that this study will be very useful in terms of researchers.
In this analysis, the non-stationary properties of the series are tested by using Narayan and Popp (2012) and Enders and Lee (2012) unit root tests. It is seen that both these tests have good size and power properties. While, Narayan and Popp (2010) unit root test takes into account two multiple structural breaks, Enders and Lee (2012) Fourier ADF unit root test allows for the estimation of multiple structural changes with Fourier functions in testing the stationary of series. Particularly in Enders and Lee (2012) Fourier ADF unit root test, contrary to many other methods, it is not necessary to know the number, form or date of the structural changes. In the second stage, the causality relationship is analyzed by employing Enders and Jones (2016) Fourier Granger causality test. The period ranges from 2007:03-2019:07 in which we witness significant deterioration in both global and Turkey’s macroeconomic outlook. The VAR with Fourier frequencies which has been proposed by
Enders and Jones (2016) yields highly strong results. After introducing trigonometric functions into the model, they find a richer set of interactions between the variables.
The remainder of the study is organized as follows. Section 2 gives information about the OECD system of composite leading indicators (CLIs) which is developed by OECD in the 1970s and the Central Bank of the Republic of Turkey methodology which is used in constructing the CLIs framework for Turkey. Section 3 focuses on the literature review and gives information about the other studies analyzing the relationship between composite leading indicators and macro-financial variables. Section 4 presents the data, methodology and performance of the analysis, trying to test whether the CLIs do have forecasting impact on BIST100, BIST Financial and BIST Industrial stock market indices in Turkey. Finally, Section 5 concludes by providing a summary, giving some policy implications.
2. A Brief Information on Composite Leading Indicators Methodology of OECD and CBRT
An effective way to forecast turning points is to benefit from some leading macroeconomic indicators which are data series that tend to be correlated to business activity. Nevertheless, experiences in many countries have revealed that the use of only one economic indicator for short-term forecasting is not reliable since some leading series might produce inadequate or false signals of future changes. Composite leading indicators (CLIs) have been developed in many countries with the objective of providing a more comprehensive measure of economic activity. CLIs are basically based on a group of economic indicators, which have relationship with the economic activity and allow the government and businesses to monitor the performance of the economy and to predict it in the short-run. In other words, CLIs provide early signals of turning points between slowdowns and expansions (Atabek et al., 2005).
The using of leading indicators, which have been mostly applied to business cycles, goes back to 1930s when the first leading indicators approach was established by the National Bureau of Economic Research (NBER) in U.S. The main methodology used in constructing leading indicators to forecast the turning points in economic activity is still very similar to that developed by the NBER in the 1930s and 1940s (Binner et al., 2005). At the present time, the CLIs approach is one of the techniques used by OECD to determine what the macroeconomic data tell what happens currently and what might happen in the future. To put it simply, the CLIs put together individual indicators for a given country to anticipate when economic expansion starts to enter a downturn, or when growth starts to return. According to the definition of OECD (2019), the composite leading indicator is constructed to develop early signals of turning points in business cycles, indicating fluctuations of the economic activity around its long term potential level. CLIs exhibit short-term economic changes in qualitative instead of quantitative terms. The CLIs component series are selected from a broad range of key short-term economic indicators (170 in total, or between 5 and 10 for each country), which reflect different sectors of the economy and provide a measure of future economic activity.
As stated in the study by Gyomai and Guidetti (2012), OECD CLIs are created to estimate cycles in a reference series selected as a proxy for economic activity. In this regard, changes in economic activity are quantified as the variation in economic output relative to its long term potential. The difference between potential and real output is frequently called as the output gap and the movements in the output gap as the business cycle. Here, the output gap is not directly observable, in fact, it is anticipated as part of the whole CLI constructing process. OECD CLIs are built from economic time series which have similar cyclical movements to those of the business cycle but, and significantly, which come before those of the business cycle. When compared with the gross domestic product (GDP), an obvious alternative to CLIs, it is seen that GDP official estimates are generally announced quarterly, while CLIs are measured on a monthly basis. The industrial production index (IPI), which is another strong alternative and announced monthly and also historically exhibits pretty similar movements with GDP, was used as a reference series by the OECD system of CLIs until March 2012. However, in March 2012, the OECD examined that if methods could be implemented to produce monthly estimates of GDP based on the official quarterly estimates. After finding out it is possible to do so, since April 2012, the OECD has switched to using GDP as the reference series, ceasing to rely on the IPI as an intermediate target (Gyomai & Guidetti, 2012).
In the countries including Turkey, it is seen that the CLIs are obtained by weighting the relevant variables taking into account the macroeconomic structures of the countries and are determined and announced by the central bank of each country. The information presented by this indicator is of great importance for policy makers, economists and businesses for the temporal analysis of the current and short-term economic situation. After the authorized unit of the central bank primarily determines a methodology that is compatible with the macroeconomic dynamics of their country and which is in line with the OECD’s methodology, forms the data sets according to this methodology. Therefore, the CLIs methodology of each country might differ. As a result of the joint work carried out by the CBRT with the OECD in order to anticipate the growth and contraction periods in economic activity, the composite leading indicators index for economic activity has been established. The first stage of forming CLIs index is the selection of the variables which are called reference series and which will be used as indicators of economic activity. Gross domestic product (GDP) and industrial production index (IPI) are generally used as indicators of economic activity. In the method of leading indicators, it is preferred to use an announced series with both higher frequency and less delay as the reference series. After selection of the reference series, a database including variables that could be related to economic activity is created (Gulhan et al., 2012).
3. Literature Review
Macroeconomic variables do have impacts not only on future consumption and investment opportunities but also they have a key role in determining the movements of stock market (Chen, 2009). Therefore, the impact of macroeconomic factors and cyclical fluctuations on the stock markets is an important issue which is taken into consideration by researchers, investors and policy makers. In particular, investors take into account
macroeconomic fluctuations in risk management and portfolio adjustment processes. The composite leading indicators, which are used to predict such fluctuations, include more information than individual macroeconomic indicators, which makes their reliability increase. Given that the key role of composite leading indicators in forecasting contractions and expansions in economic activity and the function of predictions in stock markets, it is expected a relationship between the composite leading indicators and stock markets. There are numerous studies in the academic literature on the effects of cyclical fluctuations on stock markets for U.S. and European countries. However, it is seen that there are few studies on the subject in developing countries especially for Turkey. For instance, it is seen that some studies including of Murutoglu (1999), Alper (2000), Altug and Uluceviz (2011) and Atabek et al. (2014) focus on creating of composite leading indicators, while Hacihasanoglu and Soytas (2011), Gulhan et al (2012), Topcu and Unlu (2013), Topcu (2014) and Eyuboglu and Eyuboglu (2019) try to analyze the relationship between composite leading indicators and stock market indices. In this section, we give information about the studies which examine the relationship between macroeconomic factors and stock markets at first and then deal with the studies the impacts of composite leading indicators on stock market indices in Turkey.
Rapach et al. (2005) investigate a group of macroeconomic variables by using data of 12 advanced economies in the period after 1970. They suggest that stock returns might be predicted using macroeconomic variables and interest rates are the most consistent and reliable predictors of stock returns across the countries. In another study carried out by Chen (2009) attempt to find out whether recessions in the stock markets could be anticipated by using the macroeconomic variables such as aggregate output, inflation rate, unemployment rate, interest rate spread, money stock, government debt, federal funds rate and nominal exchange rate. Empirical evidence of the analysis by using monthly data on the S&P 500 price index suggests that yield curve spreads and inflation rates among the macroeconomic variables are the most effective forecasters of recessions in the U.S stock market, according to both in-sample and out-of-sample estimating performance. Furthermore, comparing the bear market forecasting to the stock return predictability demonstrates that it seems easier to forecast bear markets utilising macroeconomic variables in the analysis.
Although there are few studies which focus on the impact of composite leading indicators on stock market indices in Turkey, it is seen that there are plenty of studies which analyze the relationship between macroeconomic variables and stock market indices. In one of these studies, Albeni and Demir (2005) analyze the macroeconomic variables that affect the stock prices in Istanbul Stock Exchange (ISE) by using time series data for the period of 1991-2000 and show that some macrofinancial variables such as deposit interest rates, international portfolio investments and foreign exchange rates do have impacts on stock prices although these variables have diferent impacts in explaining the price movements. Similarly, Yilmaz et al. (2006) examine the cointegration and causality relationship between stock prices and macroeconomic variables by using the period from 1990:01 to 2003:12. They find that while there is one way causality relationship from consumer price index and interest rates to stock prices and also two-way causality relationship between money supply, foreign exchange rates and stock prices, there is no causality from foreign trade balance and
industrial production index to stock prices. Altintas and Tombak (2011), after investigating macro-financial variables that have a role in determining stock prices in Turkey through quarterly data for the period of 1987-2008, find the evidence supporting a positive and long-run relationship between the variables as international reserves, real effective rate, economic growth and stock prices and also a negative and long-run relationship between monetary expansion and stock prices.
Although composite leading indicators include more information than individual macroeconomic indicators, which makes their reliability increase, it is seen that there are only a few studies which concentrate on the impact of composite leading indicators especially on the stock market indices in Turkey. For instance, Hacihasanoglu and Soytas (2011) examine the relationship between composite leading indicators and stock market indices as financial, services, technology, industrial and transportation over the period of 2001:07-2010:02. Their findings reveal the positive relationship between the CLIs and sectoral indices except the defense and services indices. On the other hand, they indicate that the short-term shocks in macroeconomic indicators positively affect all sectoral indices at the beginning, although this effect disappears in a one-year period. Gulhan et al. (2012) also try to analyze the relationship between composite leading indicators and stock market indices in an international dimension by taking into account nine European countries including England, Germany, Spain, Italy, France, Netherlands, Belgium, Austria and Turkey and five Asian countries including India, China, Indonesia, Korea and Japan as well as some other countries as U.S.A, Canada, Brazil and Mexico. After using the monthly data covering the period of 2000:01-2010:12, they find out CLIs do have a significant impact on the stock market indexes of all countries except Germany. Moreover, Topcu and Unlu (2013) investigate the relationship between CLIs and stock prices by using monthly data for a group of countries including Brazil, China, Chile, Czech Republic, Hungary, Indonesia, India, South Korea, Mexico, Poland, Russia, South Africa and Turkey in the period of 2000:M1-2011:M10. Although their findings do not reveal the presence of a long-run relationship between the CLIs and stock prices, they find bidirectional causality relationship between the variables. In addition, they conclude that the structure of CLIs’ and financial development level are meaningful in determining the effectiveness of CLIs’ on investment decisions in stock markets. In another study, Topcu (2014), test the long-run and causality relationship between ISE-100 and composite leading indicators in the period of 2011:01-2014:02 and again find out that there is no long-run relationship between variables while there is a one-way causality relationship from CLIs to stock prices. Finally, in their study, Eyuboglu and Eyuboglu (2019) analyze the short-run and long-run relationships between the CLIs and 12 stock market indices for Turkey in the period of 2006:01-2016:01. On the contrary to the results of Topcu (2014), their findings support the evidence of both long-run and short-run impacts of CLIs’ on stock market indices implying that investors take into account the CLIs in their decision-making processes in Turkey.
4. Empirical Analysis
We simply look for the answer of that question whether composite leading indicators lead to movements in stock market indices in Turkey for the period from 2007:03 through
2019:07. The period covers a quite large period in which we have seen critical financial fluctuations globally. Following testing the stationary properties of variables with the help of Narayan and Popp (2010) and Enders and Lee (2012) Fourier ADF unit root tests, we then proceed to test whether there is a causality relationship from the composite leading indicators to each of the series of stock market indices including BIST100, BIST Financial, BIST Industrial by using Enders and Jones (2016) Fourier Granger causality test. In the analysis, if the asymptotic p-values are below 0.05 as stated in the study of Enders and Jones (2016), we therefore can identify a causality relationship between the variables which signaling that composite leading indicators do have impact on stock market indices and hence on the financial markets in Turkey. Enders and Jones (2016) emphasize that when Fourier functions are used in the analysis, multiple structural breaks are taken into consideration and the findings can significantly change.
4.1. Data
In the analysis, we use the composite leading indicators index, which is defined as MBONCU-SUE by CBRT, constructed for the Turkish economy. According to the information obtained from CBRT official site, CBRT MBONCU-SUE is formed by combining a variety of component indicators which are related with Gross Domestic Product (GDP). MBONCU-SUE aims to provide information on short-term economic movements, particularly at the turning points. Therefore, MBONCU-SUE gives information about the expansions and the contradictions in the economic activity rather than the amplitude of the changes. A value of above (below) 100 shows that economic activity is above (below) its long-term trend. In this study, our data set covers the period 2007:03-2019:07. Although this sample seems smaller when compared to the samples used in the studies on the other developed economies like U.S.A and some Euro-Area countries including Germany, U.K and France, we think that our data set meets minimum requirements to carry out our analysis. Furthermore, our period covers the 2008-09 Global Financial Crisis, 2010-2014 Euro-Area Debt Crisis and 2016-2018 period in which the political risk increased significantly in Turkey.
Table: 1
Data Definitions and Sources for Turkey
Variable Series Frequency Source
CLIs Composite leading indicators Monthly CBRT
BIST100 BIST100 stock market index Monthly CBRT
BISTFIN BIST financial index Monthly CBRT
BISTIND BIST industrial index Monthly CBRT
Notes: CLIs and BIST series are acquired from the Central Bank of the Republic of Turkey website (<https://evds2.tcmb.gov.tr/index.php?/evds/serieMarket>, 17.08.2019).
Table 1 presents our variables, their frequencies and the source which we obtain from. Our dependent variable is CLIs in our analysis. Below is the graph belonged to CLIs in Turkey for the analysis period. According to the Graph 1, there seems a severe deterioration in the period which signals to 2008-09 Global Financial Crisis. However, in the period pointing to 2010-14 Euro-Area Debt Crisis, the CLIs seem more stable although it presents a decreasing trend. Again in the period signaling to the year of 2018, in which we have
experienced a dramatic increase in foreign exchange rates and also have witnessed a quite negative outlook in terms of macroeconomic indicators in Turkey, we see a significant downward trend in the trend of CLIs.
Graph: 1
Composite Leading Indicators; 2007:03-2019:07
Source: CBRT, <https://evds2.tcmb.gov.tr/index.php?/evds/serieMarket>, 17.08.2019.
Graph: 2
BIST 100, BIST FINANCIAL, BIST INDUSTRIAL; 2007:03-2019:07
──BIST100, ──BISTFINANCIAL, ──BISTINDUSTRIAL
The independent variables are stock market indices including BIST100, BISTFIN and BISTIND in our analysis. Above is the graph that is belonged to these indices for the analysis period. As seen from the Graph 2, the indices take their lowest values at the beginning of 2009 and they do have decreasing trends in the late 2018. Consequently, the trend seems to be consistent with the trend of CLIs in Graph 1.
4.2. Methodology, Performance of the Analysis and Results
In order to assess the forecasting ability of the composite leading indicators, at first, we try to get adequate information on the stationarity properties of the variables being used in the analysis by employing Narayan and Popp (2010) as well as Enders and Lee (2012) Fourier ADF unit root tests. Both tests are based on augmented Dickey-Fuller type test. In this context, Narayan and Popp (2010) develope an augmented Dickey-Fuller-type test for unit roots which allows for two structural breaks while Enders and Lee (2012) propose a new unit-root test by using Fourier function in the deterministic term in a Dickey-Fuller type regression framework that can complement the Fourier LM and DF-GLS unit root tests and accounts for multiple structural breaks. It is seen that both these tests do have good size and power properties. Furthermore, in the Fourier ADF (2012) unit root test, contrary to many other methods, it is not essential to know the number, form or date of the structural changes. Narayan and Popp (2010) think two different specifications by allowing for two breaks in the level of a trending data series and two breaks in the level and slope of a trending data series. In the model, the date of breaks are considered to be unknown. The data generating process (DGP) of a time series 𝑦𝑡, which they present, does have two components; (𝑑𝑡), deterministic component and (𝑢𝑡) stochastic component as follows:
𝑦𝑡= 𝑑𝑡+ 𝑢𝑡 (1)
𝑢𝑡= ρut−1+ 𝜀𝑡 (2)
𝜀𝑡= 𝜓∗(𝐿)𝑒𝑡= 𝐴∗(𝐿)−1𝐵(𝐿)𝑒𝑡 (3)
with 𝑒𝑡~𝑖𝑖𝑑(0, 𝜎𝑒2). 𝐴∗(𝐿) and B(𝐿), the roots of the lag polynomials which are of order p and q, are assumed to lie outside the unit of circle.
Of two different specifications which they consider both for trending data, M1 allows for two breaks in level and the M2 allows for two breaks in level as well as slope. The specifications of both models differ in how the deterministic component, 𝑑𝑡 , is defined as follows: 𝑑𝑡𝑀1= 𝛼 + 𝛽𝑡 + 𝜓∗(𝐿)(𝜃1𝐷𝑈 1,𝑡 | + 𝜃2𝐷𝑈2,𝑡| ) (4) 𝑑𝑡𝑀2= 𝛼 + 𝛽𝑡 + 𝜓∗(𝐿)(𝜃1𝐷𝑈1,𝑡 | + 𝜃2𝐷𝑈2,𝑡| + 𝛾1𝐷𝑇1,𝑡| + 𝛾2𝐷𝑇2,𝑡| ) (5) 𝐷𝑈1,𝑡| = 1(𝑡 > 𝑇𝐵,𝑖| ), 𝐷𝑇1,𝑡| = 1(𝑡 > 𝑇𝐵,𝑖| )(𝑡 − 𝑇𝐵,𝑖| ), i=1,2. (6)
Here, the true break dates are denoted by 𝑇𝐵,𝑖| , 𝑖 = 1,2, . 𝜃1 and 𝛾𝑖, the parameters, show the magnitude of the level and slope breaks, respectively. The inclusion of 𝜓∗(𝐿) in Equations (4) and (5) make breaks occur slowly over time. This process which is known as the IO model is used. Accordingly, the IO-type test regressions to test for the unit root hypothesis for M1 and M2 could be derived by merging the structural model (1)-(5). The test equations for M1 and M2 do have the following forms, respectively:
𝑦𝑡𝑀1= 𝜌𝑦𝑡−1+ 𝛼1+ 𝛽∗𝑡 + 𝜃1𝐷(𝑇𝐵 | )1,𝑡+ 𝜃2𝐷(𝑇𝐵 | )2,𝑡+ 𝛿1𝐷𝑈1,𝑡−1 | + 𝛿2𝐷𝑈2,𝑡−1 | + ∑𝑘𝑗=1𝐵𝑗∆𝑦𝑡−𝑗+ 𝑒𝑡 (7)
with 𝛼1= 𝜓∗(1)−1[(1 − 𝜌)𝛼 + 𝜌𝛽] + 𝜓∗|(1)−1(1 − 𝜌)𝛽, the mean lag being 𝜓∗|(1)−1, 𝛽∗= 𝜓∗(1)−1(1 − 𝜌)𝛽, 𝜙 = 𝜌 − 1, 𝛿 𝑖= −𝜙𝜃1 and 𝐷(𝑇𝐵 | )1,𝑡= 1(𝑡 = 𝑇𝐵,𝑖 | + 1), i=1,2. 𝑦𝑡𝑀2= 𝜌𝑦𝑡−1+ 𝛼∗+ 𝛽∗𝑡 + 𝜅1𝐷(𝑇𝐵 | )1,𝑡+ 𝜅2𝐷(𝑇𝐵 | )2,𝑡+ 𝛿1∗𝐷𝑈1,𝑡−1 | + 𝛿2∗𝐷𝑈2,𝑡−1 | + 𝛾1∗𝐷𝑈𝑇1,𝑡−1 | + 𝛾2∗𝐷𝑈𝑇2,𝑡−1 | + ∑𝑘𝑗=1𝐵𝑗∆𝑦𝑡−𝑗+ 𝑒𝑡 (8)
where 𝜅𝑖= (𝜃𝑖+ 𝛾𝑖), 𝛿𝑖∗= (𝛾𝑖− 𝜙𝜃𝑖) and 𝛾𝑖∗= −𝜙𝛾𝑖), i=1,2.
We use the t-statistics of 𝜌̂, denoted 𝑡𝜌̂, in Equations (7) and (8), to test the unit root null hypothesis of 𝜌 = 1 against the alternative hypothesis of 𝜌 < 1. Here, 𝐷𝑈𝑖,𝑡| and 𝐷𝑇𝑖,𝑡| , the dummy variables are lagged in Equations (7) and (8).
Table: 2
Narayan and Popp (2010) ADF Unit Root Test Results With Two Structural Breaks
Break in level Break in level and trend
Test Statistic TB1 TB2 Test Statistic TB1 TB2
CLI -6,991 2008:07 2010:04 -6,953 2008:07 2011:04
LBIST100 -7,180 2008:07 2010:04 -7,313 2008:07 2011:03
LBISTFIN -7,198 2008:07 2010:04 -7,146 2008:07 2011:06
LBISTIND -7,357 2016:10 2017:10 -9,539 2008:05 2016:12
Notes: Critical values for M1 = -4.760, -4.113, -3.787 at 1%, 5%, 10%, respectively. Critical values for M2 = -5.232, -4.577, -4.237 at 1%, 5%, 10%, respectively. TB1 and TB2 are the dates of the structural breaks.
We firstly log the series of stock market indices. Table 2 presents the findings of Narayan and Popp (2010) unit root test. It is seen that in all cases, the test rejects the unit root null implying that the all series are stationary under two structural breaks. The break dates are closely related to the critical periods of global financial turbulences and a stressful period in which the political risk increased dramatically in Turkey.
After checking the stationary properties of series by using Narayan and Popp (2010) ADF unit root test which allows for two structural breaks, we then proceed by employing Enders and Lee (2012) Fourier ADF unit root test. Enders and Lee (2012) consider the following Dickey-Fuller test in which the deterministic term is a time-dependent function specified by α(t):
yt=α(t)+ρyt−1+γt+εt (9)
where εt is a stationary disturbance with variance σε2 and α(t) is a deterministic function of t. Enders and Lee (2012) try to test the null hypothesis of a unit root (i.e., ρ = 1). Any test for ρ = 1 is problematic if α(t) is misspecified, when the form of α(t) is unknown. As an approximation of the unknown functional form of α(t), they consider the Fourier expansion:
α(t) = α0+ ∑ (α𝑘sin 2𝜋𝑘𝑡 𝑇 + β𝑘cos 2𝜋𝑘𝑡 𝑇 ) 𝑛 𝑘=1 ; n ≤ T/2 (10)
where n symbolizes the number of frequencies included in the approximation, k stands for a particular frequency, and T denotes the number of observations.
Obviously, the process is linear and the conventional non-stationary testing methodologies are appropriate, if α1 =β1 =···=αn =βn = 0. On the other hand, at least one
Fourier frequency must be present in the data-generating process, if there is a break or nonlinear trend. Since it is not possible to use a large value of n in a regression framework and the use of many frequency components can lead to an overfitting problem, Enders and Lee (2012) try to choose the proper frequencies to include in Equation (10), instead of positing the specific form of α(t). Supposing that they use only a single frequency k and consider the testing regression as follows:
∆yt = ρyt−1 + c1 + c2t + c3 sin(2πkt/T)+c4 cos(2πkt/T)+et (11)
They let τDF _t symbolize the t -statistic for the null hypothesis ρ = 0 in Equation (11).
The asymptotic characteristics of the DF version tests do not differ from those of the LM version of the test and they decide not to present the asymptotic distribution. The important point is that the critical values for the null hypothesis of a unit root will rely solely on the frequency (k) and the sample size (T) just like in the other version tests. Nevertheless, they do not rely on the coefficients of the Fourier terms or other deterministic terms. Thus, Ender and Lee (2012) can systematize critical values benefiting from simulations. Critical values of τDF _t are shown in Table 1(a) in their study. If the researcher wants to specify the value of
k, the test could be carried out directly benefiting from these critical values. If the value of k is approximated, the test for a break could be implemented as follows:
At the first step: they estimate Equation (11) for all integer values of k such that 1 ≤ k ≤ 5. It is seen that the regression with the smallest sum of squared residuals (SSR) yields 𝑘̂. If the residuals show serial correlation, augment (11) with lagged values of ∆yt.
At the second step: they indicate that pretesting for nonlinearities could be conducted. For this purpose, they use the usual F-test for the null hypothesis: c3 = c4 =0. When the
unit-root null is imposed on the data-generating process (DGP), the distribution of the F-statistic is non-standard. Thus, they can use the critical values of F(𝑘̂) shown in Table 1(a) which was stated in their study. Accordingly, if the sample value of F is less than the critical value,
the null hypothesis of a linear trend can not be rejected. Under this circumstance, they suggest performing the usual linear Augmented Dickey-Fuller test.
Table: 3
Fourier ADF Unit Root Test Results With Multiple Breaks Variables Frequency(k) MinSSR Fourier ADF Test-Statistic F-Statistic
CLI 5 0.001999 0.461413 9.99808 DIFCLI 5 0.000161 -2,854813* 6.54488* LBIST100 5 0.780301 -1,165276 4.08751 DIFLBIST100 5 0.783718 -12,962290*** 56.17121*** LBISTFIN 5 1.090437 -1,810860 4.38363 DIFLBISTFIN 5 1.110319 -12,819530*** 54.92538*** LBISTIND 5 0.610783 -0,474207 3.32685 DIFLBISTIND 5 0,610309 -11,411160*** 43.56294***
Notes: k denotes the optimal frequency value with the smallest sum of squared residuals (SSR). Critical values for k=5 and T=149, -3,55, -2,94 and -2,62 at 1%, 5% and 10%, respectively. Critical values for F ADF Statistics for T=149, -10,02, 7,41, 6,25 at 1%, 5% and 10%, respectively. ***, ** and * denote 1%, 5% and 10% levels of statistical significance. Since we employ the model used without a linear trend, we take into consideration the critical values shown in Table 1(b) in the study of Enders and Lee (2012).
As seen in the Table 3, although CLIs, LBIST100, LBISTFIN and LBISTIND series seem to have unitroot because the t-statistics are not greater than the critical values stated in the study of Enders and Lee (2012), it is seen that all series become stationary in their first differences. In addition, F-test results which are taken into account to test the significance of the trigonometric terms, confirm that these series are stationary because it is seen that trigonometric terms for these variables are significant, when checked the F-statistics with those shown in the same study. Since, trigonometric terms are significant for all series, we do not need to employ ADF unit root test. Additionally, it is obvious that when Fourier terms are used, the findings change greatly. While the series seem stationary in their levels when we employ Narayan and Popp (2010) unit root test with two structural breaks, the series become stationary in their first differences when we use Fourier ADF (2012) unit root test.
In the second part of the analysis, we employ Fourier Granger causality test developed by Enders and Jones (2016) in this study in order to analyze the causal relationships from composite leading indicators to stock market indices. Because of the linkages between the variables being exposed to gradual shifts and also linear spesifications being frequently insufficient to capture these linkages, econometric examinations become quite complex. In this regard, Enders and Jones (2016), dealing with the Granger-causality tests and on the short-run dynamics of the system, allows for the flexible Fourier form to catch the multiple smooth mean shifts which are likely to be present in the VAR system. Instead of approximating the form, number and the size of the breaks, Enders and Jones (2016) utilize the Flexible Fourier Form to check for breaks in a VAR and after they test the unit-root properties of variables, they suppose the linear VAR as follows:
𝑧𝑡= 𝛿 + ∑11𝑖=1𝐴𝑖𝑧𝑡−𝑖+ 𝑒𝑡 (12)
where 𝛿 is a (4x1) vector of intercepts, 𝐴𝑖 denotes (4×4) coefficient vector and 𝑒𝑡 refers to the vector of innovations. Despite of seeming plausible, the responses bring with some problems for two reasons. First of these, the system given by (12) is misspecified, to the
extent that there are ignored structural breaks. Second, the confidence intervals presented in the figure may be pointlessly large, given that an unrestricted VAR is presumably to be over parameterized. With the aim of showing how neglected breaks might interfere with Granger causality tests, they follow a standard recommendation and limited the VAR by putting the restrictions indicated by the Granger causality tests. Their findings suggest that there is very little interaction among the variables. The meaningful responses are such that series are in tendency to respond only to their own shocks.
Then, Enders and Jones (2016) allow the deterministic regressors be as follows, in place of the VAR given by (12):
𝑧𝑡= 𝛿(𝑡) + ∑11𝑖=1𝐴𝑖𝑧𝑡−𝑖+ 𝑒𝑡 (13) 𝛿(𝑡) = [𝛿1(𝑡), 𝛿2(𝑡), 𝛿3(𝑡), 𝛿4(𝑡)]′ (14)
and each intercept 𝛿𝑖𝑡 rely on n Fourier frequencies such that:
𝛿𝑖(𝑡) = 𝑎𝑖+ 𝑏𝑖𝑡 + ∑𝑛𝑘=1𝑎𝑖𝑘sin ( 2𝜋𝑘𝑡
𝑇 ) + 𝑏𝑖𝑘𝑐𝑜𝑠 ( 2𝜋𝑘𝑡
𝑇 ) (15)
It is obvious that the Granger causality test results differ from those acquired before in various important ways, when the Fourier terms are imposed to control for structural breaks. Contrary to the Granger causality test results indicated by the linear VAR, when Enders and Jones (2016) impose trigonometric functions in the model, stronger relations and richer sets of interactions between the variables become observable.
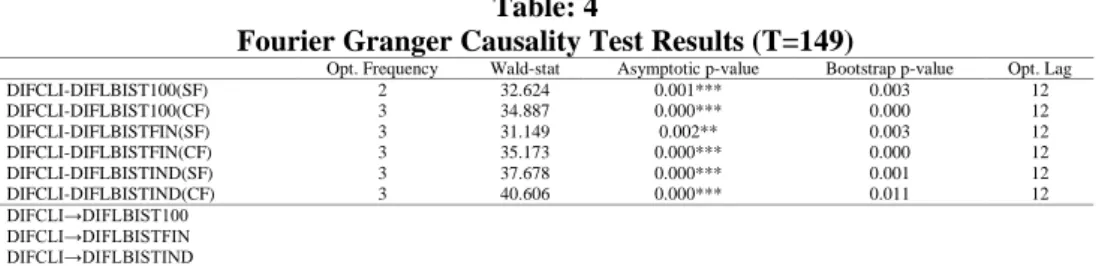
Table: 4
Fourier Granger Causality Test Results (T=149)
Opt. Frequency Wald-stat Asymptotic p-value Bootstrap p-value Opt. Lag
DIFCLI-DIFLBIST100(SF) 2 32.624 0.001*** 0.003 12 DIFCLI-DIFLBIST100(CF) 3 34.887 0.000*** 0.000 12 DIFCLI-DIFLBISTFIN(SF) 3 31.149 0.002** 0.003 12 DIFCLI-DIFLBISTFIN(CF) 3 35.173 0.000*** 0.000 12 DIFCLI-DIFLBISTIND(SF) 3 37.678 0.000*** 0.001 12 DIFCLI-DIFLBISTIND(CF) 3 40.606 0.000*** 0.011 12 DIFCLI→DIFLBIST100 DIFCLI→DIFLBISTFIN DIFCLI→DIFLBISTIND
Notes: → refers to causality relationship. Here, optimal k (frequency) and p (lag) are determined by Akaike information criterion. ***, ** and * denote 1%, 5% and 10% levels of statistical significance, respectively. Because n>50 in our analysis, we will take asymptotic p-values in comparison.
Table 4 presents the results of Fourier Granger Causality Test. As seen from the Table 4, there are causality relationships from composite leading indicators to stock market indices for Turkey in the period from 2007:03 through 2019:07, since asymptotic p-values are less than 0.05 in both single frequency and cumulative frequency. Therefore, the findings support the impact of CLIs on stock market indices in the short-run implying that the use of CLIs approach produces practical and powerfull results for anticipating turning points of stock market index. We can also say that techniques like Fourier framework, which take into account multiple structural breaks, seem to quite successful in the analysis.
5. Conclusion and Policy Implications
The index of composite leading indicators announced by the Central Bank of the Republic of Turkey is an important indicator since it gives information about the economic activity and includes the data such as labor expectations, interest rates in Treasury auctions, imports and electricity production. The index is constructed to give early signals of breaking points in conjunctural movements that might lead to fluctuations in the long-run potential level of economic activity. In this respect, the development of early warning systems, especially for the breaking points of the economic activity, help enterprises and policy makers analyze the economic performance in a timely manner in the short and long-run. In this study, our question is, whether the composite leading indicators index, which is simply linked with the business cycles and thereby macroeconomic fundamentals, help us predict the movements in the stock market indices or not. In this context, we focus on the impact of CLIs on stock market indices as the CLIs approach, which is designed to pre-inform the changes in economic activity, is a critical source of information for stock market investors. Consequently, a causality from CLIs to stock market indices supports that the thought of CLIs could be taken into account by investors in the financial markets in their decision-making processes. In other words, it means that the changes in the CLIs reflect to stock prices. Accordingly, investors could take into consideration the CLIs, which give important signals regarding the macroeconomic outlook, since it is very difficult for them to follow the changes in each macroeconomic variable separately.
The CLIs index is able to pre-determine the bottoms of contractions in the economic activity and it seems to signal on how the economy has entered a period of slow growth. In the CLIs graph, the index value below the threshold (100) indicates to low growth performance, in other words, economic activity being below its long-term trend, while the index value above the threshold (100) signals to high growth in economic activity, meaning that economic activity being above its long-term trend. In addition, the breakdown is expected to have stable downward trend, in order to confirm that the economy has entered a period of low growth. When we analyze the graphs of CLIs and stock market indices for Turkey, we can easily see that the downward trend in stock market indices appear to be detected by the CLIs. Accordingly, at the beginning of 2008, it is observed that the CLIs index is below 100 signaling to low growth in the economic activity and the stock market indices have decreasing trend in the following period. Again in the first half 2018, in parallel with the breakage of the critical threshold (100) in CLIs index, the decline in stock market indices begin, lasting for one-year period to the beginning of 2019. As a result, we can suggest that both the CLIs and the stock market indices move indeed in the same direction. As of 2019, when the CLIs index has exhibited positive outlook concerning the performance of economic activity, the stock market indices start to have increasing trend.
There are very few studies that concentrate on emerging market economies especially on Turkey. To our knowledge, this paper is one of these studies to analyse the causality linkages from composite leading indicators to stock market indices for Turkey. In our study, after checking the stationary properties of series by using Narayan and Popp (2010) with two structural breaks and Enders and Lee (2012) Fourier ADF unit root test with multiple
structural breaks, we investigate the causality relationships from CLIs to stock market indices for Turkey under the Fourier framework for the period of 2007:03-2019:07. When the findings are examined, we see that CLIs are found to be in causality relationship with the stock market indices for Turkey in the relevant period, implying that CLIs do have impacts on stock market indices including BIST100, BIST Financial and BIST Industrial stock market indices in the short-run. Our findings are consistent with the earlier evidence provided by Hacihasanoglu and Soytas (2011), Gulhan et al (2012), Topcu and Unlu (2013) and Topcu (2014) and Eyuboglu and Eyuboglu (2019), suggesting that CLIs should be taken more seriously by both investors and researchers who are interested in the subject. The analysis results reveal that the CLIs index, which carry information regarding economic expectations and is expected to be sensitive to the macroeconomic performance and fluctuations, are captured by stock prices in Turkey. Therefore, apart from the ability to forecast expansions and contractions, they could effectively be used to predict the trends of stock market indices. Consequently, investment companies can construct their investment strategies, or the portfolio management companies can adjust their risks by using the CLIs which serve as indicator of the future movements of stock market indices. The investors also can consider the CLIs as determinants in allocating their funds as the stock market indices follow the similar trends with the CLIs index. To summarize, these results show that CLIs are useful and powerful indicators for forecasting turning points of stock market indices. Based on the findings, it can be concluded that financial participants such as investors and portfolio managers can take into account the CLIs in their decision-making processes as such information about turning points allows these participants to adjust their portfolios and manage their risks more efficiently in the future economic environment as well. Although our study represents a relationship from CLIs to stock market indices, some issues remain to be unexplored empirically. From this perspective, for instance, some other analyses can be carried out to measure the degree of impact of CLIs on stock market indices or to evaluate the lags between the CLIs and stock market indices in the future studies. Furthermore, the scope the analysis could be expanded by using a wider range of data and employing more recent techniques.
References
Albeni, M. & Y. Demir (2005), “Makro Ekonomik Göstergelerin Mali Sektör Hisse Senedi Fiyatlarına Etkisi (İMKB uygulamalı)”, Muğla Üniversitesi SBE Dergisi, 14, 1-18. Alper, E. (2000), “Business Cycles, Excess Volatility and Capital Flows: Evidence from Mexico and
Turkey”, Bogazici University Discussion Papers, No: 11.
Altintas, H. & F. Tombak (2011), “Türkiye’de Hisse Senedi Fiyatları ve Makro Ekonomik Değiskenler Arasındaki İlişkinin Ekonometrik Analizi: 1987-2008”, Paper presented at
EconAnadolu 2011 International Conference in Economics II, June 15-17.
Altug, S. & E. Uluceviz (2011), “Leading Indicators of Real Activity and Inflation for Turkey, 2001-2010”, Working Papers, No. 1134, Koç University-TÜSİAD Economic Research Forum (ERF), Istanbul.
Atabek, A. & E.E. Cosar & S. Sahinoz (2005), “A New Composite Leading Indicator for Turkish Economic Activity”, Emerging Markets Finance and Trade, 41(1), 45-64.
Atabek, A.D. (2014), “Ekonomik Faaliyet için Bileşik Öncü Göstergeler Endeksi’nde (MBONCU-SUE) Yöntemsel Değişim, CBT Research Notes in Economics 1404, Research and Monetary Policy Department, Central Bank of the Republic of Turkey.
Binner, J.M. & R.K. Bissoondeeal & A.W. Mullineux (2005), “A Composite Leading Indicator of the Inflation Cycle for the Euro-Area”, Applied Economics, 37(11), 1257-1266. Central Bank of the Republic of Turkey (2019), EVDS, Electronic Data Delivery System,
<https://evds2.tcmb.gov.tr/index.php?/evds/serieMarket>, 17.08.2019.
Chen, S.S. (2009), “Predicting the Bear Stock Market: Macroeconomic Variables as Leading Indicators”, Journal of Banking & Finance, 33(2), 211-223.
Dovolil, J. (2016), “The Use of Economic Indicators as A Tool for Predicting S&P 500 Stock Index”, ACC Journal, 22(2), 7-14.
Enders, W. & J. Lee (2012), “The Flexible Fourier Form and the Dickey-Fuller Type Unit Root Tests”, Economics Letters, 117, 196-199.
Enders, W. & J. Lee (2016), “Grain Prices, Oil Prices, and Multiple Smooth Breaks in a VAR”,
Studies in Nonlinear Dynamics & Econometrics, 20(4), 399-419.
Eyuboglu, S. & K. Eyuboglu (2019), “Bileşik Öncü Göstergeler ile Borsa İstanbul Sektör Endeksleri Arasındaki İlişkinin İncelenmesi”, PAÜ SBE Dergisi, 35, 285-298.
Gulhan, U. & A. Kaya & B. Gungor (2012), “Bileşik Öncü Gostergeler ve Borsa Endeksi İlişkisinin Uluslararası Boyutta İncelenmesine Yönelik Bir Araştırma”, DEÜ İİBF Dergisi, 27(1), 3-29.
Gyomai, G. & E. Guidetti (2012), OECD System of Composite Leading Indicators, <http://www.oecd.org/std/leading-indicators/41629509.pdf>, 20.07.2019.
Hacihasanoglu, E. & U. Soytas (2011), “Bileşik Öncü Gösterge ve Sektörel Endeksler Arasındaki İlişki”, DEÜ İİBF Dergisi, 26(1), 79-91.
Murutoglu, A. (1999), “Leading Indicators Approach for Business Cycle Forecasting and a Study on Developing a Leading Economic Indicators Index for the Turkish Economy”, Istanbul
Stock Exchange Review, 3(9), 21-40.
Narayan, P.K. & S. Popp (2010), “A New Unit Root Test with Two Structural Breaks in Level and Slope at Unknown Time”, Journal of Applied Statistics, 37, 1425-1438.
OECD (2019), Composite Leading Indicator (CLI) (indicator),
<https://data.oecd.org/leadind/composite-leading-indicator-cli.htm>, 22.07.2019. Rapach, D.E. & M.E. Wohar & J. Rangvid (2005), “Macrovariables and International Stock Return
Predictability”, International Journal of Forecasting, 21(1), 137-166.
Topcu, E. (2014), “Bileşik Öncü Göstergeler ile Hisse Senedi Piyasaları Arasındaki İlişki: Türkiye Örneği”, AKÜ İİBF Dergisi, 16(1), 167-176.
Topcu, M. & U. Unlu (2013), “Do Investors Consider Composite Leading Indicators?: Time Series Evidence from Emerging Countries”, Theoretical and Applied Economics, 20(9), 51-62. Yilmaz, O. & B. Gungor & V. Kaya (2006), “Hisse Senedi Fiyatları ve Makro Ekonomik