i
NANOSTRUCTURED MATERIALS FOR
BIOLOGICAL IMAGING AND CHEMICAL SENSING
A DISSERTATION SUBMITTED TO
MATERIALS SCIENCE AND NANOTECHNOLOGY PROGRAM OF THE GRADUATE SCHOOL OF ENGINEERING AND SCIENCE
OF BILKENT UNIVERSITY
IN PARTIAL FULFILLMENT OF THE REQUIREMENTS FOR THE DEGREE OF
DOCTOR OF PHILOSOPHY
By
Adem Yildirim
November, 2014
ii
I certify that I have read this thesis and that in my opinion it is fully adequate, in scope and in quality, as a thesis of the degree of Doctor of Philosophy.
………. Prof. Dr. Mehmet Bayındır (Advisor)
I certify that I have read this thesis and that in my opinion it is fully adequate, in scope and in quality, as a thesis of the degree of Doctor of Philosophy.
………. Assoc. Prof. Dr. Hatice Duran
I certify that I have read this thesis and that in my opinion it is fully adequate, in scope and in quality, as a thesis of the degree of Doctor of Philosophy.
………. Assist. Prof. Dr. Ali Kemal Okyay
iii
I certify that I have read this thesis and that in my opinion it is fully adequate, in scope and in quality, as a thesis of the degree of Doctor of Philosophy.
………. Prof. Dr. Adil Denizli
I certify that I have read this thesis and that in my opinion it is fully adequate, in scope and in quality, as a thesis of the degree of Doctor of Philosophy.
………. Assist. Prof. Dr. Bora Garipcan
Approved for the Graduate School of Engineering and Science:
………. Prof. Dr. Levent Onural
iv
ABSTRACT
NANOSTRUCTURED MATERIALS FOR BIOLOGICAL IMAGING
AND CHEMICAL SENSING
Adem Yildirim
Ph.D. in Materials Science and Nanotechnology Supervisor: Prof. Dr. Mehmet Bayındır
November, 2014
In the recent years, the design and synthesis of fluorescent nanoparticles for biological and chemical sensing applications have received considerable attention due to the excellent photostability and emission intensity of fluorescent nanoparticles and the intrinsic sensitivity of fluorescence based methods. Although considerable progress has been made in their synthesis, there is still need for low-cost and high throughput methods for their widespread utilization in biological and chemical sensing applications. In addition, studies regarding their biocompatibility are necessary to identify the toxicological potential of these nanomaterials.
In this context, this thesis seeks new methods for multifunctional fluorescent nanoparticle synthesis and investigates their interactions with living organisms. In addition, it reports the applications of the fluorescent nanomaterials in biological imaging, therapy and chemical sensing applications.
First, we report a self-assembly method to prepare PEGylated or peptide functionalized mesoporous silica nanoparticles (MSNs) for cell labeling and drug delivery applications. The good cyto- and blood- compatibility of the functionalized nanoparticles were demonstrated. Next, we demonstrated a surfactant assisted method to synthesize ultrabright silica nanoparticles and studied their in vitro
v
cytocompatibility with several cell lines. We demonstrated the applications of ultrabright particles in cell labeling, chemo and photodynamic therapy and trace explosive sensing. Then, we discuss a template-free method (porosity difference based selective dissolution strategy) to prepare self-luminescent mesoporous hollow silica nanoparticles with tailored shapes. In addition, we studied the surface effects on blood compatibility of nanoparticles in detail using the MSNs possessing different surface functional groups (ionic, polar, neutral, and hydrophobic). Finally, we investigated the optical properties of polydopamine nanoparticles and showed that fluorescence of as-prepared polydopamine nanoparticles can be used for sensitive and selective detection of the dopamine neurotransmitter.
Keywords: Fluorescent nanoparticles, mesoporous silica, polydopamine, blood compatibility, cytotoxicity, fluorescent imaging, chemotherapy, photodynamic therapy, explosive sensing, neurotransmitter sensing
vi
ÖZET
BİYOLOJİK GÖRÜNTÜLEME VE KİMYASAL SENSÖR
UYGULAMALARI İÇİN NANOYAPILI MALZEMELERİN
GELİŞTİRİLMESİ
Adem YildirimMalzeme Bilimi ve Nanoteknoloji, Doktora Tez Yöneticisi: Prof. Dr. Mehmet Bayındır
Kasım, 2014
Son yıllarda, biyolojik görüntüleme ve kimyasal sensör uygulamalarında kullanılmak üzere floresan nanopartiküllerin sentezi, floresans yöntemlerin yüksek hassasiyetlerinden ve floresan nanopartiküllerin mükemmel fotokararlılık ve ışıma şiddetlerinden dolayı oldukça fazla ilgi çekmektedir. Bu partiküllerin sentezi konusunda bugüne kadar ciddi ilerlemeler gerçekleştirilmiş olsada, floresan nanopartiküllerin geniş uygulama alanları bulmaları için ucuz ve yüksek verimli yöntemlerin geliştirilmesine ihtiyaç vardır. Buna ek olarak, floresan nanopartiküllerin toksik potansiyellerin ayrıntılı olarak incelenmesi, bu partiküllerin kullanılmasından doğabilecek istenilmeyen etkilerin önüne geçilmesi açısından oldukça önemlidir.
Bu tez, asıl olarak çok fonksiyonlu floresans nanopartiküllerin sentezi için yeni ve basit yöntemlerin geliştirilmesi ve üretilen nanopartiküllerin biyolojik organizmalar ile uyumluluğunun araştırılması üzerine yoğunlaşmaktadır. Ayrıca, üretilen nanopartiküllerin biyolojik görüntüleme, terapi ve kimyasal teşhisi alanlarındaki uygulamalarıda rapor edilmektedir.
İlk olarak, kendiliğinden bir araya gelme yöntemi kullanılarak, polietilenglikol (PEG) veya kısa dizili peptitler ile fonksiyonalize edilmiş mezoboşluklu silika nanopartiküller (MSN) hücre işaretleme ve kontrollü ilaç salımı uygulamalarında kullanılmak üzere sentezlenmiştir. Hazırlanan partiküllerin hücre ve kan uyumlulukları gösterilmiştir. Daha sonra, yüzey arttırıcı moleküllerin yarıdımı ile
vii
oldukça parlak silika nanopartiküllerin hazırlanması ve bu nanopartiküllerin değişik hücre çeşitleri ile olan uyumluluğu gösterilmiştir. Nanopartiküllerin hücre işaretleme, kemo- ve fotodinamik- terapi ve patlayıcı tespiti uygulamaları rapor edilmiştir. Bunlara ek olarak, nanopartiküllerin yüzey kimyasının nanopartiküllerin kan bileşenleri ile uyumluğu üzerine etkisi yüzeyleri değişik özelliklere sahip (iyonik, polar, nötür ve hidrofobik) fonksiyonel gruplarla modifiye edilmiş MSN’ ler kullanılarak ayrıntılı olarak incelenmiştir. Son olarak, polidopamin nanopartiküllerin optik özellikleri incelenmiş ve yeni hazırlanmış polidopamin nanopartiküllerin floresan özellikte olduğu gösterilmiştir. Floresan polidopamin nanopartikül oluşumu, dopamine nörotransmitterinin hassas ve seçici bir şekilde tespit edilmesinde kullanılmıştır.
Anahtar kelimeler: Floresan nanopartiküller, mezoboşluklu silika, kan uyumluluğu, hücre uyumluluğu, floresan görüntüleme, kemoterapi, fotodinamik terapi, patlayıcı tespiti, nörotransmitter tespiti
viii
Acknowledgement
First and foremost, I would like to thank my advisor Prof. Mehmet Bayındır for his continuous guidance throughout my PhD. He always encouraged and supported me with the research projects. The seven years in Bayındır group was a great experience and will always be remembered.
I would like to thank Prof. Mecit Yaman who always encouraged me with my PhD and future career. We spent a lot of time with him by writing manuscripts, discussing about almost everything and planning about the future projects. I have learned a lot from him during these times.
I owe my sincere thanks to Prof. Bora Garipcan who I know since from my undergraduate years in Hacettepe University. He generously allowed me to use his cell culture facilities in Boğaziçi University where I gained an indispensable experience. I would like to thank Müge Türkaydın and other Garipcan group members for their support and friendship during my visits to Boğaziçi University.
Also, I would like to thank the people who contributed to this thesis; Prof. Mustafa Ö. Güler, Prof. Ayşe B. Tekinay, Prof. Turgay Tekinay, Prof. Gökçen Birlik Demirel, Prof. Adil Denizli, Prof. Hatice Duran, Prof. Ali Kemal Okyay, Erol Özgür, Pınar Beyazkılıç, Melis Şardan, Didem Mumcuoğlu, Rengin Erdem, Berna Şentürk. Without their helps this thesis would be incomplete.
I would like to thank all present and past members of Bayındır group and the friends in UNAM. It will be a long list if I thank all of them one by one, but I would like to thank some of them particularly. To Hulya, my first colleague and a valuable friend, with her we failed and succeed a lot. To the best colleague and loyal friend, Mert. To Erol for his valuable friendship and cheerful songs. To my best friends; Öner, Melis and Bihter. To my teammates and friends, Pınar, Emre, Urnaa and Yunusa; it is always fun to work with them. Also, I would like to thank all the staff and engineers of UNAM, especially Mustafa Güler, for their support and helps.
I would like to express my gratitude to The Scientific and Technological Research Council of Turkey, TÜBİTAK, for the Ph.D. Scholarship.
ix
I wish to give special thanks to Gülsu, who stood by me for all those times. None of this could have happened without her continuous support, patience and encouragement. With her, we will continue to peruse our dreams.
Last but not least, I would like thank my family who always believed in me and supported me.
x
Contents
Chapter 1: Introduction ... 1
Chapter 2: A Facile Self-Assembly Method to Functionalize MSNs with PEG and Peptides ... 4
2.1 Introduction ... 4
2.2 Experimental Section ... 7
2.3 Synthesis and Characterization of PEGylated MSNs ... 14
2.4 Biocompatibility of PEGylated MSNs ... 19
2.5 Fluorescent Dye or Drug Loaded PEGylated MSNs ... 21
2.6 Synthesis and Characterization of Peptide Functionalized MSNs ... 23
2.7 Cellular Uptake of Peptide Functionalized Fluorescent MSNs ... 28
Chapter 3: Ultrabright Tri-Functional MSNs with Reduced Non-Specific Toxicity ... 31
3.1 Introduction ... 31
3.2 Experimental Section ... 32
3.3 Synthesis and Characterization of Ultrabright Fluorescent MSNs ... 35
3.4 Optical Properties of Ultrabright Fluorescent MSNs ... 37
3.5 Hemolytic Activity of Ultrabright Fluorescent MSNs ... 39
3.6 Cytotoxicity of Ultrabright Fluorescent MSNs ... 40
xi
3.8 Phototoxicity of Ultrabright MSNs... 43
Chapter 4: Nanoconfinement of Pyrene in MSNs for Detection of Trace TNT in Aqueous Phase ... 44
4.1 Introduction ... 44
4.2 Experimental Section ... 46
4.3 Synthesis and Characterization of Pyrene Confined MSNs ... 47
4.4 TNT Sensing Performance of the pMSNs ... 53
Chapter 5: A Porosity Difference Based Selective Dissolution Strategy to Prepare Hollow MSNs ... 58
5.1 Introduction ... 58
5.2 Experimental Section ... 60
5.3 Synthesis and Characterization of MSNs ... 61
5.4 Synthesis and Characterization of Core/Shell MSNs ... 64
5.5 Selective Dissolution of Porous Cores in PBS ... 65
5.6 Possible Mechanism of Selective Dissolution Process ... 71
5.7 Self-Luminescent Hollow MSNs ... 74
Chapter 6: Impact of MSN Surface Functionality on Hemolytic Activity, Thrombogenicity and Non-Specific Protein Adsorption ... 76
6.1 Introduction ... 76
6.2 Experimental Section ... 79
6.3 Synthesis and Characterization of Surface Functionalized MSNs ... 82
6.4 Hemolytic activity of Surface Functionalized MSNs ... 88
6.5 Effect of Surface Functionalized MSNs on Blood Coagulation ... 92
6.6 Non-Specific Protein Adsorption onto Surface Functionalized MSNs ... 94
xii
Chapter 7: Fluorescent Dopamine Sensing Based on in Situ Formation of Visible
Light Emitting Polydopamine Nanoparticles ... 100
7.1 Introduction ... 100
7.2 Experimental Section ... 102
7.3 Synthesis and Characterization of Fluorescent Polydopamine Nanoparticles ... 103
7.3 Controlling the Polymerization of Polydopamine Nanoparticles ... 109
7.4 Sensitive and Selective Dopamine Sensing ... 109
Chapter 8: Conclusions ... 113
xiii
List of Figures
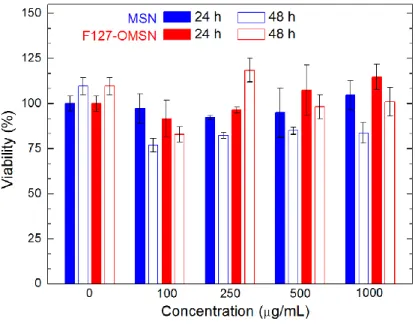
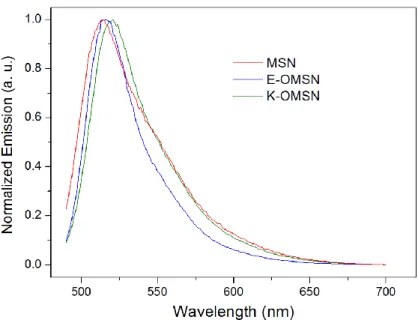
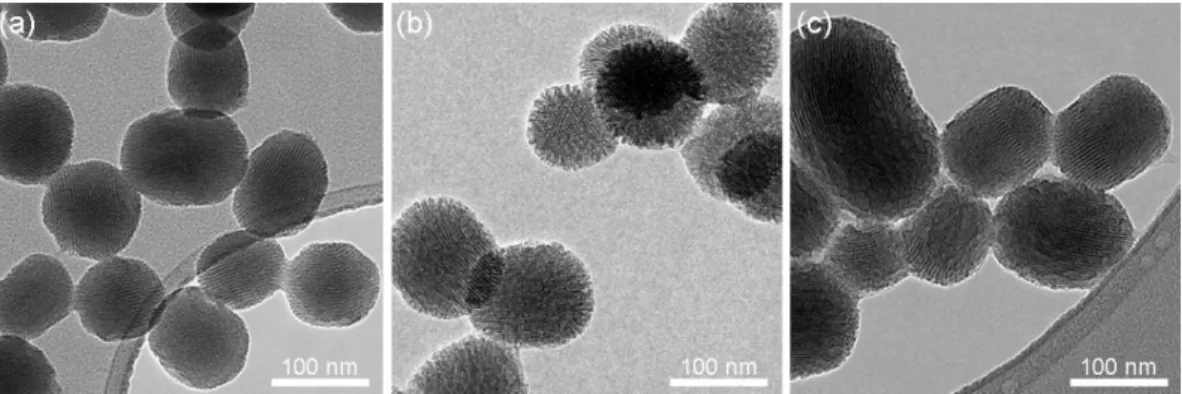
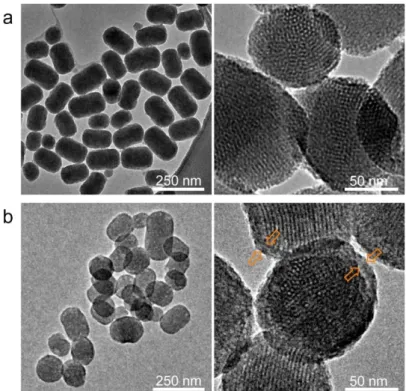
Figure 2.1: Schematic representation of cargo loaded and F127 or peptide amphiphile capped MSN preparation... 7 Figure 2.2: Chemical structures of the peptide amphiphile molecules used in this study. ... 7 Figure 2.3: TEM images of mesoporous silica nanoparticles. (a) Bare MSN, (b) and (c) OMSN, and (d) F127-OMSN. ... 14 Figure 2.4: Particle size distributions of MSN and OMSN which were calculated according to the TEM images. Octyl modification significantly increased particle size indicating octyl containing shell formation... 15 Figure 2.5: Nitrogen adsorption and desorption curves of MSN and OMSN. Octyl addition slightly reduced the surface area and pore volume of the particles. ... 16 Figure 2.6: TGA spectra of MSN, OMSN, F127-OMSN and F127 polymer. After octyl addition and F127 capping weight loss of the particles gradually increased proving the formation of octyl and F127 layer around MSNs. ... 17 Figure 2.7: FTIR spectra of MSN, O-MSN, F127-OMSN and F127 polymer showing successful octyl modification and F127 capping of particles. ... 17 Figure 2.8: Dispersibility of MSN particles in aqueous media. Size distributions of MSN and F127-OMSN in water and PBS. Inset show the photograph of MSN (left) and F127-OMSN (right) dispersions in PBS showing the colloidal stability of PEGylated MSNs. ... 18 Figure 2.9: The average zeta size of F127-OMSN in PBS after several washing cycles. Even after 10 washing cycles average particle size remained almost intact indicating the good stability of self-assembled pluronic layer... 19 Figure 2.10: Cell viability results of MSN and F127-OMSN after 24 and 48 h. ... 20 Figure 2.11: (a) Hemolysis results of MSN and F127-OMSN. Inset shows photographs of RBCs treated with MSN (up) and F127-OMSN (down) at different concentrations. (b) PT and aPTT values of particles. ... 21
xiv
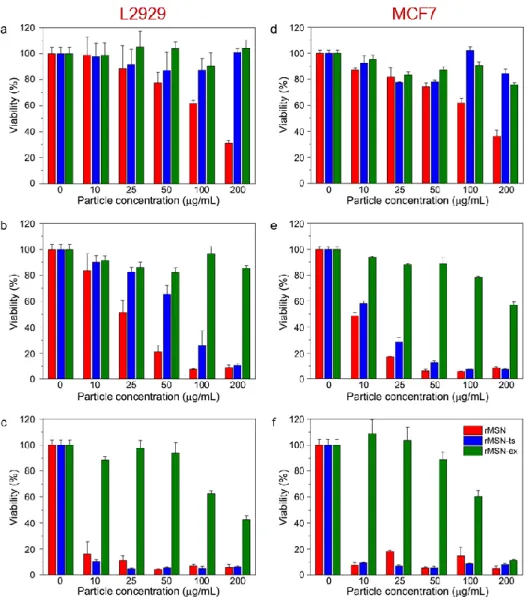
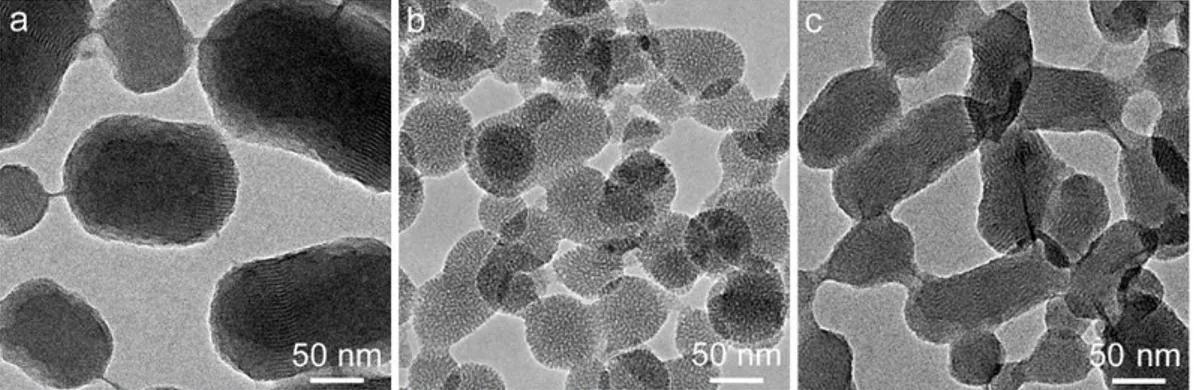
Figure 2.12: (a) Fluorescence spectrum of R6G loaded F127-OMSN. (b) ) R6G release profiles of MSN and F127-OMSN. ... 22 Figure 2.13 DOX release profiles of MSN and F127-OMSN in different pH values. ... 23 Figure 2.14: Fluorescence spectra of MSNs showing the successful FITC conjugation to the silica network. ... 24 Figure 2.15 (a) Photograph showing the water dispersion of OMSNs before and after coating with peptide amphiphiles and (b) photographs of MSN dispersion in water.25 Figure 2.16: Characterization of the mesoporous silica nanoparticles. TEM images of (a) MSNs, (b) OMSNs and (c) E-OMSNs. ... 25 Figure 2.17: FTIR spectra (a) and TGA spectra (b) of particles and peptide amphiphiles, respectively. ... 26 Figure 2.18: Cytotoxicity results of bare and peptide functionalized MSNs. (a) A10 cells incubated for 4 h with particles and 20 h in particle free media and (b) HUVEC cells incubated for 4 h with particles and 20 h in particle free media. ... 28 Figure 2.19. Uptake results of bare and peptide functionalized MSNs. Confocal results showing that peptide functionalized particles were internalized more both A10 and HUVEC cell lines. Upper images at left show the fluorescence of particles, lower images at left show the fluorescence of actin filaments stained by Phalloidin-TRITC and panels on right show the merged images. Scale bars: 20 µm. ... 29 Figure 2.20: Flow cytometry analysis of A10 cells and HUVECs treated with bare and peptide functionalized MSNs. (a) Flow cytometry histograms. (b) Graph demonstrates the improved uptake of peptide functionalized MSNs. Data were generated from at least three independent experiments. According to Student's t-test, **p < 0.001 and ***p < 0.0001. ... 30 Figure 3.1: Schematic representation of synthesis of silica capped and dye loaded ultrabright MSNs. ... 32 Figure 3.2: TEM images of the surfactant containing MSNs; (a) rMSN and (b) rMSN-ts. Left and right panels shows the low and high magnification images of the particles, respectively. Both particles have short rod-like shape and fairly monodisperse in size. Uniform silica layer around rMSN-ts can be easily observed from the images. Orange
xv
arrows in (b) indicate the nonporous shells formed around the porous cores of rMSN-ts. ... 36 Figure 3.3: (a) Normalized UV-Vis spectra of free RB molecules and ultrabright particles, (b) Normalized fluorescence spectra of free RB molecules and ultrabright particles, (c) Fluorescence maxima of free RB molecules and ultrabright particles at different excitation wavelength. ... 38 Figure 3.4: 2D color maps showing the excitation wavelength dependent fluorescence intensities of (a) free RB molecules and (b) rMSN-ts at same dye concentration. .... 38 Figure 3.5: (a) Hemolytic activity of ultrabright and extracted MSNs. (b) Hemolytic activity of supernatants of ultrabright particles. ... 40 Figure 3.6: Cytotoxicity results of ultrabright MSNs against normal (L2929) and cancer (MCF7) cell lines. (a-c) viability of L2929 cells after (a) 4 h, (b) 24 h and (c) 72 h of incubation with particles. (d-f) viability of MCF7 cells after (d) 4 h, (e) 24 h and (f) 72 h of incubation with particles. ... 41 Figure 3.7: Fluorescence, bright field and merged images of MCF7 cells untreated or treated with 100 µg/mL of particles for 4 h. rMSN-ts revealed significantly higher cellular uptake compared to rMSN. Scale bars: 20 µm. ... 42 Figure 3.8: Photodynamic therapy results of MCF7 cells. Viability of the cells treated with 100 µg/mL of particles for 4 h after illuminated or not illuminated with a green laser for 30 s. * indicates p <0.05 according to the student’s t-test. ... 43 Figure 4.1: Schematic representation for the formation of pMSNs. Pyrene is confined in CTA micelles through hydrophobic-hydrophobic interactions. After the addition of TEOS, silica grows around the self-assembled pyrene confined CTA micelles. F127 pluronic polymer prevents particle aggregation during the silica growth. ... 48 Figure 4.2: Morphology of pMSNs. (a) TEM, and (b) SEM images of the pMSNs prepared using 40 mg of pyrene indicating the uniform size and shape distribution of the nanoparticles... 49 Figure 4.3: TEM images of pMSNs prepared using (a) 6 mg, (b) 12 mg, and (c) 22 mg of pyrene... 49 Figure 4.4: UV-Vis absorption spectrum (blue) and fluorescence emission spectrum (red) (excitation wavelength was 340 nm) of pMSNs prepared using 40 mg of pyrene.
xvi
Three peaks observed at 304, 321, and 336 nm are the absorption bands of pyrene. The peaks at 370-400 nm are the monomer emission of pyrene. The broad emission band centered at 475 nm is the excimer emission. ... 50 Figure 4.5: Iexc/Imon ratios of pMSNs prepared using various amounts of pyrene. .... 51
Figure 4.6: Fluorescence spectra of pMSNs (black) and supernatant (red) of pMSNs which was obtained after centrifuging the pMSNs. ... 52 Figure 4.7: Fluorescence spectrum of pMSNs which was stored for six months at ambient conditions. Inset shows the Iexc/Imon ratios of as-prepared and stored pMSNs. ... 52 Figure 4.8: Particle size distribution of the pMSNs measured using dynamic light scattering technique. Inset shows the average particle size of pMSNs with respect to time. ... 53 Figure 4.9: (a) Fluorescence emission spectra of the pMSNs with increasing TNT concentrations. Excitation wavelength was set at 340 nm for the measurements. (b) Time-dependent excimer emission intensity of the pMSNs in the absence and in the presence of 500 nM of TNT. ... 54 Figure 4.10: (a) Quenching efficiencies of the pMSNs depending on the TNT concentration based on the excimer emission (at 475 nm) and monomer emission (at 394 nm). (b) Calibration curve for TNT concentration in the range from 10 nM to 1.0 µM. ... 55 Figure 4.11: Optical photographs of pMSNs dispersions under UV-light before and after the addition of 0.4 µM, 1.0 µM, 4.0 µM, and 8.0 µM of TNT. Quenching of the excimer emission is clearly visible for the increasing TNT concentration. ... 56 Figure 4.12: Fluorescence quenching efficiencies of excimer emission for 10.0 µM aqueous solutions of various analytes (TNT: trinitrotoluene, DNT: dinitrotoluene, NB: nitrobenzene, Ch: chloroform, NaOH: sodium hydroxide, BA: benzoic acid, Ani: aniline, NaCl: sodium chloride, Met: methanol, and HCl: hydrochloric acid). ... 57 Figure 5.1: Schematic representation of synthesis of hollow nanospheres and nanorods. In the presence of RB dye rod-shaped particles are formed. Addition of excess TEOS during the reaction produces uniform silica shell around particles. During the incubation in PBS, core shell. ... 60
xvii
Figure 5.2: TEM (left panel) and SEM (right panel) of MSNs prepared using different amounts of RB. (a, d) No RB, (b, e) 5 mg RB and (c, f) 10 mg RB. In the presence of RB, rod-shaped MSNs are formed and with the increasing RB amount longer rods can be obtained. ... 62 Figure 5.3: TEM images of MSNs prepared using 20 mg of RB. (a) Low magnification image showing the polydispersity of the particles. (b) TEM image of a helical nanorod with large aspect ratio. (c) Close-up image of the helical nanorod shown in (b). White arrows indicate the helical porous structure of the nanorod. ... 63 Figure 5.4: Morphology and shell thickness of core/shell MSNs. (a-c) TEM images of spherical MSNs prepared using 1 mL of additional TEOS (a), spherical MSNs prepared using 3 mL of additional TEOS (b), rod-shaped MSNs prepared using 1 mL of additional TEOS (c). Arrows indicates the shells of the particles. (d) Shell thickness of spherical particles depending on the additional TEOS amount. ... 65 Figure 5.5: Low magnification TEM image of hollow nanospheres showing high yield of hollowing process. ... 66 Figure 5.6: Mechanism of hydroxide ion catalyst silica dissolution and regrowth. .. 66 Figure 5.7: TEM images of hollow particles. (a) Hollow nanospheres prepared using core/shell particles with 8 nm shell thickness, (b) hollow nanorods prepared using core/shell particles with 8 nm shell thickness. Shell thickness of hollow particles remained same after hollowing process, indicating that cores were completely dissolved. (c) Close-up TEM image of nanorods. (d) High magnification STEM image of hollow nanorods that shows the mesoporous shells of particles. Arrow indicates a crack formed on the hollow nanorod shell during core dissolution and calcination processes. ... 67 Figure 5.8: (a) N2 adsorption and desorption curves of rod-shaped particles. (b) Pore
size distribution of particles calculated using the N2 adsorption and desorption curves.
rMSN and rMSN-ts showed narrow pore size distribution, on the other hand, h-rMSN have broad pore size distribution. (rMSN; rod-shaped MSNs, rMSN-ts; rod-shaped core/shell MSNs, and h-rMSN; rod-shaped hollow MSNs) ... 69 Figure 5.9: XRD spectra of rod-shaped particles. rMSN and rMSN-ts, demonstrated characteristic diffraction peaks, (100), (110), and (200), of the highly ordered
xviii
hexagonal pore structure of MCM-41 type mesoporous materials. On the other hand, pore order disappeared after core dissolution (h-rMSN). ... 70 Figure 5.10: TEM images of partially hollowed spherical particles (a) low magnification and (b) high magnification. Partially hollowed particles contain a few large pores in their cores and it is still possible to observe ordered mesopores in the non-dissolved parts. ... 71 Figure 5.11: Mechanism of core dissolution process. (a-c) TEM images taken at different time intervals during the hollowing of rod-shaped MSNs at room temperature. (a) 1 day, (b) 3 days and (c) 7 days. After 1 day, many small pores around 10 nm was observed. The size of these pores increased with time. Some dissolved areas outlined in red in all TEM images. (d) Schematic representation of core dissolution process. ... 72 Figure 5.12: TEM images of the nanorods incubated in water at 65 °C for one day. Cores of the several particles remained completely or partially undissolved at these conditions. ... 73 Figure 5.13: TEM images of the pre-calcined nanorods after core dissolution process ... 74 Figure 5.14: Fluorescence spectrum of self-luminescent hollow MSNs in water (excitation wavelength was 360 nm). Inset shows the TEM image of the particles. . 75 Figure 6.1: Schematic representation of certain interactions between mesoporous silica nanoparticles (MSNs) and blood constituents. Surfaces of MSNs were functionalized with ionic, polar, neutral or hydrophobic organosilane monomers to evaluate the effect of the surface chemical composition on blood compatibility of MSNs. They may cause hemolysis of red blood cells by deforming cell membrane during particle endocytosis and thrombogenicity by activation of blood coagulation cascade. Also, proteins can be non-specifically adsorbed to their surfaces which may reduce the blood circulation time of nanoparticles. ... 79 Figure 6.2: TEM images of (a,b) MSN and (c,d) P-MSN. The uniform size distribution and mesoporous structure of the particles can be clearly observed from TEM images. The insets in (a,c) shows the particle size distribution of MSN and P-MSN, respectively. (e) XRD spectra of all MSNs. ... 84
xix
Figure 6.3: TEM image of PEG-MSN. Thin organic layer formed around the particles can be observed from the TEM image. ... 85 Figure 6.4: Thermo gravimetric analysis spectra of all MSNs. ... 86 Figure 6.5: Fluorescence spectrum of R-MSN. The bright fluorescence of Rhodamine B dye can be clearly seen. ... 86 Figure 6.6: FT-IR absorption spectra of all MSNs. The C-H absorption peak around 3000 cm-1 is more distinct for functionalized MSNs. ... 87 Figure 6.7: (a) Hemolysis percentages of all MSNs at different concentrations between 0.05 and 1g/mL, which were incubated with RBCs for 2 h. Data generated from three independent experiments. All functionalized MSNs demonstrated lower hemolytic activity compared to bare MSN at all concentrations. Furthermore, for A-MSN, P-MSN, T-P-MSN, R-MSN and PEG-MSN almost no hemolytic activity was detected. (b) Photographs of RBCs threated with all MSNs at different concentrations. The released hemoglobin from the damaged cells in the supernatant can be seen from the photographs. (-) and (+) controls are the RBCs in PBS and water, respectively. Student’s t test analyses revealed the statistical significance of the data (p<0.0001).90 Figure 6.8: Hemolytic activity of MSNs functionalized with APTES between 2.5 to 15 molar % with respect to TEOS. Student’s t test analyses revealed the statistical significance of the data (p<0.0001). ... 91 Figure 6.9: Hemolysis results of HSA coated MSNs. With increasing HSA concentration reduced hemolytic activity was observed. ... 92 Figure 6.10: (a) 0.1 mg/mL particle concentration. All PT and aPTT values are within their normal range. (b) 1 mg/mL particle concentration. All PT values are within their normal range; however, aPTT values for R-MSN and especially P-MSN is higher than normal value, which indicates that these particles inhibit the intrinsic pathways of coagulation at this concentration. Data were generated from at least three independent experiments. According to Student’s t test, *p<0.05 and ** p<0.0001. ... 93 Figure 6.11: Protein adsorption percentages of nanoparticles. Data were generated from three independent experiments. ... 95 Figure 7.1: Schematic representation of fluorescent PDA nanoparticle formation. 103
xx
Figure 7.2: Time dependent UV-Vis absorption spectra of 1 mM DA solution. Oxidization is started using 20 mM (final concentration) NaOH. The broad band increase in the absorption indicates PDA formation. Inset shows the peak formed around 470 nm at the first stages of polymerization. ... 104 Figure 7.3: Particle size distribution of PDA nanoparticles. Graph shows the particle size distribution of PDA nanoparticles which were prepared after oxidization of 100 µM DA solution for 3 h in the presence of 20 mM NaOH. Inset shows the TEM images of the purified DA oxidization solution showing the polydisperse and irregularly shaped PDA nanoparticles. ... 105 Figure 7.4: In situ fluorescence measurements of 100 µM DA solutions which were oxidized at different conditions. (a) 10 mM Tris (pH 9.6), (b) 0.5 mM NaOH (pH 9.6), (c) 10 mM NaOH and (d) 20 mM NaOH. ... 106 Figure 7.5: Time dependent fluorescence intensity at 510 nm of 100 µM DA solutions which were oxidized at different basic conditions. ... 107 Figure 7.6: In situ fluorescence measurements of 100 µM DA solutions which were oxidized at different conditions. (a) 10 mM Tris (pH 9.6), (b) 0.5 mM NaOH (pH 9.6), (c) 10 mM NaOH and (d) 20 mM NaOH. ... 108 Figure 7.7: Stopping the polymerization reaction of DA using HCl. (a) Fluores-cence spectra of 100 µM DA, which is oxidized using 20 mM NaOH and after 15 min excess HCl was added. (b) Fluorescence intensity at 510 nm change with time before and after HCl addition. ... 109 Figure 7.8: Sensitivity of the dopamine assay. (a) Fluorescence response of the assay against different concentrations of DA. (b) Assay response as a function of DA concentration which indicates the good linearity of the sensor in the studied region. ... 110 Figure 7.9: Absorption of DA oxidization solutions at 360 nm with respect to DA concentration. ... 111 Figure 7.10: Selectivity of the dopamine assay. DA concentration is 10 µM and concentration of other substances is 100 µM. (DA: Dopamine, AA: Ascorbic acid, UA: Uric acid, Glc: Glucose, Suc: Sucrose, Asp: Aspartic acid, Lys: Lysine, Ala: Alanine, Gly: Glycine, Mix: mixture of all interfering chemicals) ... 112
xxi
List of Tables
Table 2.1: Physical properties of bare, octyl modified and peptide functionalized
MSNs ... 27
Table 3.1: Physical properties of ultrabright MSNs... 36
Table 6.1: Physical properties of mesoporous silica nanoparticles... 83
Table 6.2: Zeta potentials of mesoporous silica nanoparticles. ... 88
Table 6.3: Organic contents and zeta potentials aminopropyl functionalized MSNs. 91 Table 6.4: Protein adsorption amounts of MSNs. ... 95
Table 7.1: Comparison of sensitivity of the current assay with the previous dopamine oxidation based assays. ... 111
1
Chapter 1
Introduction
The design and synthesis of fluorescent nanoparticles is a rapidly growing research field and is promising for applications ranging from molecular and cellular bioimaging to chemical sensing of various molecules [1-3]. The most common method for the preparation of fluorescent nanoparticles is conjugating the fluorescent molecules with nanoparticles. In this context, various nanoparticles produced from a wide range of materials have been employed; silica, iron oxide, gold, silver, carbon, metal oxides, polymers and so on [4]. Conjugation of fluorescent materials into nanoparticles offers many advantages over their direct use, such as improved photostability, emission intensity and solubility in water [5]. Beside from conjugation method, another way to prepare fluorescent nanoparticles is to use intrinsically fluorescent materials in nanoparticle synthesis, such as conjugated polymers, quantum dots, metal nanoclusters
etc. [6-8].
Additional features can be provided to the fluorescent nanoparticles using different material compositions. For instance, fluorescent mesoporous silica nanoparticles (MSNs) can be used for controlled delivery of drugs into the cells -owing to their high surface area and pore volume- and at the same time for imaging of the position of nanoparticles inside the cells. Another well-known example is the superparamagnetic iron oxide nanoparticle containing core/shell fluorescent nanoparticles, which can be used for dual fluorescent and magnetic imaging of tumors. Furthermore, such multifunctional fluorescent nanoparticles can be targeted to cancer cells by modifying
2
their surfaces with the molecules that are specific to the overexpressed receptors of cancer cells (e. g. antibodies, folic acid, and peptide sequences) in order to improve the efficiency of nanoparticle based therapies. In the last two decades, we witnessed many successful demonstrations of such multifunctional fluorescent nanoparticles in especially the field of biotechnology. More detailed information on this subject can be found in the previous reviews [9-11].
In this thesis, we focused on the design and synthesis of novel multifunctional fluorescent nanoparticles for bioimaging and chemical sensing applications. We also demonstrated the promising potential of the prepared materials in the chemo- and photodynamic- therapy of cancer and in drug delivery applications. In addition, we studied their biocompatibility in terms of cytotoxicity, hemolytic activity, non-specific protein adsorption, dispersibility in biological media and their blood coagulation initiation/inhibition ability.
This thesis is organized in eight chapters. Chapter 1 gives the motivation of this thesis and its organization. Chapter 2-7 reports the published or to be published outcomes of this thesis. Chapter 8 gives the general conclusions.
In Chapter 2, we describe a facile self-assembly method to prepare PEGylated or peptide functionalized fluorescent silica nanoagents using hydrophobic mesoporous silica nanoparticles and an amphiphilic PEG containing polymer or peptide amphiphiles. We used them for cellular labeling. In addition, we showed the excellent dispersibility in biological media, good cyto- and blood compatibilities and improved cellular uptake of these surface engineered fluorescent nanoparticles.
In Chapter 3, we report the synthesis of silica capped ultrabright MSNs with reduced cytotoxicity. We prepared the ultrabright MSNs by surfactant assisted encapsulation of Rose Bengal dye inside the pores of MSNs. Pores of the dye doped MSNs were capped with a dense silica layer to reduce the dye and surfactant leakage. We studied their optical properties in detail and demonstrated the cell-labeling applications of these particles. In addition, synergetic chemo- and photodynamic- therapy of cancer cells with ultrabright MSNs was showed. Furthermore, the compatibility of the particles with red blood cells were studied.
3
In Chapter 4, we describe the preparation of pyrene confined MSNs for the trace detection of trinitrotoluene (TNT) in aqueous phase. Pyrene confined MSNs were prepared using the surfactant assisted encapsulation method described in the previous chapter. We demonstrated that bright pyrene excimer emission of the particles exhibit a rapid, sensitive and visual quenching response against TNT.
In Chapter 5, we explain a templateless method to prepare self-luminescent hollow MSNs with tailored morphology. The method is based on the selective dissolution of porous cores of solid silica shell/mesoporous silica core nanoparticles in mild conditions (PBS or water). Using this method we prepared hollow and mesoporous silica nanospheres and nanorods with different shell thicknesses. Also, we described a general method to prepare self-luminescent hollow particles. In addition, we proposed a mechanism for selective dissolution of porous cores of the core/shell nanoparticles.
In Chapter 6, we systematically evaluate the impacts of surface chemistry on blood compatibility of MSNs. We investigated the interactions of a series of MSNs possessing different surface functional groups (ionic, polar and hydrophobic) with blood constituents, in terms of their hemolytic activity, thrombogenicity, and adsorption of blood proteins on their surfaces. Also, we prepared Rhodamine B dye conjugated fluorescent MSNs to observe the effect on fluorescent tagging on blood compatibility.
In Chapter 7, we propose a turn-on fluorescent method for rapid and facile detection of dopamine, which is the principle biomarker for diseases such as schizophrenia, Huntington's, and Parkinson’s. The method is based on in situ formation of fluorescent polydopamine nanoparticles (demonstrated for the first time in this study) under basic conditions. We studied the in situ optical properties of polydopamine nanoparticles, in order to determine optimum experimental conditions. Under optimized conditions, we demonstrated the high sensitivity (40 nM) and excellent selectivity of the assay.
Finally, in Chapter 8, we give the general conclusions and major outcomes of this thesis and the potential future applications.
4
Chapter 2
A Facile Self-Assembly Method to
Functionalize MSNs with PEG and Peptides
2.1 Introduction
The high surface area and pore volume, good chemical stability and ease of surface functionalization of mesoporous silica nanoparticles (MSNs) make them promising materials for biological applications as bioimaging, cell labeling and drug delivery agents [12, 13]. In addition, silica based materials are generally accepted as biocompatible materials by the U.S. Food and Drug Administration (FDA). However, recent studies demonstrated their potential in vitro and in vivo toxicity, especially when their size is reduced to the nano scale [14, 15]. Although the toxicity of silica based nanomaterials depends on several factors including particle size, shape, surface chemistry and porosity [16-18] there is a general consensus that chemical structure of the surface is the predominant factor which determines the interactions with biological systems [19]. The surface of bare silica is covered with negatively charged silanol groups, which can electrostatically interact with positively charged tetraalkyl ammonium moieties of the cell membrane and can lead to cytotoxicity by membranolysis or inhibition of cellular respiration [19, 20]. Also, rapid aggregation of silica based nanoparticles in biological media can result in mechanical obstruction in the capillary vessels of several vital organs, leading to organ failure and even death
5
[21, 22]. Therefore, replacing the surface silanol groups with biocompatible molecules is essential to improve the biocompatibility of MSNs.
Among numerous polymeric or organosilane surface modification ligands, polyethylene glycol (PEG) is the mostly used one due to its well established biocompatibility, hydrophilicity, and antifouling properties [23]. However, the PEGylation process has some limitations; (i) it mostly requires tedious organic synthesis and surface modification [24] and (ii) pores of MSNs may be closed by the long PEG polymer chains, which can hinder the drug loading process. Beside from biocompatibility, surface modification of MSNs is important in terms of improving the efficiency of MSN based therapies. Modification of the MSN surface with polymers [25, 26] (e.g. polyethyleneimine and zwitterionic copolymers) or biomolecules [27-29] (e.g. folic acid, antibodies, peptides) has been proved to be an effective way to improve the selective uptake of MSNs by cancer cells which is highly desired for cancer diagnosis and therapy applications. In particular, short peptide chains have attracted a great deal of attention in recent years because of their tunable functionality, biodegradability, and relative ease of synthesis [30-32]. It has been shown that short peptide sequences (e.g. RGD and IL-13) can be used for targeting nanoparticles to specific cancer cell lines [33-36]. In addition to targeting properties, some peptide sequences (e.g. TAT peptide) demonstrated cell penetrating and endosomal escape properties [37, 38]. Also, the biodegradability of peptides makes them suitable for being utilized as stimuli responsive gatekeepers in controlled drug release [39] and linkers in FRET based diagnostics [40, 41]. Conventionally, peptides are covalently attached to the silica surface by using additional cross-linking reagents and troublesome synthetic methods, which results in poor surface grafting density and costly synthesis of functionalized materials [34, 39, 42].
To overcome these limitations in both PEGylation and peptide modification, here we report a facile self-assembly method using octyl modified hydrophobic MSNs (OMSNs) with pluronic polymers (for PEGylation) of peptide amphiphiles (PAs) (for peptide modification). Pluronic F127, a FDA approved biocompatible polymer, contains two hydrophilic PEG blocks and a hydrophobic polypropylene oxide (PPO) between the two PEG blocks was used for PEGylation [43]. When the powder of hydrophobic MSNs is added into the F127 solution they are easily transferred into
6
water by self-assembly of F127 molecules onto the MSN surface through the hydrophobic interaction between the PPO block of F127 and surface octyl groups of the MSNs (Figure 2.1). Similarly, PAs spontaneous cover the surfaces of OMSNs (for peptide case nanoparticles are labelled with fluorescein dye for uptake studies) in aqueous media through hydrophobic interactions between octyl groups of OMSNs and alkyl chains of PAs (Figure 2.1).
In the first part of the study, we prepared cargo (dye or drug) loaded and PEGylated MSNs by loading the hydrophobic MSNs before the F127 capping process. The F127 capped particles are dispersible in both water and phosphate buffered saline (PBS), whereas uncapped MSNs are easily aggregated and precipitated. The improved biocompatibility of F127 capped MSNs was demonstrated using cytotoxicity, hemolytic activity and thrombogenicity assays. Lastly, cargo release kinetics of PEGylated MSNs was investigated. The cargo release from PEGylated MSNs was very slow which make them a promising candidate for bioimaging and cell labeling studies.
In the second part of the study, we selected two model PA molecules, with different charges, to functionalize MSNs with peptides. The glutamic acid and lysine residues on the PAs provide negative and positive charges to the hybrid system, respectively (Figure 2.2). The unmodified MSNs were synthesized in order to compare with peptide functionalized MSNs. The effect of peptide functionalization on cell viability and uptake was investigated by using human umbilical vein endothelial cells (HUVECs) and a vascular smooth muscle cell line (A10). All of the MSN systems demonstrated good cytocompatibility with both cell lines up to a concentration of 200 mg/mL. Interestingly, we observed a remarkable increase (1.8 to 6.3 fold) in the cellular uptake of peptide functionalized MSNs compared to bare MSNs depending on the surface charge of PAs as well as the cell type.
These works published on the Chemical Communications (2013, 49, 9782-9784) and Journal of Materials Chemistry B (2014, 2, 2168-2174) journals. Reproduced with permission from The Royal Society of Chemistry.
7
Figure 2.1: Schematic representation of cargo loaded and F127 or peptide amphiphile capped MSN preparation.
Figure 2.2: Chemical structures of the peptide amphiphile molecules used in this study.
2.2 Experimental Section
Materials: Tetraetyl orthosilicate (TEOS), octyltriethoxysilane (OTS), aminopropyl triethoxysilane (APTES), ammonium nitrate, and hydrofluoric acid (HF), sodium hydroxide, lauric acid were purchased from Merck. Fluorescein isothiocyanate (FITC), cetyltriammoniumbromide (CTAB) ethanol, pluronic polymer (F127), ethanol, hydrochloric acid (37%) (HCl), and doxorubicin hydrochloride (DOX) were purchased from Sigma-Aldrich. Dimethyl sulphoxide (DMSO), methanol, and
8
isopropanol (IPA) were purchased from Carlo-Erba. Tetrahydrofuran (THF) was purchased from Labkim. 9-Fluorenylmethoxycarbonyl (Fmoc) and
tert-butoxycarbonyl (Boc) protected L-amino acids, [4-[α-(2’,4’-dimethoxyphenyl) Fmocaminomethyl]phenoxy] acetamidonorleucyl-MBHA resin (Rink amide MBHA resin), and 2-(1H-Benzotriazol-1-yl)-1,1,3,3 tetramethyluronium hexafluorophosphate (HBTU) were purchased from NovaBiochem and ABCR. All reagents and solvents were used as provided.
Synthesis of MSNs: To synthesize OMSN, first 200 mg CTAB and 5 mg F127 were
dissolved in 96 mL of deionized water and 0.7 mL of 2 M NaOH was added. Then the reaction mixture was heated to 80 °C while stirring vigorously (600 rpm) and 1 mL of TEOS was rapidly added under vigorous stirring (600 rpm). After 90 min, to prepare the octyl containing shell, 0.25 mL of OTS was dissolved in 10 mL THF and slowly added to the reaction mixture. The mixture was further stirred for 3 h. Finally, reaction mixture was cooled down to the room temperature, particles were collected by centrifugation at 9000 rpm for 20 min and washed with ethanol twice. Surfactant molecules were extracted by stirring the particles in 50 mL of 20 g/L ethanolic ammonium nitrate at 60 °C for 30 min. This treatment repeated twice to ensure complete surfactant removal. Particles were washed with methanol twice afterwards and dried at 50 °C overnight. MSN was synthesized without the addition of OTS; other parameters were same with the O-MSN synthesis.
Synthesis of FITC labelled MSNs: In order to synthesize FITC labelled MSNs, first
2 mg of FITC conjugated with 10 µL of APTES in 1 mL of EtOH by gently stirring for 24 h. This solution was added to the reaction mixture right after the TEOS addition. Other parameters were same with the MSN synthesis.
Synthesis and characterization of peptide amphiphile molecules: While positively
charged peptide amphiphile was constructed on MHBA Rink Amide (0.59 mmol/g) resin, negatively charged peptide amphihpile was constructed on Fmoc-Glu-Wang (0.64 mmol/g) resin. All amino acid couplings were performed with 2 equivalents of Fmoc protected amino acid, 1.95 equivalents of HBTU and 3 equivalents of N,N-diisopropylethylamine (DIEA) in DMF for 2 h. Fmoc deprotections were performed with 20% piperidine/dimethylformamide (DMF) solution for 20 min. Cleavage of the peptides from the resin was carried out with a mixture of trifluoroacetic acid (TFA) :
9
triisoproplysilane (TIS) : water in the ratio of 95 : 2.5 : 2.5 for 2 h. Excess TFA was removed by rotary evaporation. The remaining viscous peptide solution was treated with ice-cold diethyl ether and the resulting white pellet was freeze-dried.
Characterization of MSNs: Transmission electron microscopy (TEM) images were
taken using a Tecnai G2 F30 (FEI) microscope. Average particle sizes and zeta potentials of MSNs were measured with Zetasizer Nanoseries (Malvern Instruments). Surface area and pore volume of the particles were determined using iQ-C (Quantachrome). Before measurements, all samples were degassed at 150 ºC for 24 h. Thermal gravimetric analyses (TGA) were performed with Q500, (TA Instruments). Fourier transform infrared (FTIR) spectra of particles were recorded by using a Fourier transform infrared spectrometer (FTIR, Vertex 70, Bruker). Optical absorption measurements in cytotoxicity and hemolysis assays were carried out using a Microplate reader (Spectramax M5, Molecular Devices). Fluorescence spectra of the particles were recorded by a Fluorescence Spectrophotometer (Eclipse, Varian).
Characterization of peptide amphiphile molecules: The peptide amphiphiles were
identified and analyzed by reverse phase HPLC on an Agilent 6530 accurate-Mass Q-TOF LC/MS equipped with an Agilent 1200 HPLC. An phenomenex Luna 3µ C8 100A (50 x 3.00 mm) column as stationary phase and water/acetonitrile gradient with 0.1% volume of formic acid as mobile phase were used to identify positively charged peptide amphiphile. For negatively charged peptide amphiphile, an Agilent Zorbax Extend-C18 (2.1x50 mm) column as stationary phase and water/acetonitrile gradient with 0.1% volume of ammonium hydroxide as mobile phase were used. The positively and negatively charged peptide amphiphiles were purified by using 1200 Agilent HPLC on Zorbax 300SB C8 (21.2x150 mm) PrepHT and Zorbax-Extend C18 (21.2x150 mm) PrepHT column, respectively.
F127 capping of OMSN: 25 mg of OMSN was dispersed in 50 mL of F127 solution
in water (5 mg/mL) by sonication and stirring. The dispersion sonicated for 15 min and afterwards stirred vigorously for 1 h. F127 capped particles were precipitated at 9000 rpm for 20 min and redispersed in 50 mL of F127 solution in water (5 mg/mL). Aforementioned sonication and stirring steps were repeated. Finally, particles were precipitated and washed with water or phosphate-buffered saline (PBS) twice to remove the excess F127 molecules.
10
Peptide amphiphile capping of OMSN: While 14 mg of each peptide amphiphile
was sonicated in 12 mL deionized water, 2 mg of OMSN was slowly added to the system. Peptide amphiphiles and OMSN were mixed with a weight ratio of 1:7. They were sonicated and vortexed for 3 h at RT. Solution was centrifugated at 5000 rpm. After all portions were concentrated by centrifugation, they were rinsed with water and centrifugated twice.
DOX loading and release experiments: In order to load DOX into the pores of MSN
or O-MSN, 10 mg of particles were dispersed in 1 mL of DOX solution (7.5 mg/mL) in ethanol and shook at 300 rpm for 24 h. Then the particles were collected by centrifugation. DOX loaded MSNs were washed with water twice to remove the non-adsorbed DOX molecules. For OMSN before precipitation 5 mg of F127 added into the solution. DOX loaded OMSN were transferred into the water as described above to produce DOX loaded F127-OMSN. The amounts of adsorbed DOX were determined by monitoring the fluorescence of DOX at 590 nm (excitation wavelength is 488 nm) after etching the silica in 1.2% HF solution for overnight.
DOX release profiles of MSN and F127-OMSN was determined by dispersing 5 mg of particles in 8 mL of PBS at pH 7.4 or pH 5.5 and each solution were separated to 10 Eppendorf tubes. The tubes were shaken at 37 °C for 12 h and at different time intervals one tube removed and centrifuged. The volumes of supernatants were completed to 20 mL and fluorescence peak of DOX at 590 nm was monitored using a fluorescence spectrophotometer in order to determine the released DOX amount.
R6G loading and release experiments: In order to load R6G into the pores of MSN
or O-MSN, 30 mg of particles were dispersed in 15 mL of R6G solution (7.5 mg/mL) in IPA and stirred at 60 °C for 2 days. Then the particles were collected by centrifugation at 9000 rpm for 20 min. R6G loaded MSNs were washed with water to remove the non-adsorbed R6G molecules. On the other hand, R6G loaded OMSNs were washed with water after capping with F127 since OMSN is insoluble in water. R6G loaded F127-OMSN was prepared as described above using R6G loaded O-MSNs and washed with water before using in release experiments. The amounts of adsorbed R6G were determined by monitoring the absorption peak of R6G at 526 nm after etching the silica in 1.2% HF solution for overnight.
11
by dispersing 10 mg of particles in 25 mL PBS (pH 7.4). The dispersions were stirred at 37 °C for 48 h and at different time intervals small amount of samples were taken and centrifuged. Then, amount of released R6G in the supernatants were calculated using a UV-Vis spectrophotometer from the absorption peak of R6G at 526 nm.
Cell culture for PEGylated OMSN: Human breast adenocarcinoma cells (MCF-7)
were grown to confluence at 37 °C under 5% CO2 in Dulbecco’s Modified Eagle
Serum (DMEM) containing 1% penicillin/streptomycin, 10% fetal bovine serum (FBS) and 2 mM L-glutamine.
Cell viability tests for PEGylated OMSN: Cells in the logarithmic growth phase
were washed once with PBS, trypsinized and resuspended in fresh medium. The cells were seeded in 96-well plates at 5 x 10³ cells/well. After 24 h of culture, the medium was removed by aspiration and replaced with 100 μL of fresh medium containing MSN or F127-OMSN at concentrations of 100, 250, 500 or 1000 μg/mL and incubated for 24 or 48 h. The cytotoxicity of particles was determined by the 3-(4,5-dimethyl-2-thiazolyl)-2,5-diphenyltetrazolium bromide (MTT) reduction assay (Sigma, Aldrich). At least two well columns containing cells without the particles were used as a negative control. MTT reagent (5 mg/mL) containing medium was added to each well, and the plates were incubated in the dark for 4 h at 37°C. After incubation, medium was removed and the resulting purple formazan crystals were dissolved by adding medium. Then the optical density was measured at 570 and 680 nm by using a microplate reader (SpectraMax, M5). The optical density of wells containing untreated cells was considered as 100%. All the experiments were performed in triplicate.
Cell culture for peptide coated OMSN: Viability and uptake experiments were
performed by using human umbilical vein endothelial cells (HUVECs) and A10 rat aortic smooth muscle cells (ATCC® Cat# CRL-1476™). HUVECs were donated by Yeditepe University, Istanbul, Turkey. HUVECs were purified as described [44, 45] and characterized by staining with CD34, CD31, and CD90 surface markers. These cells were found to be positive for CD31 and CD34 but negative for CD90. A10 and HUVEC cells were cultured in 75 cm2 polystyrene cell culture flasks with standard medium, containing Dulbecco's modified eagle medium (DMEM) with 10% fetal bovine serum (FBS), and 1% penicillin–streptomycin and passaged at cell confluency between 80 and 90% using trypsin-EDTA. In all experiments, particles were
12
administered in serum free medium (1% penicillin-streptomycin containing DMEM) to avoid any influence of serum proteins on the uptake mechanism.
Cell viability tests for peptide coated OMSN: The cell viability assay was performed
using Alamar Blue Assay (Invitrogen). 5000 cells per well (HUVECs or A10) were seeded on a 96-well plate in 100 mL of standard medium. After 24 h, the medium was removed and 100 mL of serum free medium was added. 25 mL of freshly prepared nanoparticle solutions in water at different concentrations were administered to have final concentrations of 200, 100, 50, and 10 µg/mL. For cell viability tests, cells were exposed to particles for 4 h, then the medium was changed to standard medium and the cells were further incubated for 20 h. Then, Alamar Blue reagent diluted to 10% in DMEM was added. After 3 h, fluorescence at 570/612 nm (Ex/Em) was measured using a microplate reader (SpectraMax, M5).
Hemolysis assay: EDTA stabilized human blood samples were collected from
volunteers at Bilkent University Health Center (Ankara, Turkey). Fresh blood samples (3 mL) were centrifuged at 1600 rpm for 5 min and RBCs were obtained after removing the blood plasma. Precipitated RBC pellet was washed five times with 6 mL of PBS and RBCs were dispersed in 25 mL of PBS. 0.2 mL of RBCs were placed in plastic vials and 0.8 mL of MSN or F127-OMSN solutions in PBS at different concentrations were added. Also, positive and negative control samples were prepared by adding 0.8 mL of water and PBS, respectively. The samples were incubated at room temperature for 2 h. Samples were slightly shaken once for every 30 min to resuspend the RBCs and MSNs. After incubation, RBC were precipitated at 1600 rpm and 200 µL of supernatants was transferred to a 96-well plate to measure the absorbance of released hemoglobin, from damaged RBCs, with a microplate reader at 570 nm. Absorbance at 655 nm was recorded as reference. Hemolysis percentages of the RBCs were calculated using the following formula;
% Hemolysis = (abs of sample-abs of negative control) / (abs of positive control-abs of negative control)
Percent hemolysis values were calculated from three separate experiments.
Blood clotting assay: For PT and aPTT measurements, human blood samples were
collected to citrate stabilized vials from volunteers. Plasma samples were freshly prepared from the blood samples and immediately used in the experiments. 50 µL of
13
MSN or F127-OMSN solutions in PBS were added to the 450 µL of plasma samples, and incubated for 5 min at 37 °C. Final particle concentrations in the resulting solutions were 0.1 and 1 mg/mL. After incubation, particles were removed by centrifugation and 50 µL portions of supernatants were used to measure PT and aPTT values using a semi-automatic blood coagulation analyzer (Tokra Medikal, Ankara, Turkey). Also, control measurements were performed using 50 µL PBS. All PT and aPTT values were calculated from three separate measurements.
Uptake studies: 13 mm glass coverslips were placed in 24 well plate, 40000 cells
(HUVEC or A10) in standard medium (DMEM with 10% FBS, 1% PS) were seeded in each well on coverslips. After 24 h medium was discarded, 400 µL of serum free medium was added to each well. 100 µL of bare or functionalized MSN particles were administered to have a 200 µg/mL final concentration of MSN. After 4 h of administration medium was changed to standard medium. After 20 h cells were washed with PBS several times and fixed with 4% paraformaldehyde for 15 min. Then, cells were permeabilized with 0.1% TritonX-100 (Sigma-Aldrich) for 12 min and actin proteins were stained with Phalloidin-TRITC (Sigma-Aldrich) for 20 min. Coverslips were mounted on slides with Antifade (Invitrogen). Samples were visualized under laser scanning confocal microscopy (Zeiss, LSM 510).
Flow Cytometer Analysis: 100000 HUVEC or A10 cells were seeded in each well
of 6 well plate in standard medium (DMEM with 10% FBS, 1% PS). After 24 h medium was discarded, 1600 µL of serum free medium was added in each well. 400 µL of bare or functionalized MSN particles were administered to have a 200 µg/mL final concentration of MSN. After 4h of administration, medium was changed to standard medium and cells were incubated for 20 h, then washed with PBS and trypsinized. Cells were collected by centrifugation and washed twice with PBS. Cells were resuspended in 1 mL PBS and kept on ice before analysis. FITC channel is used to analyze MSN particle uptake in flow cytometer (BD, FACS Aria III). Student's t-test was applied to all datasets and the difference between them was accepted to be statistically significant when p < 0.05.
14
2.3 Synthesis and Characterization of PEGylated MSNs
Octyl modified MSNs (OMSN) were prepared via respective condensation of tetraethyl orthosilicate (TEOS) and octyltriethoxy silane (OTS) monomers in a one-pot reaction [45-47]. After polymerization of TEOS and formation of initial MSNs, OTS monomers were added in order to obtain hydrophobic coatings on MSNs. Also, for control experiments bare MSNs were synthesized without the addition of OTS. Figure 2.3 shows TEM images of the prepared MSNs. The MCM-41 type ordered hexagonal porous structure was observed for bare MSN (Figure 2.3a). Interestingly, OMSN revealed bimodal pore structure; a randomly porous shell was observed over the MCM-41 type porous core (Figure 2.3b). The shell thickness was calculated to be 12 ± 3 nm from the TEM images. Also, average particles sizes and particle size distributions for both particles were determined from TEM images and given in Figure 2.4.
Figure 2.3: TEM images of mesoporous silica nanoparticles. (a) Bare MSN, (b) and (c) OMSN, and (d) F127-OMSN.
15
Figure 2.4: Particle size distributions of MSN and OMSN which were calculated according to the TEM images. Octyl modification significantly increased particle size indicating octyl containing shell formation.
Surface area and pore volume of the particles were calculated from the adsorption/desorption data (Figure 2.5). OMSN revealed slightly lower surface area (961.2 m2/g) and pore volume (1.01 cm3/g) compared to MSN (1115.7 m2/g and 1.25 cm3/g). The decrease in the surface area and pore volume is the result of pore narrowing after octyl modification [45]. OMSN formed aggregates while drying on the TEM grid, due to the hydrophobic interactions between particles (Figure 2.3c). On the other hand, after coating with the pluronic polymer (F127-OMSN), particles are well dispersed on the grid (Figure 2.3d) indicating the formation of F127 coating on particles.
16
Figure 2.5: Nitrogen adsorption and desorption curves of MSN and OMSN. Octyl addition slightly reduced the surface area and pore volume of the particles.
The formation of F127 layer on particles was further confirmed by TGA (Figure 2.6). For MSN, weight loss at 800 °C was only 8.3% which is due to residual surfactant molecules and dehydroxylation of silica surface [48]. For OMSN, weight loss reached to 18.8% due to the decomposition of octyl groups. On the other hand, a large weight loss (47.1%) was observed for F127-OMSN. There are two sharp decreases in the TGA spectrum of F127-OMSN, which are corresponding to decomposition of F127 and octyl groups. In addition, FTIR spectra (Figure 2.7) of the particles clearly demonstrated the successful octyl modification and F127 capping of MSNs.
17
Figure 2.6: TGA spectra of MSN, OMSN, F127-OMSN and F127 polymer. After octyl addition and F127 capping weight loss of the particles gradually increased proving the formation of octyl and F127 layer around MSNs.
Figure 2.7: FTIR spectra of MSN, O-MSN, F127-OMSN and F127 polymer showing successful octyl modification and F127 capping of particles.
18
Good dispersity in biological media is vitally important for developing biocompatible and effective nanomaterials for biological applications, since aggregated particles can induce toxicity in several organs and result in poor pharmacokinetics [49]. The F127-OMSN showed excellent dispersity in both water and PBS (pH = 7.4) at a high concentration (1 mg/mL). The particle size distribution in both media was almost identical and average particle size was around 280 nm (Figure 2.8). The good aqueous dispersity of F127-OMSN in highly salted media is attained by and non-ionic and hydrophilic PEG blocks. On the other hand, MSN was fairly dispersible in water at 1 mg/mL, with slightly broader size distribution than F127-OMSN and an average particle size around 235 nm (Figure 2.8). However, MSN easily aggregated and precipitated in highly salted PBS media in a couple of minutes at the same concentration (Figure 2.8 inset). Therefore, a more dilute solution (0.1 mg/mL) was used to retard the particle precipitation and particle size distribution of MSN in PBS was determined. Even at this low concentration MSN formed large aggregates and exhibited a broad particle size distribution with a large average particle size of ~2 µm (Figure 2.8).
Figure 2.8: Dispersibility of MSN particles in aqueous media. Size distributions of MSN and F127-OMSN in water and PBS. Inset show the photograph of MSN (left) and F127-OMSN (right) dispersions in PBS showing the colloidal stability of PEGylated MSNs.
19
To test the stability of F127 coating, we precipitated the particles, removed the supernatant and re-dispersed them in PBS; this cycle was repeated for ten times. Average particle size almost remained intact after the washing cycles (Figure 2.9). The good stability of the F127 layer is due to the strong hydrophobic interaction between octyl groups of OMSN and hydrophobic PPO block of the F127, which is stronger than either hydrogen bonding or electrostatic interactions in highly salted solutions [21].
Figure 2.9: The average zeta size of F127-OMSN in PBS after several washing cycles. Even after 10 washing cycles average particle size remained almost intact indicating the good stability of self-assembled pluronic layer.
2.4 Biocompatibility of PEGylated MSNs
In order to evaluate the in vitro cytocompatibility of the particles 3-(4,5-dimethylthiazol-2-yl)-2,5-diphenyl-tetrazolium bromide (MTT) cytotoxicity assay was used between particle concentrations of 0.1 and 1 mg/mL. Figure 2.10 indicates that both MSN and F127-OMSN are highly compatible with MCF-7 (human breast cancer cell line) cells after incubation times of 24 or 48 h.
20
Figure 2.10: Cell viability results of MSN and F127-OMSN after 24 and 48 h.
Blood compatibility of nanomaterials is a crucial issue when they are applied by intravenous injection, a commonly applied route for drug delivery [18, 50]. It is well known that interaction of MSNs with blood constituents may cause serious toxicity such as hemolysis of red blood cells (RBCs) and blood clot formation (thrombogenicity) [17, 51]. Therefore, we investigated the hemolytic activity and thrombogenicity of MSNs and F127-OMSN using a hemolysis assay [17] and measuring their activated partial thromboplastin time (aPTT) and prothrombin time (PT) [51]. Hemolytic activity of the particles was monitored by measuring light absorption (at 570 nm) of released hemoglobin from the lysed RBCs. MSN revealed significant hemolytic activities of 5.8% at 0.25 mg/mLand 56.8% at 1 mg/mL (Figure 2.11a). Strong electrostatic interaction between negatively charged silanol groups and positively charged trimethyl-ammonium head groups of the membrane lipids can cause membranolysis of RBCs [50]. Capping the MSNs with uncharged F127 molecules completely prevented the hemolytic activity even at high particle concentration (1 mg/mL) by blocking the electrostatic interaction of silanol groups with the RBC membrane (Figure 2.11a). Also, photograph of the MSN treated RBCs show the released hemoglobin (red colour) to the supernatant, whereas no red colour was observed for F127-OMSN treated cells (Figure 2.11a, inset). PT and aPTT test are
21
applied to investigate extrinsic and intrinsic blood coagulation pathways, respectively. The PT and aPTT results of the particles at low (0.1 mg/mL) and high (1 mg/mL) concentrations revealed that all the values are in their normal range (Figure 2.11b) [50]. It is well known that some dry and porous silica materials can activate the coagulation cascade due to their high absorption capacities [51]. On the other hand, the pores of the MSN and F127-OMSN are already filled with PBS, which significantly decreases the absorption capacity of particles and results in the observed non-coagulant behaviour of the particles [50, 51].
Figure 2.11: (a) Hemolysis results of MSN and F127-OMSN. Inset shows photographs of RBCs treated with MSN (up) and F127-OMSN (down) at different concentrations. (b) PT and aPTT values of particles.
2.5 Fluorescent Dye or Drug Loaded PEGylated MSNs
To prepare fluorescent PEGylated MSNs, we loaded Rhodamine 6G (R6G) dye to OMSN [52]. Also, for control experiments we loaded R6G to MSN. We calculated a R6G loading capacity of 6.21 wt % for MSN. For O-MSN, we observed a lower loading efficiency (2.74 wt %) at same conditions which is due to the lower surface area and pore volume of octyl modified particles. Also, blocking of the negatively charged silanol groups, which are expected to interact electrostatically with the positively charged R6G molecules, by octyl groups may contribute to the lower drug absorption capacity of the OMSN. Powder of R6G loaded OMSNs were directly capped with F127 in PBS. Figure 2.12a shows the fluorescence spectrum of R6G
22
loaded OMSN. We observed very slow release of R6G for R6G loaded F127-OMSN which makes it promising for cell labelling and bioimaging applications. It is important to note that same strategy can be applied almost any dye molecule. After 48 h F127-OMSN released only 20.1% of its load, as the R6G loaded pores are closed with F127 layer (Figure 2.12b). The dense polymer layer slows down the R6G release by acting as a diffusion barrier. On the other hand, a typical burst release profile was observed for MSN; 78% of the R6G molecules were released after 12 h.
Figure 2.12: (a) Fluorescence spectrum of R6G loaded F127-OMSN. (b) ) R6G release profiles of MSN and F127-OMSN.
Drug loading and release studies were performed using a cancer drug, doxorubicin (DOX). We calculated a DOX loading capacity of 15.3 µg/mg for MSN. For OMSN, we observed a slightly lower loading efficiency (11.5 µg/mg) at same conditions which is most likely due to the lower surface area and pore volume of octyl modified particles. Powder of DOX loaded OMSNs were directly capped with F127 in PBS (pH 7.4) and used in drug release studies. We observed slower release profiles for F127-OMSN at both acidic (pH 5.5) and neutral (pH 7.4) conditions compared to MSN (Figure 2.13). For instance, at pH 5.5 MSN released 93.9% of its load in 12 hours, on the other hand, 64.2% DOX release was observed for F127-OMSN at same conditions. The F127 polymer layer around the particles slows down the DOX release rate by acting as a diffusion barrier against cargo release from the pores. Also, at pH 5.5 faster DOX release was observed for both particles compared to pH 7.4, which is in good