BURSA TECHNICAL UNIVERSITY ❖ GRADUATE SCHOOL OF NATURAL AND APPLIED SCIENCES
M. Sc. THESIS
DECEMBER 2018
INDOOR LOCATION FINDING OF THE TRANSMITTER BASED ON BLUETOOTH RECEIVED SIGNAL STRENGTH
Ayşenur HATİPOĞLU
DECEMBER 2018
BURSA TECHNICAL UNIVERSITY ❖ GRADUATE SCHOOL OF NATURAL AND APPLIED SCIENCES
INDOOR LOCATION FINDING OF THE TRANSMITTER BASED ON BLUETOOTH RECEIVED SIGNAL STRENGTH
M. Sc. THESIS Ayşenur HATİPOĞLU
(141081503)
Department of Mechatronics Engineering
Thesis Advisor : Dr. Murat TÜRE ... Bursa Technical University
Assoc. Prof. Dr. Ahmet MERT ... Bursa Technical University
Jury Members : Prof. Dr. Tuncay ERTAŞ ... Bursa Uludağ University
Ayşenur HATİPOĞLU, a M. Sc. Student of BTU Graduate School of Natural and Applied Sciences student id 141081503 successfully defended the thesis/dissertation entitled “INDOOR LOCATION FINDING OF THE TRANSMITTER BASED ON BLUETOOTH RECEIVED SIGNAL STRENGTH”, which she prepared after fulfilling the requirements specified in the ossociated legislations, before the jury whose signatures are below.
Director of Graduate School of Natural and Applied Sciences : Assoc. Prof. Dr. Murat ERTAŞ ... Bursa Technical University .
.../.../...
Date of Examination : 26 December 2018PLAGIARISM DECLARATION
In this thesis, I declare that all information and results presented in visual, audio and written form have been obtained by me in compliance with academic and ethical rules. I declare that, all results and information in this thesis which are not specific to this study have been documented with sources and in the contrary case, I accept all kinds of legal results.
Student Name Surname: Ayşenur Hatipoğlu
iv FOREWORD
I desire to express my sincere gratitude to my master thesis supervisor Dr. Murat TÜRE for his valuable helps and guidance throughout the research.
I also express my sincere thanks to my previous supervisor Dr. İsmail BÜTÜN because of his kind support during my master thesis.
I also would like to submit my thanks to Ahmet KAZOKOĞLU (MSc EE) for his support with his valuable knowledge.
My sincere thanks also goes to my friend Figen KILIÇ (MSc EE) for her encouragement and support.
Finally, I would like to submit special thanks to my beloved family and my sons for their valuable support, helps and patience.
v TABLE OF CONTENTS Page FOREWORD ... iv TABLE OF CONTENTS ... v ABBREVIATIONS ... vii SYMBOLS ... viii LIST OF TABLES ... ix LIST OF FIGURES ... x SUMMARY ... xi ÖZET……….. ... xii 1. INTRODUCTION ... 1 2. LITERATURE REVIEW ... 3
3. INDOOR POSITIONING DETAILS ... 6
3.1 Technologies ... 6
3.1.1 Wi-Fi ... 6
3.1.2 RFID ... 7
3.1.3 UWB ... 9
3.1.4 Bluetooth ... 10
3.2 Position Estimation Methods ... 12
3.2.1 Triangulation ... 12
3.2.2 Trilateration ... 13
3.2.3 Proximity ... 15
3.2.4 Fingerprint ... 16
3.3 Signal Measurement Methods ... 18
3.3.1 Received signal strength (RSSI) ... 18
3.3.2 Angle of arrival (AOA) ... 19
3.3.3 Time of arrival (TOA) ... 20
3.3.4 Time difference of arrival (TDOA) ... 20
3.4 Implementation Strategies ... 21
3.4.1 Device-based positioning ... 22
3.4.2 Network-based positioning ... 22
3.5 Academic and Commercial Applications ... 23
3.6 Related Works ... 23
4. BLE BASED INDOOR POSITIONING SYSTEM ... 27
4.1 Test Environment and Setup ... 28
4.1.1 Hardware ... 29
4.1.2 Software ... 31
4.2 Data Acquisition and Analysis ... 35
4.2.1 Calibration effort ... 35
4.2.2 Methods ... 38
4.2.2.1 Trilateration ... 38
vi
4.2.2.3 Newton Raphson iteration ... 42
4.2.3 Tests and results ... 45
5. CONCLUSION AND FUTURE WORKS ... 52
REFERENCES ... 54
vii ABBREVIATIONS
AOA : Angle of Arrivals
AP : Access Point
BLE : Bluetooth Low Energy GPS : Global Positioning System
GNSS : Global Navigation Satellite System IPS : Indoor Positioning Systems
JSON : Java Object Notation LOS : Line of Sight
LTE : Long Term Evaluation LLS : Linear Least Squares NLOS : Non-Light of Sight NLS : Nonlinear Least Squares
RF : Radio Frequency
RFID : Radio Frequency Identification RSSI : Received Signal Strength Indicator RTLS : Real Time Location System
SVM : Support Vector Mchine TDOA : Time Difference of Arrival TOA : Time of Arrival
TOF : Time of Flight
UWB : Ultra Wideband
UUID : Universally Unique Identifier VLC : Visual Light Communication
WCF : Windows Communication Foundation Wi-Fi : Wireless Fidelity
viii SYMBOLS
𝑨𝒊 : One meter RSSI value 𝑨 : Linear Least Square matrix
𝒅 : Distance
hr : Receiver antenna height ht : Transmitter antenna height
𝑱 : Jacobian matrix
𝑱𝑻 : Transpose of Jacobian matrix
𝒏 : Path loss exponent
Pr : Received power
Pt : Transmitted power
Gr : Receiver antenna gain Gt : Transmitter antenna gain r1,r2,r3 : Radius of three APs x1,x2,x3 : x-Axis coordinates y1,y2,y3 : y-Axis coordinates z1,z2,z3 : z-Axis coordinates xb,yb : Coordinates of Beacon
: Standard Deviation
ix LIST OF TABLES
Page
Table 3.1 : Fingerprinting algorithms ... 17
Table 3.2 : Commercial and academic localization systems ... 24
Table 4.1 : Algorithm of distance calculation from RSSI ... 33
Table 4.2 : RSSI measurements vs distance ... 37
Table 4.3 : Path loss exponents and standard deviations of the APs ... 38
Table 4.4 : Trilateration algorithm ... 40
Table 4.5 : Linear Least Squares algorithm... 42
Table 4.6 : Newton Raphson algorithm ... 45
Table 4.7 : Comparison of Test.1 results ... 48
Table 4.8 : Comparison of Test.2 results ... 49
Table 4.9 : Comparison of Test.3 results ... 50
x LIST OF FIGURES
Page
Figure 3.1 : Indoor positioning technologies ... 6
Figure 3.2 : Wi-Fi based indoor positioning ... 7
Figure 3.3 : Schematic of RFID.. ... 8
Figure 3.4 : Bluetooth Smart device ... 11
Figure 3.5 : Positioning techniques ... 12
Figure 3.6 : Triangulation formulation. ... 12
Figure 3.7 : Triangulation with three AP. ... 13
Figure 3.8 : Position Estimation with three AP………. . ……..14
Figure 3.9 : TDOA ... 21
Figure 3.10 : Device-based positioning. ... 22
Figure 3.11 : Network-based positioning ... 23
Figure 4.1 : System structure ... 27
Figure 4.2 : Test area: (a) Left side (b) Right side. ... 28
Figure 4.3 : Plan of the test area. ... 29
Figure 4.4 : EMBC01 proximity Beacon ... 30
Figure 4.5 : Picture of Raspberry Pi3 ... 31
Figure 4.6 : Receiver software flowchart ... 32
Figure 4.7 : Service flowchart ... 32
Figure 4.8 : Calibration interface ... 33
Figure 4.9 : Analyser software flowchart ... 34
Figure 4.10 : Analyser interface ... 35
Figure 4.11 : Flowchart of calibration phase ... 36
Figure 4.12 : Average RSSI vs angle ... 36
Figure 4.13 : Low pass filter ... 37
Figure 4.14 : Exception cases for trilateration: (a) No intersection (b) One circle covers another (c) Two circle intersection ... 39
Figure 4.15 : RSSI values of six AP ... 46
Figure 4.16 : Actual and estimated distances of Beacon ... 46
Figure 4.17 : Circles of Test.1... 47
Figure 4.18 : Best intersection of Test.1 ... 47
Figure 4.19 : Circles of Test.2... 49
xi
INDOOR LOCATION FINDING OF THE TRANSMITTER BASED ON BLUETOOTH RECEIVED SIGNAL STRENGTH
SUMMARY
Around the world, positioning in open environments is done via satellites. Generally, these systems are called Global Navigation Satellite Systems (GNSS). The most widely used GNSS is the Global Positioning System (GPS). GLONASS and Galileo are other GNSS systems which are used in Europe and Russia. Satellite positioning systems require a direct line of sight (LOS) with satellites to provide high accuracy. The GPS sensitivity can be reduced by a few meters in open areas. Due to physical objects like doors, walls of buildings, potential interference sources like electronic equipment, electrical sources, metal objects, it is almost impossible to use satellite positioning systems in indoor environment thus Indoor Positioning Systems (IPS) are being developed. In this thesis, we implement an Indoor Positioning System based on Bluetooth Smart Technology for signaling between transmitter and receivers. Besides, Trilateration and Linear Least Squares methods are used to determine the position of the transmitter together with the radio received signal strength. The estimated values are optimized by the Newton Raphson iteration method. The analysis of the results shows that the achieving mean errors is between 0.11 to 2.2 meters for stationary devices in a large-size laboratory. In the implemented system person of interests or items are not required to possess mobile devices, it is enough to carry Bluetooth Beacon devices which are cheap and efficient in terms of power consumption.
Key words: Bluetooth, Indoor Positioning, RSSI, Trilateration, Linear Least Squares, Newton Raphson
xii
ALGILANAN BLUETOOTH SİNYAL GÜCÜ İLE İÇ MEKANLARDA SİNYAL KAYNAĞININ KONUM TESPİTİNİN YAPILMASI
ÖZET
Açık ortamlarda konum takibi tüm dünyada uydular aracılığıyla yapılmaktadır. Genel olarak bu sistemlere Küresel Uydu Seyrüsefer Sistemi (GNSS) adı verilir. En yaygın kullanılan GNSS Küresel Konumlama Sistemi (GPS) 'dir. GLONASS ve Galileo, Avrupa ve Rusya'da kullanılan diğer GNSS sistemleridir. Uydu konumlandırma sistemleri, yüksek doğruluk sağlamak için uydularla doğrudan görüş hattı (LOS) gerektirmektedir. Açık alanlarda GPS hassasiyeti birkaç metreye kadar düşebilmektedir. Kapılar, binaların duvarları gibi fiziksel nesneler, elektronik cihazlar, elektrik kaynakları, metal nesneler gibi potansiyel bozucuların bulunması nedeniyle iç ortamda uydu konumlandırma sistemlerini kullanmak neredeyse imkânsızdır ve İç Mekân Konumlandırma Sistemleri (IPS) geliştirilmektedir. Tez çalışmasında, verici ve alıcılar arasında sinyal gönderimi Bluetooth Smart teknolojisine dayanan bir iç mekan konumlandırma sistemi uygulanmıştır. Ayrıca vericinin konumunun belirlenmesinde, algılanan sinyal gücü değeriyle beraber Trilaterasyon ve En Küçük Kareler yöntemleri kullanılmıştır. Elde edilen tahmin değerleri Newton Raphson iterasyon yöntemi ile optimize edilmiştir. Sonuçların analizi büyük ölçekli bir laboratuvarda durağan cihazlar için ulaşılan ortamala hatanın 0.11 ile 2.2 metre arasında olduğunu göstermiştir. Gerçekleştirilen sistemde, ilgili kişilerin veya öğelerin mobil cihazlara sahip olması gerekli değildir, güç tüketimi açısından verimli ve ucuz olan Bluetooth Beacon cihazlarını taşımak yeterlidir.
Anahtar Kelimeler: Bluetooth, İç mekan konumlandırma, RSSI, Trilaterasyon, En Küçük Kareler, Newton Raphson
1 1. INTRODUCTION
In recent years, the rapid developments in technology have provided daily use of many technologies that were formerly used at the military level. Outdoor positioning is based on satellites like GPS, GLONASS, GALILEO and there are many applications and consumer products for personal, vehicle, pet, object tracking. GPS tracking is the best known among the satellite tracking systems.
Satellite positioning is completely free and a small hand-held terminal is sufficient for tracking. If you want to use it in different applications, then you have to pay to the service provider. There is no precise method for indoor positioning such as GPS with high accuracy. The reason is the non-line of sight conditions, high attenuation, severe multipath and signal scattering, fast temporal changes due to indoor environment conditions, high demand for accuracy and precision, characteristics of transmitters and receivers. Because of the reasons mentioned, a different positioning system is used for indoor position tracking. The system is called Indoor Positioning System (IPS) and this is used for locating objects or people inside a building by using magnetic fields, acoustic signals, radio waves, or other sensory information collected by mobile devices [1] and access points. IPSs are based on Wi-Fi, RFID, Bluetooth, Ultrasound, VLC and Ultra Wide Band, sensor technologies and there are many application areas related to the subject like smart factories, hospitals. There are indoor navigation systems for the hearing and visually impaired person, patient tracking, locating device through buildings, aiding tourists in museums, tracking kids in crowded places and tracking expensive equipments.
The main goal of this research is to learn detailed information about indoor localization and develop an indoor positioning system based on BLE 4.0 technology which is suitable for dynamic environments, portable; means applicable to different indoor scenarios, adaptive and has low cost. This master thesis is composed of three parts. First part provides background information which is the theoretical foundations for other parts. This is literature review and positioning details in which all detailed informations about the techniques, technologies, methods, algorithms and
2
implementation approaches of indoor positioning are given. Test environment and installation of the BLE based indoor positioning system, hardware and software details, calibration phase, data collection and analysis, methods used, tests performed and results are included in the second part of the study. In the last part the conclusion and future works are mentioned.
3 2. LITERATURE REVIEW
Today, applications about indoor positioning are expanding continuously and position determination is performed via smart devices [2]. Sensor nodes became smaller, intelligent and by the help of the networking capabilities they are spreaded. There is not a strict way, there are different wireless technologies and any of them can be used.
RFID is one of the most popuplar localization technology found in literature review. Particularly, 2D studies are performed generally and sufficient accuracy can not be reached with this system. A 3D implementation approach for improving accuracy with RFID is purposed as a solution [3]. RFID-based RTLS systems are also available today, especially being used in hospitals and factories. With these systems, it is possible to determine the location in room-level.
Zigbee is also popular for indoor studies. There are examples in literature in which Zigbee technology is used with different techniques. In a study an indoor positioning system based on RSSIs and fingerprinting using ZigBee technology was conducted [4]. Another ZigBee based indoor location system uses k-nearest neighbor algorithm with real time RSSI to calculate mobile node’s position [5]. Generally indoor positioning systems use WLAN infrastructure deployed in buildings. The signal strength of the Wi-Fi was used in a study to estimate the location of the people indoor. Three APs are positioned similar to the GPS concept and trilateration technique is used for positioning [6]. There is an example for ultra wideband technology usage in indoor positioning. In the scope of this paper [7] a SWOT analysis was performed that identifies strength, weakness, threats and opportunities that affect UWB technology.
There is a master thesis which explains the details of indoor positioning that uses RSSI of Bluetooth Smart in the literature. This is a useful work that evaluates four different algorithms which are trilateration, iterative trilateration, a partical filter and a fingerprinting [8]. In the literature survey, many thesis and papers based on Bluetooth have been found [9,10,11]. A study presents a system that uses Bluetooth signals with trilateration achives mean errors around 1 to 3 meters [12].
4
There is another study that finds the location of patients' by using BLE technology in the hospital environment through the signal values taken by mobile application.Their positioning algorithm has 97.22% accuracy [13].
In the recent years, studies related to the subject matter has also increased in Turkey. In the literature survey, a new algorithm consisting of differential power analysis and continuous signal effect is proposed for closed area positioning optimization on a grid-based fingerprinting algorithms by using existing Wi-Fi infrastructure for a mobile device [14].
Generally studies are focused on mobile devices – mobile devices determine the location of the person of interest (POI) [15,16]. However, in this thesis, the POI’s are not required to possess mobile devices but to carry Bluetooth beacon devices which are extremely cheap compared to mobile devices. POI’s will carry beacons and Raspberry-Pi based Wi-Fi Hotspots will relay this information to the server. The performance of the generated systems depends on many parameters. Some parameters are listed below; The most important among these parameters is accuracy, which is the mean distance error between the estimated location and the actual location of the device. This depends on the technology, radio propagation characteristics of the environment, the technique that is used for estimation. The higher accuracy means better system.
RF signal behavior is an important parameter. Especially in Wi-Fi based positioning systems, result is directly influenced by the signal behavior [17].
Signal behaviors are; absorption, reflection, diffraction, breakage.
Signal behavior reasons; indoor environment, antenna effect, human existence, access point density and placement.
Signal behavior results; multi dimensional damping, shadowing, signal path loss, tunnel effect.
Other metric is precision. This is the probability of successful or unsuccessful location estimates within a given accuracy. Calibration complexity is another metric that is the hardware and software implementation of the system and it should be easy to install and setup. Scalability character is an important metric. The positioning system should be easily extensible when the scope of the positioning gets larger based on geography and number of users. Cost metric of the system depends on
5
money, time, space, weight and energy. These factors are important in different levels of the system which are installation and maintenance, infrastructure components, and positioning devices [18]. Robustness and Adaptability is also another metric. The positioning system should continue to function reliably without being greatly affected by the changes that may occur in the environment and without requiring major reconfigurations. Integrity metric is the output confidentiality of the localization system. Difference between the estimated location and actual location should be in acceptable value if there is any malfunction. The system should be portable and it can be used in different scenarios. Coverage area metric refers to the area covered by the system. Indoor localization systems have local coverage means that covers a limited area. This system can be scaled by adding new hardware devices.
6 3. INDOOR POSITIONING DETAILS
3.1 Technologies
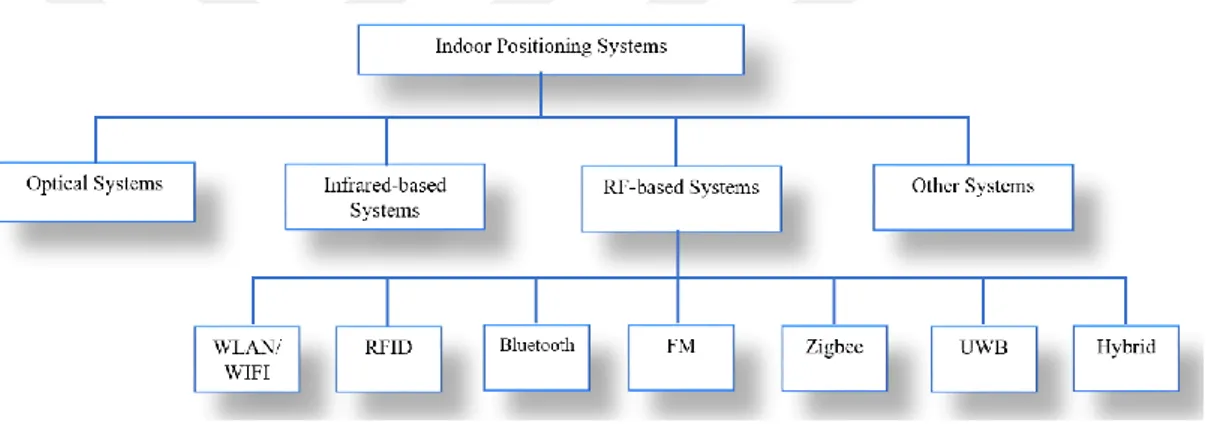
Different technologies are used for locating the indoor position. When researches are examined, it is observed that the most popular technologies are Wi-Fi, Bluetooth and RFID. But besides these, there are many studies with the technologies like UWB, Zigbee, the sensors like accelerometer, gyroscope, magnetometer or studies in which technologies are used together that is called hybrid technologies [19]. Following Figure 3.1 shows the technologies which are using for indoor positioning.
Figure 3.1: Indoor positioning technologies
In this thesis, we are focused on Bluetooth wireless technology by considering the advantages that will be explained in the following sections.
3.1.1 Wireless Fidelity (Wi-Fi)
Wi-Fi is the common name of the IEEE 802.11 standard. Wireless can be connected to an existing Internet network by means of Wi-Fi technology in the tablet, telephone, computer, smart devices. Communication over the wireless network is done in two directions. The wireless adapter of a device converts radio signals into a transmitter and sends it through an antenna. The wireless router receives the signal and decodes it, then sends the information to the internet using the physical wired Ethernet link. The process works the same in reverse. Each wireless router broadcasts a signal which is received by devices within a specific area. These devices
7
have ability to measure signal strength. Once the devices are connected wirelessly to the access point that emits this signal, they can communicate with the AP no matter where they are in indoor environment. Figure 3.2 demonstrates the Wi-Fi based mobile system.
Figure 3.2: Wi-Fi based indoor positioning
Wi-Fi is available in many places like houses, airports, office buildings etc. Also, it has a low cost and high coverage advantages over other technologies. Because of these reasons this technology is commonly used in indoor positioning.
In literature, there are many different studies about Wi-Fi positioning. A master thesis [16] found the position by using Wi-Fi technology with fingerprinting in an airport. Particle and Kalman filter were used for eliminating signal fluctuation. Wi-Fi with fingerprinting is popular and there is a study which gives another solution to increase the accuracy which is called Dynamic Fingerprinting [20]. In this system when a passive user becomes stationary, system creates a fingerprint with this user location information.
The Wi-Fi signals are affected due to the indoor environment conditions [17], so a new algorithm presented which is called FMA-RRSS (Fingerprint Matching Algorithm Based on Relative Received Strength Signal) [21]. This algorithm is a new position-determined model in which the location is found from RSSI values of Wi-Fi signal.
3.1.2 RFID
RFID is a system used to transmit serial recognition information of an object or a person wirelessly with radio waves. The data is carried on the transponder. The system consists of two parts as receiver and transmitter. Data exchange between the
8
two devices is provided by magnetic or electromagnetic fields. The reader loads energy into the antenna to receive the data stored in the memory of the carrier. In this way, the antenna radiates the radio signals and activates the carrier. The active carrier also leaves the data in memory [15].
RFID tags can be programmed to receive, store and send object information. RFID carriers are analyzed in three general categories as active, passive and semi-passive according to the source of electrical power. Active carriers usually have their own power sources, which they obtain from a pulse. Passive and semi-passive carriers take their strength from the reader's signal [22].
For semi-passive labels, a small battery is added for increasing the broadcasting signal strength. These labels with a larger reading area are more reliable and can respond more quickly to the reader. The operational logic of RFID tags is shown in the following schematic Figure 3.3.
Figure 3.3: Schematic of RFID
RFID is a widely used technology in indoor positioning systems. There are many existing studies on the subject. RFID technology has some advantages to indoor positioning. They work in all kinds of environments, the presence of inexpensive small and cheaper passive carriers, the receiver and transmitter need not have to see each other directly. The disadvantages of using RFID are as follows; Passive carriers are less sensitive than activators, RFID readers are expensive.
The use of RFID in locating is applied in two different ways. Carrier is stationary, reader is mobile systems. The designated point carriers are placed in the building. Readers are located on the moving person or objects. In these systems, the location of the person or object can be found by making use of the known positions of the carriers which are in the reading fields of the reader [15].
9
The sensitivity of this system depends on the carrier frequency used. Considering the large constructions, the number of the carriers that are received is increasing too much. It is increasing in terms of workload and cost. In the other system, readers are fixed, and carrier is mobile. In these systems, the carriers are on the object or persons that are being followed. The readers are placed in predetermined locations. The RSSI values from the RFID carrier are used to estimate the location. The distance between the carriage and the reader is important and distance is inversely proportional to signal strength communication breaks at a certain level. In these systems, prediction is made by triangulation and trilateration methods which will be explained in the future.
3.1.3 UWB
UWB is a short-range RF based localization technology which has a high bandwidth and has more sensitivity that other RF-based technologies like Wi-Fi and RFID can not reach. It is one of the fixed indoor positioning system which is based on sensing short pulses. UWB signals are suitable for indoor positioning applications because they can pass through walls, windows and other obstructions but due to expensive installation, UWB is not suitable for large scale implementations [23].
There are many studies using UWB. In these studies, accuracy of 4-20 cm is reached using TOA, TDOA, AOA and fingerprinting techniques to calculate the distance between the reference points and the target. RSS is generally better suited for systems that use narrowband. UBISENSE 2011 is an UWB based automation solution for indoor localization which uses tags, fixed infrastructure and location management platform. There is an array of antenna and system uses AOA to determine the position [24].
UWB systems simultaneously use multiple bands of frequencies for signal transmitting. In contrast to narrowband, UWB waves cover large frequency band. Federal Communication Commission (FCC) in USA limited the unlicensed UWB communications to avoid interference with the existing radio services. FCC limited bandwidth frequency to 3.16 GHz to 10.6 GHz and allows maximum -41 dBm power spectral density for commercial UWB devices [25].
10 3.1.4 Bluetooth
Bluetooth is the name of short-range radio frequency (RF) technology that eliminates the cable connection. Bluetooth was developed by Ericsson in 1994 to establish wireless connection and communication among mobile phones and other mobile devices even if out of LOS. The distance, that Bluetooth-enabled devices capable of transmitting data up to 24 MBPS is effective about 10 to 100 meters. It provides users with full control over their smart home products, right from light bulbs to smart locks, from anywhere in their home and daily life.
Over the years, different versions of Bluetooth technology have been developed. It started with the version 1.0 which had several problems. Later in 2002 v1.1 published and Signal Strength Indicator and non-encrypted channels were added to this version. V1.2 increased the speed. In 2004 Bluetooth v2.0 released and used Enhanced Data Rate (EDR) to improve data transfer rate. In 2007 v2.1 released, with this version brought secure simple pairing (SSP) which is more efficient and secure for data transmitting. In 2009 Bluetooth v3.0 released with improved transfer speeds of up to 24 Mbit/s. In 2010, new version Bluetooth 4.0 was released which is called Bluetooth Low Energy or Bluetooth Smart. This system has ultra-low power consumption, new software stacks and changed radio frequency properties [8]. One year after, v4.1 was released. It had an update for software. In 2014, v4.2 came out and this version is more useful for IoT. Also, a new version released which is called Bluetooth 5.0 with up to 4x the range, 2x the speed and 8x the broadcasting message capacity in 2016. The enhancements of Bluetooth 5.0 focus on increasing functionality for the Internet of Things (IoT). Bluetooth Low Energy technology will be explained in more detail than other technologies, since the system will be developed by using Bluetooth Smart technology in this master thesis.
Bluetooth Low Energy uses the same antenna and frequency as classic Bluetooth. This system is also called Bluetooth Smart. This technology is being used in smart homes, health and medical devices, PC and consumer electronics, automotive, retail and location-based services. Estimates show that the size of the Bluetooth chipset market will grow more than 19 billion in 2019 [26]. Bluetooth Smart device is shown in Figure 3.4.
11
The most important feature of Bluetooth Smart device is that it can operate for very long time with a simple coin battery, so power consumption is reduced to between 50-99% of the classic Bluetooth power consumption [27].
There have to be two device nodes, slave and master, acting as receiver and transmitter. BLE 4.0 technology is not compatible with classic Bluetooth stack, that’s why the new devices support both of them. The new standard was introduced to send low amount of data like sensor values or control commands [12].
Figure 3.4: Bluetooth Smart device
In Bluetooth Smart, there is no need to do pairing to exchange the data. Advertisement channels send data in broadcasting mode without pairing. This new type of device also called Beacon. In the signal, there exist Received Signal Strength Indicator, link quality parameter, transmitted power level parameter and inquiry response rate information. Shortly received signal strength indicator is RSSI and varies between -127 dBm and 20 dBm. If the value increases, that means the signal strength increases, and become nearer [8]. If the device is in 2 meters away this means it is very close. If the device is 2-5 meters away from the AP, it means it is near and if 5-10 meters away from AP, it means it is far.
Although Bluetooth Smart is not an active connection, an established connection can take RSSI value from passively receiving advertisements. The most important advantage of Bluetooth Smart is its availability in all digital devices.
These features make Bluetooth technology advantageous for locating position indoors. Algorithms and the techniques for obtaining distance from beacon signals will be handled in the following sections.
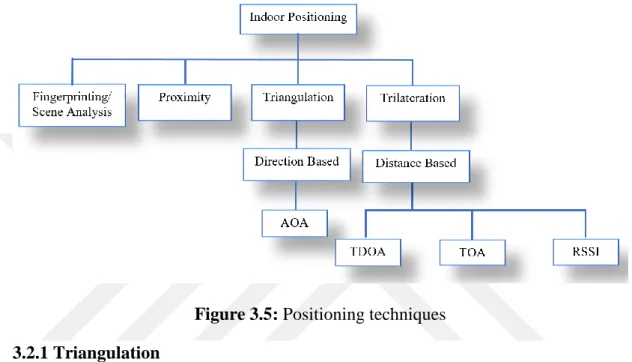
12 3.2 Position Estimation Methods
There are some challenges due to indoor environment like accuracy, responsiveness, calibration effort, adaptive and operational constraints [15]. Special algorithms and methods have been developed for these reasons. Figure 3.5 shows the methods which are used for indoor positioning. Some of these methods are described in the sub sections of this part.
Figure 3.5: Positioning techniques 3.2.1 Triangulation
Triangulation method makes positioning by measuring the angles of the arrived signals and uses geometric properties of triangles to compute object locations. The distance is determined by the angles of the signals that are emitted from each device [28]. This technique is based on Angle of Arrivals (AOA) of wireless signals and at least two reference points required. The device can calculate its own position with the angle of the obtained signals which are emitted from transmitters. Schema of the triangulation formula can be seen in Figure 3.6.
13
For two reference points, there will be two angles which can be called α and β. The distance is determined with the following formulation;
𝐷 = 𝐿𝑠𝑖𝑛( 𝛼). 𝑠𝑖𝑛( 𝛽)
𝑠𝑖𝑛( 𝛼 + 𝛽) (3.1)
where L is the distance between both receivers.
A person or an object carries the device and reference points A and B can be seen from the position of the device. If the positions of A and B are known, the position of the device can also be found by constructing a triangle. Triangulation technique can be used with Wi-Fi, BLE, UWB and LTE signals for indoor position estimation [29]. Another triangle method involves three reference points which have specific positions. By the help of the angles of arriving signals, the mobile node can determine its own position. A schema for triangulation with three access points is shown in Figure 3.7.
Figure 3.7: Triangulation with three reference points 3.2.2 Trilateration
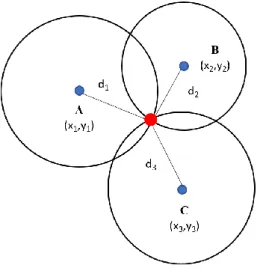
Trilateration is used to determine the position by using distances to known reference points in surveying, navigation and GPS. Trilateration requires the distance between the receiver and the transmitter for measuring and uses three reference points which are known positions. If we compare trilateration and triangulation, triangulation measures the angle of the received wireless signals, trilateration measures the distances to the reference points. Provided that the receiver and transmitter are synchronized, received signal strength indicator (RSSI), the time of arrival (ToA), or the time of flight (ToF) of the signal, are calculated for each reference point in order to determine the radius. For three reference points, there will be three spheres and
14
the device’s position is then determined by observing the intersection of the three radii [29]. The Figure 3.8 illustrates the Trilateration Technique.
Figure 3.8: Position estimation with trilateration
The intersection of the surfaces of three spheres is found by formulating the equations for the three sphere surfaces and then solving the three equations for the three reference points. This intersection point is the possible location of the transmitter. For trilateration calculations, exact location of the reference points and estimated distances from each reference points to the device should be known.
Lets say xb, yb, zb are the beacon coordinates. The distances can be calculated as
follows; 𝑟𝑖2 = (𝑥 𝑖 − 𝑥𝑏)2+ (𝑦𝑖− 𝑦𝑏)2+ (𝑧𝑖− 𝑧𝑏)2 (3.2) 𝑟12 = (𝑥 1− 𝑥𝑏)2+ (𝑦1− 𝑦𝑏)2+ (𝑧1− 𝑧𝑏)2 𝑟22 = (𝑥2− 𝑥𝑏)2+ (𝑦2− 𝑦𝑏)2+ (𝑧2− 𝑧𝑏)2 𝑟32 = (𝑥3− 𝑥𝑏)2+ (𝑦3− 𝑦𝑏)2+ (𝑧3− 𝑧𝑏)2 (3.3)
If all spheres are on one plane, these equations will be simplified as follows for three circles; 𝑟12 = (𝑥 1− 𝑥𝑏)2+ (𝑦1− 𝑦𝑏)2 𝑟22 = (𝑥 2 − 𝑥𝑏)2+ (𝑦2− 𝑦𝑏)2 𝑟32 = (𝑥3 − 𝑥𝑏)2+ (𝑦3− 𝑦𝑏)2 (3.4)
15
These equations reduce to linear set of simultaneous equations which can be solved by using the following matrices.
(𝑥1− 𝑥𝑏)2− (𝑥 3− 𝑥𝑏)2+ (𝑦1− 𝑦𝑏)2− (𝑦3− 𝑦𝑏)2 = 𝑟12− 𝑟32 (𝑥2− 𝑥𝑏)2− (𝑥 3− 𝑥𝑏)2+ (𝑦2− 𝑦𝑏)2− (𝑦3− 𝑦𝑏)2 = 𝑟22− 𝑟32 (3.5) 2(𝑥3− 𝑥1)𝑥𝑏+ 2(𝑦3− 𝑦1)𝑦𝑏 = (𝑟12− 𝑟32) − (𝑥12− 𝑥32) − (𝑦12− 𝑦32) 2(𝑥3− 𝑥2)𝑥𝑏+ 2(𝑦3− 𝑦2)𝑦𝑏 = (𝑟22− 𝑟32) − (𝑥22− 𝑥32) − (𝑦22− 𝑦32) (3.6) 2 [𝑥𝑥3 − 𝑥1 𝑦3− 𝑦1 3− 𝑥2 𝑦3− 𝑦2] [ 𝑥𝑏 𝑦𝑏] = [ (𝑟12-r 32) − (𝑥12-x32) − (𝑦12-y32) (𝑟22-r 32) − (𝑥22-x32) − (𝑦22-y32) ] (3.7)
Multilateration is a position estimation technique similar to trilateration with more than three reference points [28]. If there are more than three reference points, some other methods like least squares can be applied to find a more accurate intersection point.
3.2.3 Proximity
The proximity is a method for indoor location finding which is easy to implement, the location of the device can be found by its existence in a defined area. Proximity based algorithms provide approximate location information of the mobile device [29]. This method uses the strongest received signal strength and finds the location according to this information. The scenerio of the method is; a mobile node exists in the range of a known station then system can estimate the location from the strongest signal to the known station. When more than one antenna detects the mobile node, the mobile node is assumed to be located close to a known station with the one that receives the strongest signal. The accuracy of the technique is based on the number of anchor (base or reference) points and the signal range. Generally, the proximity systems are based on IR, Bluetooth and RFID Technologies [18]. According to the research results, this method uses RSSI and has accuracy changing from low to high. It has good coverage and can be used in LOS or NLOS environments. There is no multipath affect and this technique has low cost [16].
16 3.2.4 Fingerprinting
Radio waves can pass through all kinds of obstacles and objects, so the signal strength weakens, reflects, and loses. Therefore, it is necessary to minimize such problems in order to be reliable and consistent while positioning via RSSI. Fingerprinting or scene analysis technique uses received signals for indoor localization by comparing the RSSI measurements to overcome these problems. There are three different approaches for fingerprinting [30];
1- Deterministic approach which represents the signal strength of the AP by a scalar value. RADAR is an example for this approach with using k-nearest neighborhood. 2-Probabilistic approach which focuses on the stored information about the signal strength distributions from APs in the radio map. Horus is an example with Bayesian network [31].
3-Machine learning approach which uses SVM, fuzzy logic and artificial neural networks for determining the user location.
Fingerprinting technique consists of two stages which are offline and online [23]. Before the offline stage, the locations of the reference points were determined on the map of the environment and the precise coordinates were recorded into a database. These recorded coordinates are used in the online stage. We can call offline stage as data acquisition phase, whereas the online stage as positioning. Offline stage is the training phase for localization. For training purposes, the area of interest is divided into grids which are generally 1mx1m, and each grid corresponds to a reference point. At this stage, for each predetermined reference point, certain numbers of RSSI samples are taken. The average of these measurements are calculated and the expected RSSI values of each reference point are determined. The signal strength of the reference points are recorded into a database. This is radio map of the targeted area. Online stage is determining the location of the mobile device with the observed signal strength and the radio map of the targeted area. At this stage, the instantaneous position of the device is calculated. During each location query, the signals from all APs that the mobile device can capture at that moment are compared with the average AP signals in the signal map. Thus, a list of reference points closest to the device is determined. The number of reference points and measurements are also important for a quality radio map. After this step the position of the device can be
17
calculated by using the obtained nearest reference points with different methods like k-Nearest Neighbor algorithm or Markov Localization [32].
Another application was made in a school. The environment was equipped with beacons and portable devices. Fingerprinting is used with RSSI of BLE technology. The template matching is performed with Sum of Squared Difference algorithm for estimation [23].
Estimation of distance over the signal strength with RSSI is relied on ideal indoor environments. Fingerprinting has a high performance with medium accuracy. This technique is complex and expensive. Offline stage is time consuming and constructing the location map requires significant effort [28].
The most popular algorithms are shown below in Table 3.1. Table 3.1: Fingerprinting algorithms.
Algorithm Information Reference
K-Nearest Neighbor
(k-NN)
Classification algorithm used for pattern recognition with storing all existing cases and classifies new cases according to a similarity measure. Euclidean distance is used for calculating the distance between neighbors.
[33]
Artificial Neural Networks
(ANN)
It is an information processing paradigm inspired by the structure of the biological nervous system. This model has learning capability and is able to achieve high accuracy for indoor positioning with less computation time.
[34]
Support Vector Machine
(SVM)
It is an algorithm used for classification. Inputs are classified according to their properties. These two groups are shown on a plane. Two boundary lines are drawn parallel to each other and these lines are drawn close to each other. A common boundary line is determined.
[35]
K-Means Algorithm
K-means is the algorithm which is developed to group a certain number of clusters over a given set of data. A set of n data objects is divided into k sets of data given as input parameters. The algorithm aims to find the center by reducing the distance between the clustering center and the members of the same cluster.
18 3.3 Signal Measurement Methods
In the literature, there are various signal measurement methods. In this thesis we focus on four most popular methods. These are time-of-arrival (TOA), received signal strength (RSS), time-difference-of-arrival (TDOA) and angle-of-arrival (AOA). All methods have some advantages and disadvantages over others. From the point of accuracy, TOA and TDOA methods are the best but they require precise synchronization of measurement units. AOA method is complex, and cost of transceivers and antenna modules are higher than other methods. So, this method is not widely used. Among others, RSSI is the most common ranging method. The advantage of this method is the mobile devices can receive signal strength measurements during standard operation of the existing Wi-Fi networks. This method is low cost and there is no need for special hardware. [37].
3.3.1 Received signal strength indicator (RSSI)
The RSSI is defined in IEEE802.11 standard, which is the power level measurement between the transmitter and the receiver presented by dBm unit. The RSSI can be decreased exponentially according to the increase of distance [38]. For example, a RSSI value of - 40 dBm is more valuable than a value of – 60 dBm. It means that there is a good connection with the device which has – 40 dBm RSSI value. That means this device is close to us. If the receiving node knows the output power of the incoming signal, the taken way can be estimated by looking at the power of the receiving signal [39].
Radio propagation model is divided into three categories;
First one is free space propagation model which describes loss of signal strength over distance and requires open environment. Formula is;
𝑃𝑟(𝑑) =
𝑃𝑡. 𝐺𝑡. 𝐺𝑟. 𝜆2
(4𝜋𝑑)2𝐿 (3.8)
Where Pr (d) is the received power, Pt is the transmitter power, Gr is the receiver
antenna gain and Gt is the transmitter antenna gain. Second model is two-ray ground
reflection model which is used in the case where the transmitter and receiver at the known distances from the ground. This model accounts for multipath fading over long distances. Formula is;
19 𝑃𝑟(𝑑) = 𝑃𝑡. 𝐺𝑡. 𝐺𝑟.ℎ𝑡
2
. ℎ𝑟2
𝑑2 (3.9)
Where ℎ𝑡 is the transmitter antenna height and ℎ𝑟 is the receiver antenna height. Third model is log-distance model which is the general propagation model. This method can be used both indoor and outdoor environments. RSSI calculation formula is as follows:
𝑅𝑆𝑆𝐼𝑑𝐵𝑚 = −10. 𝑛. 𝑙𝑜𝑔10( 𝑑) + 𝐴 (3.10)
Where n is the path loss exponent or signal propagation constant, d is distance from sender or transmitter and Ais received signal strength in dBm at a distance of one meter. Solving Equation 3.10 for 𝑑 leads to the Formula in 3.11;
𝑑 = 10𝐴−𝑅𝑆𝑆𝐼10.𝑛 The relation between d and RSSI (3.11)
Received signal strength indicator (RSSI) is presented as a standard feature in many hardware today and is preferred because of the reasons such as energy saving, small knot size and low cost. The RSSI method has been included in the literature as the most widely used positioning method that estimates the distance between two nodes [26].
3.3.2 Angle of arrival (AOA)
This method calculates the angles of the signals that reach one or more receivers from a given point with the receiver antennas. Two receivers are sufficient to obtain position information in a two-dimensional plane. 3 or more receivers are used at the point scale to increase the accuracy. Directional antenna or antennas are required to determine direction. Then, by taking advantage of the geometric properties, the position of the nodal point of the intersecting two lines can be estimated. AOA methods also have their own disadvantages. The AOA technique requires special antennas to measure angles, which increases the cost of AOA technology.
It is affected by multipath in enclosed areas. These effects can greatly change the angle of arrival of the signal, which significantly reduces positional accuracy [27].
20 3.3.3 Time of arrival (TOA)
Time of Arrival is the travel time of a radio signal from a transmitter to a receiver. Arrival time methods are based on high accuracy synchronization of the arrival time of the signal transmitted from a mobile device to several reference points. In the TOA method, it sends the time processed signal to the handset to several receivers. The distance between the mobile point and the receiver points is calculated with the aid of the signal transfer delay and the speed of the corresponding signal. At least three sensor nodes are required for positioning. The 4th node will be required for time correction [40].
UWB has a good accuracy due to the high time resolution (large bandwidth). So, synchronization requirement of TOA method can be compansated by a system with UWB signaling [41].
The basic equation for TOA can be seen in Equation 3.12;
𝑟 = 𝑡𝑥𝑐 (3.12)
Where c is the traveling speed of the signal, t is the time of spent in the signal travelling from transmitter to receiver and r is the distance between transmitting node to receiving node.
3.3.4 Time difference of arrival (TDOA)
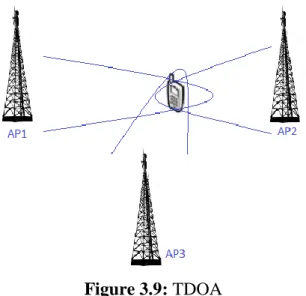
The relative position of the transmitter can be determined by the differences in the TOA of the signal from mobile unit to multiple measurement units. TDOA is a mathematical positioning method based on passive radar methods which is used by GSM operators. It based on low energy consumption and hyperbolic equations. The distance is calculated based on the propagation time and the speed of the signal in this method. It finds out the relative location of the transmitter by the difference in time at which the signal arrives from multiple measuring units. Representative picture for TDOA can be seen below Figure 3.9.
21
Figure 3.9: TDOA
Time difference of arrival uses multilateration or hyperbolic positioning to locate the transmitter. Since the synchronous receiving antennas are located in different places, the transmitter signal is reached at different times to the receiver. The first receiving antenna is regarded as the reference point. Now, the time of arrival of the same signal to other receivers is monitored synchronously by the host. The time of arrival to the other two receiving antennas and the time difference between the receivers are measured. Hyperbolic equations can be formed by using these time differences. The solution of the generated hyperbola equations is to find the position of the target point relative to the first reference point and corresponding software transforms this information to the position information [40]. This method is like TOA, but it finds the relative location of the mobile transmitter instead of absolute arrival time as in TOA. Synchronization is required as any other time-based methods for accuracy. This method is expensive, more accurate, has less calibration requirements but needs complex infrastructure to get high performance [23].
3.4 Implementation Strategies
Indoor positioning systems can be implemented in two different ways. These are network-based approach in which the location calculation is made by the server and other one is the device-based approach in which the location calculation is made by mobile device [29].
22 3.4.1 Device-based positioning
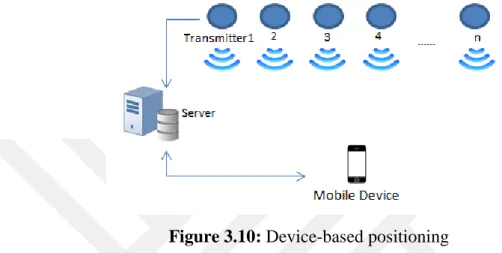
The signals from transmitters are gathered from mobile device. The position calculated by a software with estimation algorithm on the mobile device or on remote server. The person or object to be tracked have to carry a smart device which can be a mobile phone or smart wearable. The environment is equipped with transmitters. Device-based positioning diagram can be seen in Figure 3.10.
Figure 3.10: Device-based positioning
More precise location estimates can be done with the sensors on mobile devices together with RSSI. This method can lead to battery run-down because a continuous application runs on the device. This is a disadvantage in terms of use.
Mobile-based wireless positioning system CAPTURE which uses fingerprinting and KNN method is an example for devised-based implementation [42]. Mobile device scans the environment and determines the best three transmitters by the help of the received signal strengths. The device sends the information to the server and system calculates and compares the position with the trained data in the database.
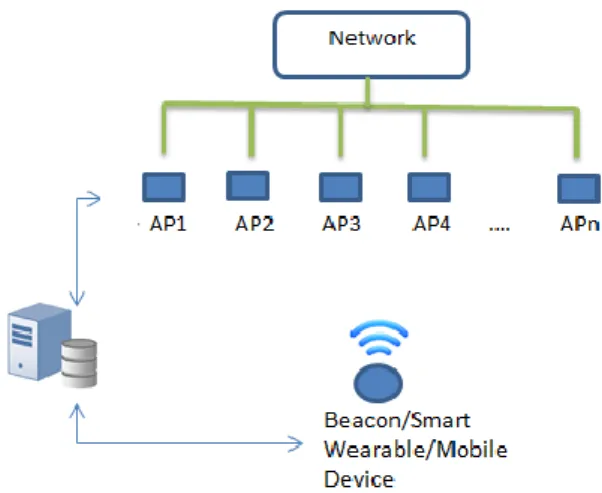
3.4.2 Network-based positioning
In the network-based positioning, transmitter device is located on a person or object. The environment is equipped with access points connected to the network. The transmitter signal is received by the APs and the location is estimated by software on a server for positioning purposes. This method of application is more advantageous in terms of battery usage. However, the characteristic of the device is important. System can be seen in Figure 3.11.
23
Figure 3.11: Network-based positioning
A system, which finds the locations of the students in campus buildings through Wi-Fi enabled devices, has been developed [43]. System collects a set of data which includes RSSI of the Wi-Fi devices and uses the multilateration algorithms with various filtering algorithms. This study is a good example for network-based implementations.
3.5 Commercial and Academic Applications
Various commercial and academic applications were observed in the literature survey. New solutions are being introduced continuously by adding new technologies and improving existing ones.
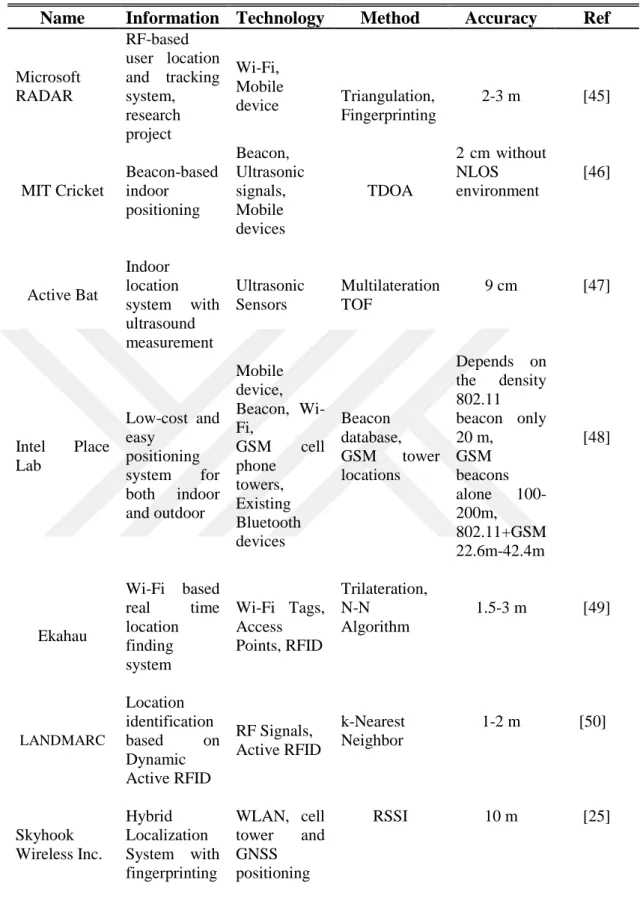
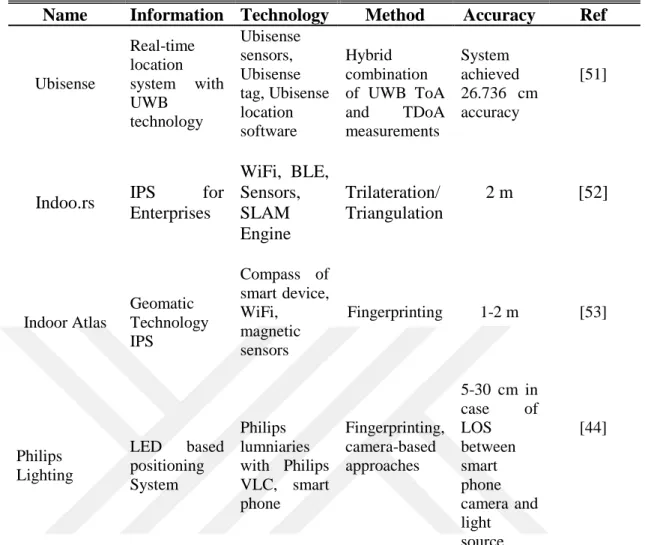
Some of the academic research projects and commercial products are listed in the below Table 3.2. There are also many other solutions in the market and different studies which explains them in detail [25, 28, 44].
3.6 Related Works
In the thesis study, position estimation is performed by trilateration and linear least squares with signals from Beacons.
24
Table 3.2: Academic and commercial localization systems.
Name Information Technology Method Accuracy Ref
Microsoft RADAR RF-based user location and tracking system, research project Wi-Fi, Mobile device Triangulation, Fingerprinting 2-3 m [45] MIT Cricket Beacon-based indoor positioning Beacon, Ultrasonic signals, Mobile devices TDOA 2 cm without NLOS environment [46] Active Bat Indoor location system with ultrasound measurement Ultrasonic Sensors Multilateration TOF 9 cm [47] Intel Place Lab Low-cost and easy positioning system for both indoor and outdoor Mobile device, Beacon, Wi-Fi, GSM cell phone towers, Existing Bluetooth devices Beacon database, GSM tower locations Depends on the density 802.11 beacon only 20 m, GSM beacons alone 100-200m, 802.11+GSM 22.6m-42.4m [48] Ekahau Wi-Fi based real time location finding system Wi-Fi Tags, Access Points, RFID Trilateration, N-N Algorithm 1.5-3 m [49] LANDMARC Location identification based on Dynamic Active RFID RF Signals, Active RFID k-Nearest Neighbor 1-2 m [50] Skyhook Wireless Inc. Hybrid Localization System with fingerprinting WLAN, cell tower and GNSS positioning RSSI 10 m [25]
25
Table 3.2 (continue): Academic and commercial localization systems.
Name Information Technology Method Accuracy Ref
Ubisense Real-time location system with UWB technology Ubisense sensors, Ubisense tag, Ubisense location software Hybrid combination of UWB ToA and TDoA measurements System achieved 26.736 cm accuracy [51]
Indoo.rs IPS for Enterprises WiFi, BLE, Sensors, SLAM Engine Trilateration/ Triangulation 2 m [52] Indoor Atlas Geomatic Technology IPS Compass of smart device, WiFi, magnetic sensors Fingerprinting 1-2 m [53] Philips Lighting LED based positioning System Philips lumniaries with Philips VLC, smart phone Fingerprinting, camera-based approaches 5-30 cm in case of LOS between smart phone camera and light source [44]
Using Bluetooth for positioning is popular because of the availability in mobile devices and the easy installation of the system. Recently there are Wi-Fi access points ready on the premises and BLE beacons are placed on the floors of the buildings. Both technologies are being used together to increase accuracy [10]. The RF Based indoor positioning technique with BLE is described in an academic study. Two-dimensional x and y coordinates are used and third coordinate is neglected. Four different positioning methods, which are trilateration, iterative trilateration, a particle filter and a fingerprinting, have been tested using Bluetooth Smart technology [8].
In another thesis, trilateration is used with Bluetooth RSSI values without connection establishment. Four mobile phones which have Android operating systems are positioned as a transmitter to the corners in the rectangular test area. The target is also a mobile device with the Android operating system. Three different methods,
26
which are least squares estimation, trilateration and centroid positioning, were used to estimate position. As a result, 0.6 meter accuracy has been achieved [54].
There is an other study which finds mobile robot location with Bluetooth in indoor environment [55]. Three beacons were located at fix coordinates in a 6m x 8m floor with furniture. Iterative trilateration and pseudo-inverse trilateration were compared to calculate autonomous robot position in the interior. According to this study iterative trilateration method is more accurate than pseudo-inverse trilateration method. It was observed that the error rate was lowered by using particle filter. Another study in the literature used a model similar to our solution [56]. BLE devices were being used as transmitters. Channel diversity, Kalman filtering and a weighted trilateration technique were used for improving the sensitivity of the IPS System.
27 4. BLE BASED INDOOR POSITIONING
In this part of the study, our own system will be described in detail. System architecture, test bed setup, data acquisition, algorithm implementations and graphical layout will be provided.
There are some parameters that must be considered when installing the system. These are accuracy, coverage area, and number of users, scalability, cost and robustness. In the study, a scenario that is not dependent on smart devices is considered. The study includes an object or person tracking who or which does not have an ongoing smart device.
Our system architecture can be divided into three parts: APs setup, data acquisition and data analysis. The general structure of our system is illustrated in Figure 4.1.
Figure 4.1: System structure
In the first phase; APs were placed in predetermined locations and they were prepared for data acqusition. In the second phase, APs collected the beacon data and send to the server. In the third phase, the software on the server utilized the signal data in a series of calculations to find the position based on the beacon RSSI.
28 4.1 Test Environment and Setup
The evaluation is performed in a PLC Lab in the university. A 13.1 x 6.5 m rectangular area was with six APs which are located 2 meter above from the floor, on the building carrier walls. The environment was furnished and two pictures of the test area is presented in Figure 4.2(a) and 4.2(b).
(a) Right Side
(b) Left Side Figure 4.2: Test area
29
The overview of the test area plan is illustrated in Figure 4.3.
Figure 4.3: Plan of the test area
The Wi-Fi network were active and there were many other Bluetooth signals in the environment. It was a real life scenario with noise and obstacles. Test environment consists of two different components; software and hardware.
4.1.1 Hardware
Beacons are basically allow mobile devices to discover where they are located in a very small area. They can operate continuously up to 3 years with a normal coin battery. Due to the fact that, this is the biggest difference with traditional Bluetooth. Figure 4.4 presents the picture of the EMBC01 beacon device. BLE technology is
30
designed for small data transfers in short periods. Since they have one-way data transmission, they are highly secure.
There are different types of beacons like iBeacon, AltBeacon and URIBeacon in the market. They all have their own standards and advantages. iBeacon is the first BLE Smart Beacon technology product developed by Apple. It has a closed standard. AltBeacon is an open, cost free beacon specification which is the format of the broadcasting message.
Within the scope of the project, transmitters are BLE beacons, which are constantly broadcasting. EMBC01 BLE Proximity Beacon product of EM Microelectronics was preferred. Each beacon has a globally unique code that is periodically broadcast through Bluetooth signals. Beacon ID packet of EMBC01 advertisement includes UUID, Major ID, Minor ID and Tx power data which are common Beacon standards.
Figure 4.4: EMBC01 proximity beacon EMBC01 has three power modes;
Short Range: 15m LOS, 100ms beacon interval and 1.5 months of battery life Medium Range: 30m LOS, 500ms beacon interval and 7.5 months of battery life Long Range: 75m LOS, 1 second beacon interval and 12.5 months of battery life
In our system we used medium range power mode which transmits 2 beacon signals at each second. It is easy to change the mode with a button on the Beacon. In the system, Beacons were used as transmitter.
Raspberry Pi is a small single board computer with Raspbian operating system installed. To receive the BLE signals AP’s must have Bluetooth interface. Raspberry Pi3 in Figure 4.5 has built-in Bluetooth 4.1 and Wi-Fi, so extra equipment like dongle was not needed. HCI is host controller interface comes ready with Raspberry Pi3.
31
Figure 4.5: Picture of Raspberry Pi3
Bluez library was installed for listening Bluetooth from code block. Suds library was installed for web service operations. 6 Raspberry Pi3 were used as access points in the test environment.
4.1.2 Software
In the system we have three different softwares. The first one is open source Domoticz home automation code installed from GitHub and was used with some modifications for our system. The software receives Bluetooth signals in the background and communicates with server via web service over the internet. The AP code, Beacon Id, RSSI value and date/time information are serialized in JSON format. Codes added for serializing the data and calling web service in Python software language. The flow chart of this part of software phase can be seen in Figure 4.6.
The second sofware is a web service which takes the necessary information from access points, filters and sends to the server. Service takes the AP code, Beacon Id, RSSI value and date/time information as a parameter and deserialize the JSON and records the data. Web service flowchart is shown in Figure 4.7.
RSSI Analyser sofware consists of three stages. The first stage is to calculate the calibration values of the APs. Calibration phase will be explained in detail in Section 4.2.1 . A screenshot of the software can be seen in Figure 4.8.
32
Figure 4.6: Receiver software flowchart
33
Figure 4.8: Calibration interface
The second stage is estimating the distances between the target and APs. In this stage, the software finds the distance value by the Formula given in 3.11 with the calculated calibration value A and path loss for each access point.
The estimated distances from RSSI values are represented as circles around the access points which are used by positioning algorithms. The calculation is presented in Table 4.1.
Table 4.1: Algorithm of distance calculation from RSSI. Algorithm: Distance Calculation from RSSI
CALIBRATION
Input: n1, n2, n3, n4, n5, n6 ← path loss exponents
A1, A2, A3, A4, A5, A6 ←one-meter calibration values
Output: r1, r2, r3, r4, r5, r6 ←radius values of APs
begin
for i←1 to 6 do
RSSIList ←read values of APi Data FilteredList ← filter RSSIList
RSSIi ← average of FilteredList
Using Formula: 𝑟𝑖 = 10
𝐴𝑖−𝑅𝑆𝑆𝐼𝑖
10∗𝑛𝑖 Calculate radius
end for end
34
The third is calculating the positions of the target. In this stage, the estimated distance of all AP’s from the previous stage and the exact coordinates of AP’s are being used in trilateration, linear least squares and Newton Raphson algorithms. For evaluation of the results, the exact location of the beacon and the calculated position were compared with distance formula. Figure 4.10 shows the analyser flowchart.
Figure 4.9: Analyser software flowchart
C # programming language in Visual Studio IDE was used for RSSI Analyser software. Analyser interface is shown in Figure 4.11.
35
Figure 4.10: Analyser interface 4.2 Data Acquisition and Analysis
The data collection and analysis phase of the system started with a calibration process. After the calibration, tests were carried out and location estimation studies with the algorithms were conducted.
4.2.1 Calibration effort
Calibration is the most important phase in indoor positioning studies. Indoor environment is complex due to the obstacles like windows, walls, furnitures, metal objects and moving objects. The system needs to be calibrated according to the method. In our system, we used 2 dimensional trilateration method. The test conditions must be equal for all access points. All APs are fixed to the building carrier walls at a height of 2 meters from the ground. All access points have the same operating system, are the same brand and have the same software installed. The same beacon with 2 signals transmission period at each second was used.
36
Figure 4.11: Flowchart of calibration phase
During the calibration process, the transmitter is positioned directly in the line of sight. To investigate the angle effect on RSSI, the data was collected from the side facing to the test area at each 45 degrees for 3 minutes. The change is seen in Figure 4.13.
Figure 4.12: Average RSSI vs angle chart -70 -60 -50 -40 -30 -20 -10 0 0° 45° 90° 135° 180° Av erage RS SI (dBm ) Degrees o
37
The minimum value of the measurements per AP was chosen as 1meter calibration value, which is indicated by A in the formula. The collected RSSI values were filtered by the low pass filter and averaged with the Formula 4.1. A visual representation of the data can be seen in Figure 4.14.
Figure 4.13: Low pass filter
𝑥̅ =∑ 𝑥𝑖
𝑛 𝑖=1
𝑛 (4.1)
In the formula, 𝑥̅ denotes the mean value, 𝑥𝑖 is the ith value of the data set and 𝑛 indicates the number of values in the data set.
The other measurement was performed on a meter basis to find the n value. The measurements of up to 4 meters per access point and the values obtained in these measurements are shown in the Table 4.2. These values are used in the path loss calculation.
Table 4.2: RSSI (dBm) measurements versus distance.
Distance(m) AP1 AP2 AP3 AP4 AP5 AP6
1 -51 -50 -53 -54 -51 -55
2 -59 -56 -60 -60 -59 -59
3 -60 -61 -63 -60 -62 -63
4 -61 -64 -67 -63 -64 -66
The standard deviation was calculated with the Equation 4.2 below: -80 -70 -60 -50 -40 -30 -20 -10 0 1 11 21 31 41 51 61 71 81 91 101 111 121 131 141 151 161 171 181 191 201 211 221 231 241 251 261 271 RSS I (d Bm ) Samples RSSI Filtered RSSI