ESSAYS IN EMPIRICAL FINANCE
A Ph.D. Dissertation
by
S ¨ULEYMAN SERDENGEC¸ T˙I
The Department of Management ˙Ihsan Do˘gramacı Bilkent University
Ankara
ESSAYS IN EMPIRICAL FINANCE
The Graduate School of Economics and Social Sciences of
˙Ihsan Do˘gramacı Bilkent University
by
S ¨ULEYMAN SERDENGEC¸ T˙I
In Partial Fulfillment of the Requirements for the Degree of DOCTOR OF PHILOSOPHY IN MANAGEMENT
THE DEPARTMENT OF MANAGEMENT ˙IHSAN DO ˘GRAMACI B˙ILKENT UNIVERSITY
ANKARA
ABSTRACT
ESSAYS IN EMPIRICAL FINANCE
Serdenge¸cti, S¨uleyman
Ph.D. in Department of Management Supervisor: Prof. Dr. K¨ur¸sat Aydo˘gan
December 2019
This thesis comprise three essays that investigate foreign exchange market volatility and its dynamics using high frequency exchange rate data. In the first essay, we decompose the jump component of USDTRY exchange rate volatility and investigate association of jump frequencies and sizes with portfolio flows, carry trade activity and proxies for heterogeneous expectations derived from foreign exchange rate forecasts, currency options and forecasts for key macro-economic variables. The findings of the essay show that portfolio flows, particularly bond flows significantly reduce size and frequency of jumps. Moreover, we observe significant increases in jump size and frequencies with increasing dispersion in beliefs in future exchange rate level and CPI. In the second essay, we study the dynamics of return and liquidity jumps for USDMXN, USDTRY and USDZAR exchange rates. The findings of the essay show that the duration between consecutive return jump arrivals are significantly reduced by average liquidity level in the same period. Furthermore, arrival rates of both liquidity and return jumps are significantly affected by market-wide risk and liquidity factors and key macroeconomic news releases. In the third essay, we investigate the trading volume and volatility nexus for USDTRY exchange rate by using local banks’ foreign exchange transaction volume data. In this context, foreign currency denominated spot, forward and swap transactions in with local and foreign
customers and between each other for intraday realized volatility of different trading sessions. The findings of this study reveal that positive contemporaneous relationship between trading volume and volatility is evident for local customers and in local trading sessions. Moreover, dispersion in expectations for future foreign exchange rate strengthens this relationship.
Keywords: FX Jump Risk, FX Liquidity, Heterogeneous Expectations, High-frequency Analysis, Volume-Volatility Nexus
¨
OZET
AMP˙IR˙IK F˙INANSTA MAKALELER
Serdenge¸cti, S¨uleyman Doktora, ˙I¸sletme
Tez Danı¸smanı: Prof. Dr. K¨ur¸sat Aydo˘gan
Aralık 2019
Bu tez, y¨uksek frekanslı veri kullanarak kur oynaklı˘gı ve dinamiklerini inceleyen ¨u¸c makaleden olu¸smaktadır. ˙Ilk makalede, USDTRY paritesi oynaklı˘gından sı¸crama bile¸seni ayrı¸stırılmı¸s ve kur sı¸cramaları b¨uy¨ukl¨ukleri ve frekansının sermaye akımları ile makroekonomik g¨osterge ve d¨oviz kuru beklenti anketleri ile kur opsiyonlarından elde edilmi¸s heterojen beklenti g¨ostergeleriyle olan ili¸skisi incelenmi¸stir. C¸ alı¸smanın sonu¸cları sermaye akımlarının, ¨ozellikle de tahvil-bono akımlarının kur sı¸cramalarının hem b¨uy¨ukl¨u˘g¨un¨u hem de frekansını anlamlı ¸sekilde d¨u¸s¨urd¨u˘g¨un¨u g¨ostermektedir. Bununla beraber, kur sı¸cramalarındaki b¨uy¨ukl¨uk ve frekansın kur ve enflasyon bek-lentilerindeki farklıla¸smanın artı¸sıyla anlamlı ¸sekilde arttı˘gını g¨ozlemlemekteyiz. ˙Ikinci makalede, USDMXN, USDTRY ve USDZAR pariteleri i¸cin kur ve likidite sı¸cramalarının dinamikleri ve birbirleri ile olan etkile¸simleri incelenmi¸stir. C¸ alı¸smada, kur getiri-lerindeki sı¸cramaların aynı periyottaki ortalama likidite ile anlamlı ¸sekilde arttı˘gı g¨or¨ulmektedir. Bununla birlikte, piyasa risk ve likidite fakt¨orleri ile makroekonomik veri a¸cıklamalarının hem getiri hem de likidite sı¸cramalarını artırdı˘gı g¨ ozlemlenmek-tedir. U¸c¨¨ unc¨u makalede bankaların g¨unl¨uk yabancı para kar¸sılı˘gı i¸slem hacimleri verisi kullanılarak i¸slem hacmi ve oynaklık ili¸skisi incelenmektedir. Bu ba˘glamda, bankaların kendi aralarında veya yerli ve yabancı m¨u¸sterileri ile ger¸cekle¸stirdi˘gi spot,
vadeli ve swap i¸slem hacimlerinin farklı i¸slem saatleri i¸cin ayrı ayrı hesaplanan kur oy-naklıkları ile olan ili¸skisi ele alınmaktadır. C¸ alı¸smanın bulgularına g¨ore i¸slem hacim-leri ve oynaklık arasındaki pozitif e¸sanlı ili¸ski yerli m¨u¸sterilerle olan spot i¸slemlerde ve yerel i¸slem saatleri ile yerel i¸slem saatlerinde g¨ozlemlenmektedir. Ayrıca kur bek-lentilerindeki farklıla¸smanın artmasıyla i¸slem hacmi ve oynaklık ili¸skisinin g¨u¸clendi˘gi g¨ozlemlenmektedir.
Anahtar Kelimeler: D¨oviz Piyasası Likiditesi, Heterojen Beklentiler, ˙I¸slem Hacmi-Oynaklık ˙Ili¸skisi, Kur Sı¸crama Riski, Y¨uksek Frekanslı Analiz
ACKNOWLEDGEMENTS
First of all, I would like to express my gratitude to my advisors, Prof. Dr. K¨ur¸sat Aydo˘gan and Asst. Prof. Dr. Tanseli Sava¸ser for accepting me as a dissertation student and for their valuable guidance during my studies. I would especially like to thank Asst. Prof. Dr. Ahmet S¸ensoy for his guidance and encouragement throughout my PhD thesis work. This work would not have been completed in such a time without his support.
I am very thankful to Asst. Prof. Dr. Bur¸cin Kısacıkolu for serving as a member of my thesis committee and spending his valuable time on my works. I am also very grateful to Asst. Prof. Dr. M¨ur¨uvvet ˙Ilknur B¨uy¨ukboyacı Hanay and Asst. Prof. Dr. Burze Ya¸sar for accepting to serve as members of my dissertation examination committee.
I would also like to express my gratitude to the Faculty of Business Administration at ˙I.D. Bilkent University for giving me the opportunity to pursue my studies. Moreover, I would like to thank the members of our administrative staff and specifically Remin Tanto˘glu for helping me out in administrative issues.
I would like to thank to my dearest friends Utku Bora Geyik¸ci, Sevcan Uzun, Onur Batuhan Kurt and Pelin S¨umer with whom I have had the pleasure to be
colleagues and had wonderful time during my student life in Bilkent.
Finally and foremost, I would like to thank to my wife S¸eyma who has been extremely supportive of me during my studies and also my son Kerem and daughter Zeynep for sustaining my inspiration and motivation. I am also very
grateful to my mom Fatma and dad Davut for raising me and standing by me during my education and my father-in-law M¨ustecep and mother-in-law Ay¸se for their constant support throughout my PhD studies.
TABLE OF CONTENTS
ABSTRACT . . . iii ¨ OZET . . . v ACKNOWLEDGEMENTS . . . vii TABLE OF CONTENTS . . . ixLIST OF TABLES . . . xii
LIST OF FIGURES . . . xv
CHAPTER I: INTRODUCTION 1 1.1 Overview . . . 1
CHAPTER II: IMPACT OF PORTFOLIO FLOWS AND HETEROGENEOUS EXPECTATIONS ON FX JUMPS: EVIDENCE FROM AN EMERGING MARKET 4 2.1 Introduction . . . 4
2.2 Data and Summary Statistics . . . 14
2.3 Jump Detection Methodology . . . 15
2.4 Potential Sources of the Jumps I: Portfolio Flows . . . 24
2.4.1 Equity and Bond Flows . . . 24
2.4.2 Carry Trade Activity . . . 27
2.4.3 Robustness Analysis: Generalized Method of Moments . . . . 32
2.5 Potential Sources of the Jumps II: Heterogeneous Expectations . . . . 35
2.5.1 Heterogeneity in FX Expectations . . . 35 2.5.2 Deviations in Expectations for Key Macroeconomic Variables . 39
2.5.3 Robustness Analysis: Granger Causality . . . 45
2.6 Discussion and Conclusion . . . 48
CHAPTER III: JUMPS AND COJUMPS IN EMERGING MARKET EX-CHANGE RATES AND LIQUIDITY 52 3.1 Introduction . . . 52
3.2 Data and Summary Statistics . . . 58
3.3 Jump Detection Methodology . . . 61
3.4 Jump and Cojump Analysis for the Individual Exchange Rates . . . . 66
3.4.1 Preliminary Analysis . . . 66
3.4.2 Modelling the Duration Between Consecutive Jumps and Co-jumps . . . 73
3.4.3 Impact of Liquidity Jumps on Volatility . . . 77
3.4.4 Impact of Return Jumps on Liquidity . . . 81
3.4.5 Determinants of Jumps and Cojumps . . . 84
3.5 Cojump Analysis Across Exchange Rates . . . 89
3.5.1 Duration Analysis on Cojumps Across Exchange Rates . . . . 91
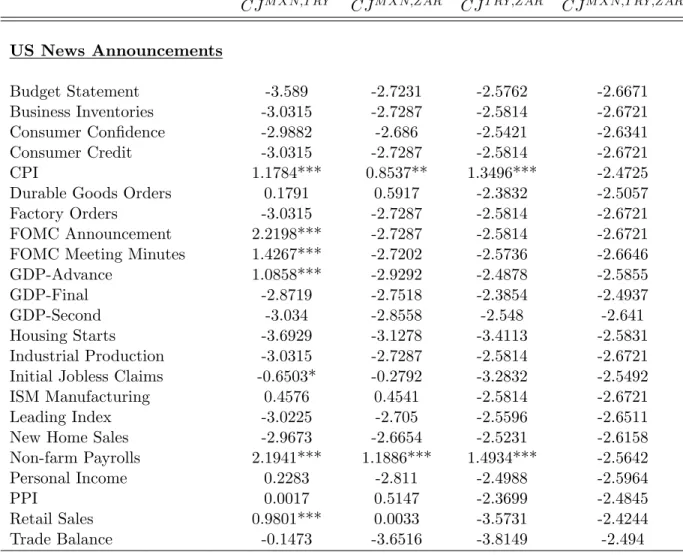
3.5.2 Cojumps and US Macro-News Announcements . . . 95
3.6 Conclusion . . . 95
CHAPTER IV: INTRADAY VOLUME-VOLATILITY NEXUS IN THE FX MARKETS: EVIDENCE FROM AN EMERGING MARKET 99 4.1 Introduction . . . 99
4.2 Data and Summary Statistics . . . 105
4.3 Methodology and Results . . . 111
4.3.1 Contemporaneous Relations . . . 113
4.3.2 Bivariate Dynamic Relations . . . 114
4.3.3 Dispersion of Beliefs and Contemporaneous Dynamic Correla-tions . . . 121
4.4 Conclusion . . . 124
CHAPTER V: CONCLUSION 127
LIST OF TABLES
2.1 Descriptive information of the sample variables . . . 16
2.2 Descriptive statistics of the detected jumps . . . 22
2.3 Impact of portfolio flows on jump size and frequency . . . 26
2.4 Impact of carry trade activity on jump size and frequency . . . 31
2.5 GMM estimation results for robustness . . . 34
2.6 Impact of heterogeneous expectations for the foreign exchange rate levels on jump size and frequency . . . 40
2.7 Impact of belief dispersion of the future value of key macro-economic variables on jump size and frequency . . . 44
2.8 Causality test results between jumps and heterogeneous expectations 47 3.1 Summary table for US and domestic macroeconomic news and central bank announcements . . . 60
3.2 Summary statistics for exchange rate returns and liquidity . . . 61
3.3 Summary statistics for the detected return and liquidity jumps . . . . 67
3.4 Conditional probabilities of return jump occurrences around liquidity jumps . . . 69
3.5 Intraday jump and cojump distribution of exchange rate returns and their liquidity . . . 71
3.6 Summary statistics of the duration between consecutive return jumps, liquidity jumps, and return-liquidity cojumps . . . 75
3.7 LACD(1,1) model fit results for the duration between consecutive re-turn jumps . . . 76 3.8 LACD(1,1) model fit results for the duration between consecutive
liq-uidity jumps . . . 77 3.9 LACD(1,1) model fit results for the duration between consecutive
return-liquidity cojumps . . . 78 3.10 Impact of liquidity jumps on volatility . . . 82 3.11 Impact of return jumps on liquidity . . . 85 3.12 Determinants of return jumps, liquidity jumps and return-liquidity
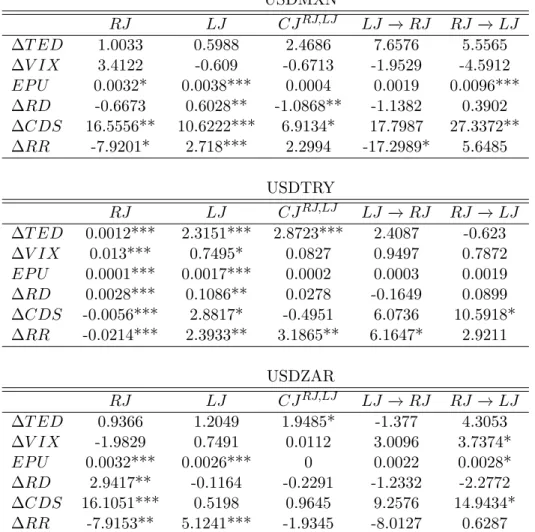
cojumps for each exchange rate . . . 88 3.13 Impact of US based and local macroeconomic news announcements on
return jumps, liquidity jumps and return-liquidity cojumps for each exchange rate . . . 90 3.14 Intraday cojump distribution across exchange rates . . . 92 3.15 Summary statistics for the duration between consecutive return
co-jumps across exchange rates . . . 93 3.16 LACD(1,1) model fit results for duration between consecutive return
cojumps across exchange rates . . . 94 3.17 Impact of US based macroeconomic news announcements on return
cojumps across exchange rates . . . 96 4.1 Summary statistics for FX transactions of banks against TRY . . . . 106 4.2 Summary statistics for USDTRY returns and volatiliy across trading
sessions . . . 108 4.3 GMM estimation results to analyse contemporaneous relation between
volume and volatility . . . 115 4.4 Results of VAR(p)-DCC(1,1)-EGARCH(1,1) model to analyse the
4.5 Results of VAR(p)-DCC(1,1)-EGARCH(1,1) model to analyse the bi-variate dynamic relationship between volume and volatility-cont. . . 120 4.6 Impacts of RND central moments on dynamic correlations between
LIST OF FIGURES
2.1 High-frequency (5 min) levels and returns of USDTRY exchange rate between May 20, 2013 to August 1, 2019. . . 15 2.2 Estimated periodicity pattern and the intraday average absolute changes 18 2.3 Intradaily distributions of size and frequency of detected jumps . . . 20 2.4 Weekly time series of the average jump size and jump frequency for
the local and off-shore trading hours . . . 23 2.5 Carry trade profitability ratios (Carry-to-Risk Ratio) and net TRYJPY
long positions . . . 30 2.6 Mean absolute deviations in the expectations for 3 month ahead
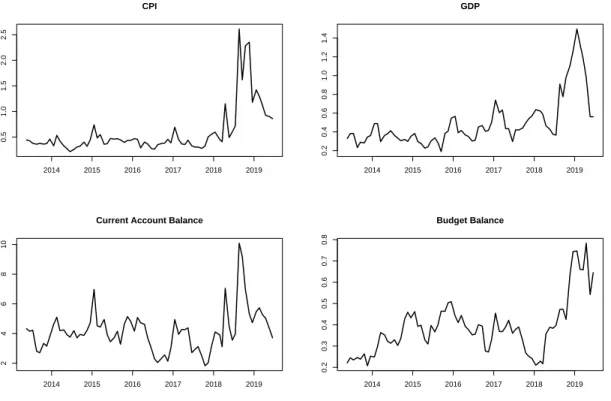
US-DTRY exchange rate derived from FX polls and risk neutral densities of currency options . . . 38 2.7 Mean absolute deviations in the expectations for the 1 year ahead
levels key macroeconomic variables . . . 42 3.1 Intraday volatility and liquidity patterns . . . 65 3.2 Monthly time series of return jumps, liquidity jumps, and
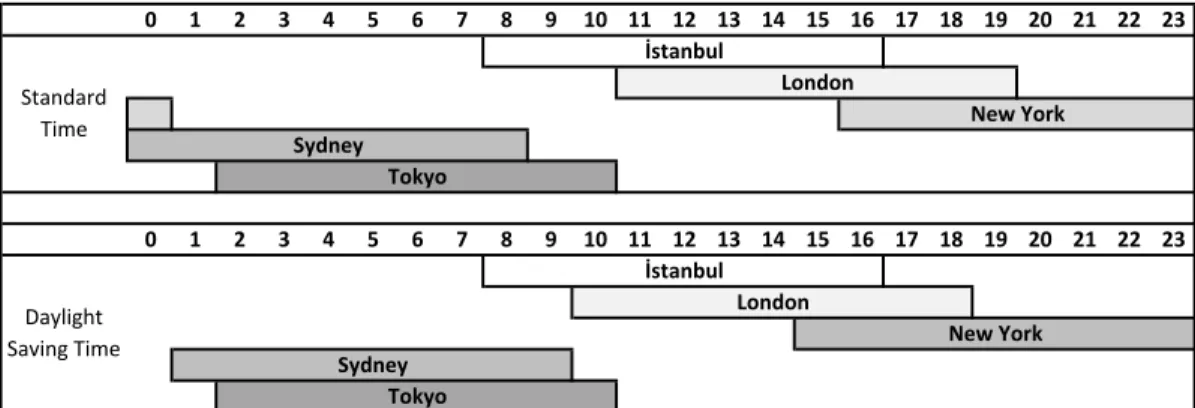
return-liquidity cojumps for each exchange rate . . . 72 3.3 Average absolute log-returns around liquidity jumps (t = 0) . . . 78 3.4 Average proportional quoted spread around return jumps (t = 0) . . . 83 4.1 Hours of FX trading sessions in different locations . . . 107
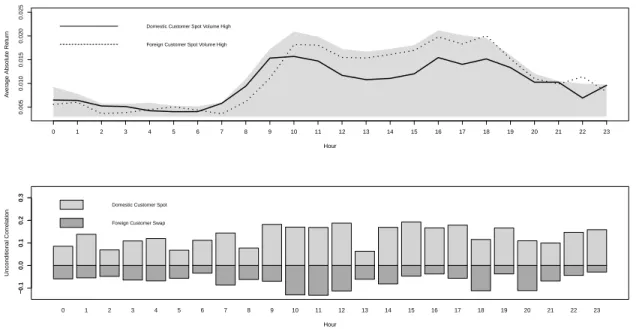
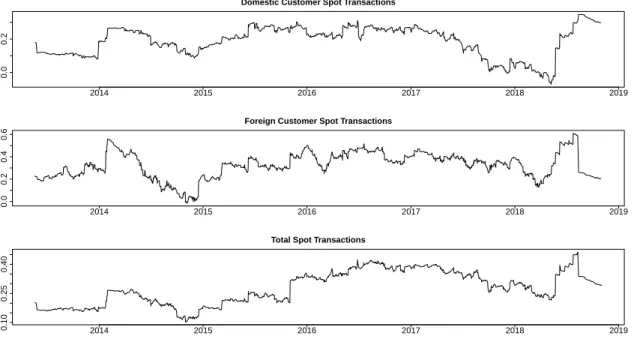
4.2 Intraday volatility patterns with respect to transaction volume by dif-ferent trader and instrument types and intraday correlation patterns between volume and volatility . . . 110 4.3 Average transaction volumes (in USD billions) by the day of the week
with respect to different trader and instrument types . . . 112 4.4 Dynamic conditional correlations between trading volumes and
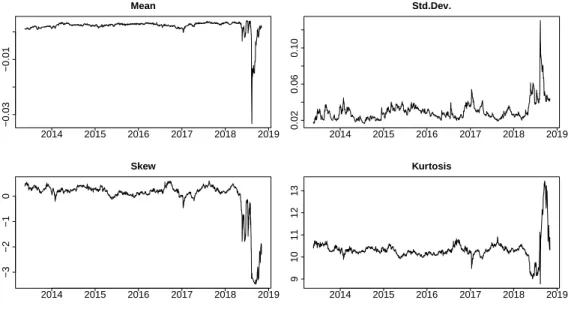
real-ized volatility with respect to different trader and transaction types . 118 4.5 Central moments derived from risk neutral distributions . . . 123
CHAPTER I
INTRODUCTION
1.1.
Overview
Using high frequency exchange rate data, this thesis contributes to the strand of literature that investigates the dynamics of FX jumps first, by focusing on the impact of heterogeneous expectations and portfolio flows on them for USDTRY exchange rate and second by examining the interaction between FX return and liquidity (co)jumps and their individual dynamics for USDMXN, USDTRY and USDZAR exchange rates. Furthermore, by examining the volume-volatility nexus in USDTRY market, the study aims to contribute to the small number of studies investigating volume-volatility relationship due to lack of transaction volume data in FX markets. The thesis is organized as follows:
In the next chapter of this thesis, motivated by the recent currency crisis in Turkey, we investigate the role of portfolio flows and heterogeneous expectations on the high frequency stochastic jump behavior of the US dollar value against the Turkish lira, one of the most traded emerging market currencies in the world. We group the detected jumps into different types with respect to their direction (up and down) and timing (local and off-shore trading hours). For each type of jumps, we examine their relation with portfolio flows (in the form of equity and bond flows, and carry trade activity), and dispersion in beliefs for the future exchange rate level and key
macroeconomic variables. We find that inflows to both equity and bond markets, and increasing carry trade activity significantly reduce the size of jumps and (partially) their intensity. On the other hand, heterogeneous expectations for the future exchange rate level, consumer price index and gross domestic product are found to increase the number of jumps and the average jump size.
In the third chapter, we study the dynamics of return and liquidity jumps, and their common occurrences (cojumps) for the value of Mexican Peso, Turkish Lira and South African rand against US dollar. In particular, we consider the return jumps, liquidity jumps, and return-liquidity cojumps for each exchange rate, then we analyze the return cojumps and liquidity cojumps across exchange rates. We find that the duration between consecutive return jumps are significantly reduced by average realized volatility in the same period for all currencies. Our empirical results also show that for Turkish lira, the average realized volatility between two consecutive liquidity jumps significantly reduce the duration between them. Furthermore the findings of the paper show that the arrival rates of both return and liquidity rates are significantly positively affected by increasing market risk and liquidity factors like policy uncertainty, CDS and TED spread. Also, consistent with the earlier evidence, key local and US news releases like central bank
decisions, CPI, GDP and Non-farm Payroll announcements significantly increase both return and liquidity jump occurrences.
In the last chapter, using a dataset on local banks’ daily FX transaction volume segregated into counterparty and transaction types, this article investigates the relationship between trading volume and intraday realized volatility for the US dollar / Turkish lira parity (USDTRY), one of the most traded emerging market currencies against US dollar. We question whether type of counterparty and transaction affects intraday volume-volatility relationship across various trading sessions around the world. We reveal that only the spot transactions of domestic
customers have positive contemporaneous relation with realized volatility and this significance is valid only in global trading sessions that mostly overlap with the local trading hours. Furthermore, we utilize a metric for the belief dispersion on the level of future exchange rate via currency options and find that the dispersion significantly strengthens the volume-volatility nexus, confirming the Dispersion of Beliefs Hypothesis.
CHAPTER II
IMPACT OF PORTFOLIO FLOWS AND
HETEROGENEOUS EXPECTATIONS ON FX
JUMPS: EVIDENCE FROM AN EMERGING
MARKET
2.1.
Introduction
In the modern era of the financial markets, a common observation is the infrequent but large movements in asset prices so called jumps. Recent studies show that the presence of price discontinuities in asset prices in the form of sudden spikes or jumps not only deteriorate performance of modeling and forecasting asset returns and volatilities, but also are a priced risk factor with implications on the
risk-return profile of the related assets. Jumps are commonly associated with a sudden flow of new information but there is no general consensus on which kind of market events (Bajgrowicz et al., 2016; Calcagnile et al., 2018; Loughran et al., 2019). In this paper, we pay our attention to the portfolio flows and expectation heterogeneity as the potential sources of jumps at the high frequency level. Motivated by the recent currency crisis in Turkey, we test our hypothesis on the USDTRY exchange rate; i.e., the value of the US dollar against the Turkish lira
which is one of the most traded emerging market currencies in the world.1 Accordingly, we show that jump frequency and average jump size are negatively related to portfolio inflows. Moreover, we find that disagreement on the future level of the exchange rate and the inflation rate increase the average jump size, whereas dispersion of beliefs on the future gross domestic product (GDP) significantly increases the average jump size and partially the jump intensity.
A growing body of literature provides both theoretical and empirical evidence on the implications of jumps in asset prices and emphasizes the importance of their investigation. For instance, in the work of Caporin et al. (2017) and Barunik and Vacha (2018), jumps affect correlations between asset returns and thus have implications on asset allocation and risk management. Liu et al. (2003) state that jumps reduce investors’ willingness to take short or leveraged positions and have implications on optimal portfolio allocation. This finding is supported by Lee and Hannig (2010) who argue that the degree of jump sizes has different implications on portfolio construction by investors with different risk aversion levels. For example, high levels of jump risk due to foreign exchange (FX) illiquidity might discourage foreign investors to invest in the stock market (Lee and Ryu, 2019). Moreover jumps, even if not related with fundamentals, may affect volatility and risk adjusted returns, and might lead to fat-tailed distributions of exchange rate expectations (Eraker et al., 2003). In fact, Bates (1996) argue that fear of
substantial and infrequent jumps in exchange rates explains the excess kurtosis in currency option volatility smiles.
Jumps in asset prices not only disrupt the asset allocation decisions and investor sentiment, but also cause problems in modeling and forecasting key economic and financial variables (Zhang and Dufour, 2019). For instance, Andersen et al. (2007)
1See the most recent Triennial Survey of foreign exchange and OTC derivatives trading by BIS
state that jumps mitigate accuracy in both return and volatility forecasts as they have no predictive information. Accordingly, authors show that separating
exchange rate jumps from smooth variation component significantly improves out of sample forecasts. In a similar fashion, Corsi and Renod (2010) show that
separating continuous and discontinuous components of returns improves volatility forecasts. Likewise, Giot et al. (2010a) decompose realized variance into its
continuous and jump components and find that the positive relationship between volume and volatility is valid only for the continuous component of volatility.
Among the price jumps in various asset classes, the case of exchange rate jumps takes a special place. Unlike the jumps in stock prices where the biggest hit is mostly taken by the company’s investors, exchange rate jumps are agitating for both households and corporations in that country. These jumps are not only challenging to hedge but also problematic if not hedged since it can affect not only the financial markets but also the real sector through import & export channel (Li et al., 2018). Unforeseen large movements in exchange rates may increase
institutional investors’ fears of future jumps because they consider the occurrence of large fluctuations in the exchange rate to be more likely. Consequently,
companies in the real sector might be unwilling to expand their investments within the country since they struggle to forecast their operational and financial
performances. With a similar reasoning, banks become unwilling to provide loans in domestic currency which in turn dampens the economic growth of the country through reduced consumption channel. Similarly, jumps in exchange rates possess bigger challenges for policymakers. In particular, (i) central banks might have hard times in implementing inflation targeting or fixed currency regime in the presence of jumps since these jumps impact the level or stability of the exchange rates significantly; (ii) due to the instability of the local currency, households might prefer to use a safe currency to conduct their day-to-day transactions or keep their
savings which leads to an unofficial dollarization in the country, eventually making it much harder to implement an effective monetary policy; and (iii) states might experience troubles in deciding when to roll-over the foreign currency denominated debt because of the increased uncertainty in the FX market. In these scenarios, problems are not limited within the country itself since in case of an occurrence of simultaneous jumps in several countries for some reason, even a diversification at the international level would not compensate the total harm done.
In the strand of literature that investigates the determinants of jumps in exchange rate returns, most of the studies associate jumps with macroeconomic news
announcements or central bank interventions. Lahaye (2016) shows that the jump and co-jump activity of exchange rates increase around scheduled macro-news announcements while Omrane and Savaser (2017) argue that this response is time-varying and depends on the economic conditions. Likewise, Chatrath et al. (2014); F¨uss et al. (2018) associate jumps with macroeconomic news arrival whereas Andersen et al. (2007) associate detected exchange rate jumps with both macroeconomic news announcements and central bank interventions. Beine et al. (2007) analyze the linkages between the jumps in the value of euro and Japanese yen against the US dollar and central bank interventions. Authors show that coordinated interventions lead to infrequent but large jumps. Dewachter et al. (2014) introduce the concepts of continuous volatility and discontinuous jumps for FX markets, and link them with communications of monetary authorities. Authors show that such communications have different effects on the continuous and
discontinuous parts of the exchange rate volatility. Lahaye et al. (2011) show that important macroeconomic news announcements like federal funds target, non-farm payroll and GDP announcements are very likely to create jumps in exchange rates, in addition to stock index futures and bond futures. Lee and Wang (2019a)
that announcements of macro-fundamentals like GDP differentials or trade balance can predict size and frequency of jumps.
Another candidate for the potential source of jumps in exchange rates is the excess volatility due to foreign portfolio flows and there is a substantial body of empirical evidence supporting this argument. For instance, Froot and Ramadorai (2005) decompose currency returns into intrinsic-value shocks (permanent) and expected-return shocks (transitory) and show that expected-return shocks are correlated with portfolio flows. Banti and Phylaktis (2015) consider capital flows as a proxy for the liquidity demand and associate exchange rate jumps with portfolio flows through the impact of such flows on liquidity. However, equity and bond flows may have different impact on the jumps in exchange rates, hence a separate analysis might be required. For example, Caporale et al. (2017) show that while equity inflows increase the exchange rate volatility for emerging Asian economies, bond inflows have the opposite impact. In their study, the difference is attributed to the higher hedging activity for bond investments compared to equity
investments in emerging markets. Therefore, in the special case of jumps, an interesting aspect of such analysis would be whether equity and bond flows imply different impact on size and frequency of jumps since they have different investor bases and they are part of different trading strategies.
In addition to the equity and bond flows, carry trade activities might also
constitute strong short term impact on exchange rate jumps for high yield emerging market currencies. In particular, jumps might occur with sudden and large amounts of unwinding of currency positions. According to Brunnermeier et al. (2008), carry currencies with higher interest rate differentials may experience more frequent positioning or position unwinding thus are subject to higher crash risk and might face more jumps in exchange rate returns, which is the case mostly for emerging market currencies (Suh, 2019). In parallel to this finding, Chernov et al. (2018)
recently show that the probability of a jump in an exchange rate corresponding to the appreciation of the US dollar is increasing in the foreign interest rate. In another study, Nirei and Sushko (2011) support these arguments above and discuss that asymmetries between negative and positive jumps may imply stochastic unwinding of carry trades. This, in turn, causes appreciation episodes in funding currencies like Japanese yen and depreciation pressures in investment currencies. On top of the aforementioned potential sources, many papers emphasize the significant positive impact of heterogeneity in beliefs on the trading activity in the FX markets, thus increased volatility in exchange rates. Tauchen and Pitts (1983) and Harris and Raviv (1993) theoretically model this hypothesis for assets in general. Accordingly, the higher dispersion in beliefs is a proxy for higher
uncertainty that the traders face by contaminating expectations for the fair value of the traded asset. Thus, this disagreement leads to more frequent quote updates, hence higher volatility. According to this argument, dispersion in beliefs increases only the volume related volatility, however heterogeneity of expectations can increase the volatility of the traded asset also through increased hedging demand (Buraschi and Jiltsov, 2006; Shalen, 1993). Indeed, Beber et al. (2010) empirically show that heterogeneity in expectations for future exchange rate levels affect the shape of implied volatility smile, volatility risk premiums and therefore, future currency returns. Subsequently, these findings imply that belief dispersion in future exchange rates might be a source of jump activity.
In the context of the heterogeneity argument, it is plausible to suppose that the implications of heterogeneous expectations theory for exchange rate forecasts might also be valid for the expectations of investors for the key macroeconomic variables. In fact, a limited strand of literature also associates heterogeneity in expectations for key macroeconomic variables with exchange rate volatility. For instance, Hogan and Melvin (1994) argue that heterogeneity in trade balance forecasts has strong
impact on the US dollar/Japanese yen fluctuations. In parallel to this scenario, heterogeneous beliefs on the future growth rate of the economy, inflation rate, current account balance or budget balance can be argued to have similar significant impact on the jump dynamics of an exchange rate.
In this study, our focus is on the jumps realized in the USDTRY exchange rate, and the reason is the following: It is widely known that emerging market currencies tend to have higher jump frequencies and larger jump sizes compared to those of the developed markets. Moreover, according to Lee and Wang (2019a), Turkish lira is the most frequently jumping currency with 1.1% jump probability and 17.06% day with at least one jumps probability between 2007 and 2015 among the sample group of most traded 16 emerging market currencies. This finding was supported by the recent events that took place in the foreign exchange market in 2018, in which the Turkish lira lost 42% of its value against the US dollar that makes it the second worst performing currency in the world after Argentine peso.
Indeed, the problem started in 2013 when the Fed decided to tighten its monetary policy that converts the loose conditions started with the quantitative easing operations to combat the 2008 financial crisis. During the period between 2008 and 2013, low US dollar interest rates let emerging markets to borrow more heavily in dollar-denominated debt, in an environment where many of these countries were already dealing with chronic current-account deficit problems. Beginning with the Fed’s tightening policy, high dollar debt combined with high current account deficit diminished investors’ confidence in the emerging markets’ ability to repay their external debt. Turkey was no exception in this environment and the country
suffered its share of challenges. Yet, the year 2018 was unlike the others for Turkey. Being the 13th largest economy in the world2, the economy was already suffering
2According to the International Monetary Fund, the World Bank and the CIA World Factbook,
from overheating concerns and spurred inflation due to government’s prolonged stimulus package from 2017. Thing came to a point where the lira lost 16% of its value in a single day, following political tensions with the United States. Moreover, just in August, there were 11 days (out of 23 trading days) in which the USDTRY parity experienced at least ∓2% change.3 After weeks of dragging its feet, the
central bank eventually implemented an extensive hike in interest rates (from 17.75% to 24%) followed by the government’s announcement of a fiscal austerity drive. Since then, the conditions seem to have been stabilized, however the lira still remains to be highly vulnerable to the changes in market sentiment. Considering all these developments that occurred in the last few years, it is clear that the USDTRY exchange rate is highly susceptible to all kinds of local and global political, economical and financial events, therefore an analysis on its jump dynamics is essential to various types of stakeholders in the market. We further believe that such an analysis would help and guide us in understanding the potential currency risks (with sources and consequences) that other emerging markets might experience in the cases of high foreign currency debt and high current account deficit.
In addition to the selection of the exchange rate, the choice of the time frequency to detect jumps is an essential factor in our analysis. Although earlier studies mostly prefer to focus on daily data, we perform our analysis using 5-minute interval high frequency data. The reason is that in today’s modern financial
markets, algorithmic (especially high frequency) trading constitutes the major part of all trading activities. In this framework, automated systems are designed to take actions in shortest possible times in response to real time floating data. Since the FX market is an OTC market, there is no possible way to estimate the share of
3This value represents the daily returns. In fact, in terms of intraday movements, there were
only a few days in the rest of the year that USDTRY did not experience at least ∓1% change within the day.
such computerized systems in the total trade volume, however, regarding the US equities, it is estimated that algorithmic traders execute 85% of the total trades (Glantz and Kissell, 2013). These technological advancements make it essential for us to perform our analysis at the high frequency level (Stenfors and Susai, 2019; Zhou et al., 2019).
In this paper, we proceed in the spirit of Lee and Wang (2019a) and study the determinants of jumps in USDTRY parity in an aggregate way. We first detect the jumps using 5-minute high frequency returns between the years 2013 and 2019 by the non-parametric jump detection methodology of Lee and Mykland (2008). In doing so, we decompose high frequency log-returns of USDTRY exchange rate into diffusion and jump components and classify the detected jumps by positive and negative jumps, and also jumps occurring in local trading hours and in off-shore trading hours. Then we construct weekly and monthly time series of the number of jumps and the corresponding average jump sizes based on the different jump
classifications. Later, we synchronize the occurrence of these jumps with the selected variables and investigate their relationship. In particular, we study the linkages of these jump series with equity and bond portfolio flows, carry trade activity and heterogeneous expectations for the future exchange rate level and key macro-economic variables such as the GDP, consumer price index (CPI), current account balance and budget balance. Such an analysis allows us to describe the high frequency behavior of the USDTRY exchange rate and a comprehensive analysis of the jumps in this parity which have important implications for both investors and policymakers. In essence, our findings show that jump size and frequency are negatively related to portfolio (both equity and bond) inflows and carry trade activity. Furthermore, results provide empirical evidence for dispersion of beliefs hypothesis such that disagreement on the future levels of the exchange rate, GDP and CPI increase the average jump size. Among all the investigated key
macroeconomic variables, heterogeneity in the expected GDP, CPI and budget balance have limited positive significant impact on jump intensities as well, but only in local trading hours. As the final stage, we check for the robustness of these findings through generalized method of moments and Granger causality analyses, and confirm the validity of the main results.
Accordingly, our contribution to the literature is at least threefold. First, we
investigate the determinants of jumps by addressing the relation between jump size and intensity in different trading sessions. Such a differentiation can help
policymakers to focus on the right strategies to take action in battling against the excess volatility caused by jumps during the trading sessions. Moreover, even though it is an unorthodox way, policymakers would have the option to intervene to the FX market in off-shore trading hours when the market liquidity is low since they would know the potential determinants of the jumps during these periods. Second, we advance the literature by providing evidence for heterogeneous
expectations hypothesis. To the best of our knowledge, this is the first paper that links exchange rate jumps with heterogeneous expectations. The heterogeneity in expectations for both foreign exchange rate and key macroeconomic variables are strongly related with monetary and fiscal policy uncertainty. Thus, the resulting positive relation between the two variables have implications on reducing fiscal and monetary uncertainty hence mitigating volatility risk premium. Third, revealing the relation between jump dynamics and the considered factors in this paper contributes to the modeling and forecasting of exchange rate returns and volatility, and thus facilitates the decision making in both future financial performance evaluation and fiscal & monetary policy operations.
The rest of the paper is organized as follows. Section 4.2 describes the source and content of the sample data. Section 2.3 explains the technical details of the jump detection methodology. Sections 2.4 and 2.5 include the main analysis, discuss the
empirical findings and check the results for robustness. Finally, Section 4.4 concludes.
2.2.
Data and Summary Statistics
The intraday USDTRY spot exchange rate data is obtained from Bloomberg. This dataset is in 5-min frequency and covers slightly more than six years from May 20, 2013 to August 1, 2019. There are 1618 trading days over this period and thus 465,984 (1618 × 288) 5-min intervals. We have 464,596 observations after filtering for the missing values. As Turkish lira is traded in all global FX trading sessions, high frequency data is available during when the global FX market is open.
Depending on whether it is summer time or the daylight saving time, the global FX market is open either from 00:00 Monday to 00:00 Friday or from 01:00 Monday to 01:00 Saturday with respect to Greenwich Mean Time (GMT). We omitted the very limited number of observations out of these global trading hours from the sample. All timestamps used in this study denote the local timezone in Turkey. The resultant exchange rate series and its corresponding returns are provided in Figure 2.1. The level series displays the trend in the depreciation of the Turkish lira against the US dollar since the 2013, whereas the return series exhibits the high intraday volatile periods during the summer of 2018.
The weekly unique portfolio flow data is obtained from the Central Bank of the Republic of Turkey (CBRT), and it contains the weekly net changes in equity and bond holdings of non-residents in USD millions.
To obtain measures for heterogeneous expectations from the foreign exchange rate forecasts, we use two different datasets. The first one is the FX forecasts of Reuters FX polls. This dataset includes monthly forecasts of individual contributors where
2014 2015 2016 2017 2018 2019 2 3 4 5 6 7 USDTR Y 2014 2015 2016 2017 2018 2019 −0.02 0.00 0.02 0.04 log retur ns
Figure 2.1: High-frequency (5 min) levels and returns of USDTRY exchange rate between May 20, 2013 to August 1, 2019.
the average number of forecasters is 30 through the sample period. The second dataset is the daily currency option prices and implied volatilities obtained from Bloomberg terminal by which we calculate the foreign exchange rate expectation moments via the derived risk neutral densities.
We obtain forecasts of the key macroeconomic variables from Consensus
Economics. This dataset includes cross-section of individual forecasts for major macro-economic variables. The survey is monthly and covers the entire analysis period. The number of survey participants range from 11 to 25 with an average of 17 during the sample period. Table 2.1 summarizes the source and content of the variables under consideration.
2.3.
Jump Detection Methodology
To extract the jump component of volatility, we employ the jump detection methodology developed by Lee and Mykland (2008). Compared to other jump detection methodologies, this method has the advantage of allowing determination of both size and direction of jumps by indicating their precise times (Neely, 2011).
T able 2.1: Descriptiv e information of the sample v ariables V ariable Source F re qu e n c y Sample Ob serv ations USDTR Y Blo om b erg 5-min Ma y 2013-July 2019 464,596 Currency Option P arameters Blo om b erg Daily Ma y 2013-July 2019 1618 Equit y/Bond Flo ws CBR T W eekly Ma y 2013-July 2019 323 USDTR Y F orecasts Thomson Reuters Mon thly Jan 2014-July 2019 67 Macro V ar. F orecasts Consensus Economics Mon thly Ma y 2013-July 2019 74
This methodology basically involves calculating a test statistic for each return observation by comparing its absolute value with a rolling window local variation measure as the following:
Jt,i =
| rt,i |
ηt,i
(2.1)
In this setup, each day t consists of M equally spaced intraday returns, where rt,i is
the 5-min log-return of the spot exchange rate in the interval i of day t and ηt,i is
the local variation measure calculated by an integrated volatility measure. Since standard realized volatility measures (e.g., sum of squared log-returns) fail to estimate integrated volatility consistently in the presence of jumps, Lee and
Mykland (2008) suggest estimating ηt,i by a jump robust realized volatility measure
called realized bi-power variation (RBPV) developed by Barndorff-Nielsen and Shephard (2004) as the following:
RBP Vt(M ) = µ−2 M M − 2 M X i=2 | rt,i || rt−1,i| (2.2)
where µ =p2/π and M is the number of observations in the local variation window. One important aspect of this local variation measure is the selection of appropriate window length. Lee and Mykland (2008) suggest that it is appropriate to use a window length of 270 data points for 5 minutes returns.
In calculating Jt,i, intraday periodicity has to be taken into account. In order to do
this, Boudt et al. (2011) propose to re-scale returns by an intraday periodicity factor so that one can avoid over-detection (under-detection) of jumps in intraday intervals with high (low) volatility. Motivated by this, we follow the procedure suggested by Boudt and Petitjean (2014) and estimate the intraday periodicity factor ft,i by estimating a flexible Fourier specification as in Andersen and
Bollerslev (1998). In Figure 2.2, we show the estimated volatility periodicity factors and the realized intraday volatility pattern (average of absolute log-returns for each 5-min interval). The volatility is higher around local trading session and decreases through off-shore trading session. In the realized periodicity pattern, the spikes are observed around the opening and closing of the local trading sessions. Once we estimate the intraday periodicity factor ft,i, we obtain the filtered jump
statistic F Jt,i as the following:
F Jt,i = | rt,i | ηt,ift,i (2.3) 02:00 07:00 12:00 17:00 22:00 0.00005 0.00015 0.00025 Hour A v er
age of Absolute 5−min Log−Retur
ns 0.4 0.6 0.8 1.0 1.2 1.4 1.6 Intr ada y P er iodicity F actor
Figure 2.2: Estimated periodicity pattern and the intraday average absolute changes
Note: The dashed line is obtained by averaging absolute value logarithmic returns for each 5 minute interval. The solid line shows the periodicity pattern estimated from the
sample of 5-min frequency observations from May 20, 2013 to August 1, 2019.
In order to overcome the problem of underestimation of ηt,i, and thus over-rejection
of the null hypothesis of no jump in the local variation window in times of many repeating quotations or missing values, we eliminate the jump statistics for the returns whose local variation window contains 58 (that is more than 20% of 288, the number of 5-minute observations in a trading day) or more zero, or missing
values. This allows us to avoid false jump detection in public holidays when the market is open but there is too little trading activity.
Lee and Mykland (2008) show that the obtained jump statistic follows a standard Gumbell distribution. Thus we reject the null hypothesis of no jump if the filtered F J statistics are greater than the value suggested by the Gumbell distribution; i.e.,
F Jt,i > G−1(1 − α)Sn+ Cn (2.4)
where G−1(1 − α) is the (1 − α) quantile function of the Standard Gumbell
distri-bution, Cn= (2 log n)0.5− log(π) + log(log n) 2(2 log n)0.5 (2.5) and Sn = 1 (2 log n)0.5 (2.6)
with n denoting the number of total observations. The α term in equation (3.5) is the significance of discontinuity in the local variation window and we use an α level of 5% in the rest of the paper.
Figure 2.3 illustrates the intra-daily size and frequency distribution of the detected jumps. The jumps in local trading sessions are lower in number but their
magnitude are much larger compared to those realized during the off-shore trading hours. Similar to the daily volatility pattern, jump size and intensity both rise around the market opening and closing times and the intervals around local and US macro news release hours. Average jump size takes its highest value in the 5-minute interval covering 10:00 a.m., in which major local macro-news
02:00 07:00 12:00 17:00 22:00 0 20 40 60 Number of J umps 02:00 07:00 12:00 17:00 22:00 0.2 0.4 0.6 Hour A v er age J umps Siz e
Figure 2.3: Intradaily distributions of size and frequency of detected jumps Note: This figure shows the intraday distribution of jump intensity and jump size.
In the upper plot, we display the jump frequency within the corresponding 5-min intervals. In the lower plot, we calculate the average absolute percentage returns of
relatively higher around US macro-news release hours, mostly around 15:30 (or 16:30 when daylight saving time is used).
As the size and frequency of jumps differ in local and off-shore trading sessions, we distinguish them for analysis purposes since characterization of jumps depending on their occurrence time may provide additional insight on their determinants. In particular, by separating jumps with respect to different trading sessions, we question whether their determinants vary across liquidity conditions. Due to its size and de-centralized structure of the FX market, various types of traders with different trading scopes and information sets are present in different trading sessions. Off-shore markets exhibit reduced participation of local retail, interbank and central bank activity thus with the reduced market debt, the likelihood of sudden return and jumps might increase due to illiquidity. In addition, since bid-ask spread widens around off-shore trading hours, another important
consequence is the decrease in high frequency trading activity due to higher trading costs. To distinguish jumps occurring in local and off-shore trading sessions, we refer to jumps in local trading sessions as the jumps occurring between 08:00 to 18:00 in local time zone and otherwise off-shore trading hour jumps.
In Table 2.2, we present the summary statistics of the detected jumps with respect to trading hour classifications. We identify 3933 jumps over the whole sample period. The number of positive jumps exceeds negative ones by 16%. Average jump size is 0.09% and it is higher for positive jumps.4 A big portion of the jumps occur in off-shore trading sessions but their average size is less than half of those jumps occurring in local trading sessions. Extreme case analysis provides us fascinating results. Accordingly, at some point in the sample, Turkish lira lost 4.48% of its value against the US dollar in just 5 minutes. Although this observation is realized
4In our context, positive (negative) jump yields depreciation (appreciation) of the local currency
T able 2.2: Descriptiv e statistics of the detected jumps J f r eq u ency J siz e P (J ) J day s P (J day s ) J siz e max obs. All T rading Sessions J 3933 0. 091 0.85% 1207 74.60% 4.48% 464,596 J − 1820 0. 086 0.39% 921 56.92% 2.36% 464,596 J + 2113 0. 094 0.45% 988 61.06% 4.48% 464,596 Lo cal T rading Sessions J 505 0.163 0.26% 374 23.11% 2.36% 193,698 J − 226 0.160 0.12% 201 12.42% 2.36% 193,698 J + 279 0.165 0.14% 231 14.28% 2.03% 193,698 Off-Shore T rading Sessions J 3428 0.080 1.27% 1123 69.41% 4.48% 270,898 J − 1594 0.076 0.59% 833 51.48% 1.27% 270,898 J + 1834 0.084 0.68% 906 56.00% 4.48% 270,898 Note: In this table w e rep ort th e descriptiv e statistics of the detected jumps at 5% significance lev el using the non-parametric approac h suggested b y Lee and Mykland (200 8) after filtering the data for the in trada y p erio dicit y pattern suggested b y Boudt et al. (2011). The sample includes 1618 business da ys co v ering the p erio d from Ma y 20, 2013 to August 1, 2019. P (J ) denotes the p ercen tage of 5-min in terv als with a jump in the sample whereas P (J day s ) is the p ercen tage of da ys with at least one jump in the sample. J siz e max is th e maxim um jump size observ ed in a single 5-min in terv al.
in an off-shore trading session, the case of the local trading session is not so different. Both positive and negative jumps larger than 2% occasionally occur in only 5 minutes when the FX market is at its most liquid state.
2014 2015 2016 2017 2018 2019 0 2 4 6 8 10
Local Trading Hours
Number of J umps 2014 2015 2016 2017 2018 2019 0.0 0.4 0.8 1.2
Local Trading Hours
A v er age J umps Siz e−% 2014 2015 2016 2017 2018 2019 0 10 20 30 40
Off−shore Trading Hours
Number of J umps 2014 2015 2016 2017 2018 2019 0.0 0.2 0.4 0.6 0.8 1.0
Off−shore Trading Hours
A v er age J umps Siz e−%
Figure 2.4: Weekly time series of the average jump size and jump frequency for the local and off-shore trading hours
Figure 2.4 displays the weekly time series of the number of jumps and the average jump size regarding the USDTRY exchange rate, segregated at the local and off-shore trading periods. During the off-shore trading hours, jump intensity exhibits more of a uniform distribution across time. On the other hand, there is a clear accumulation in the observed jumps in the years 2018 and 2019, reflecting the excess volatility and uncertainty in the economic and financial markets in Turkey during that time. The month with the highest average jump size is the August of 2018 when the country was experiencing one of the most turbulent financial periods in its history. In this month, average jump size is 0.36% with positive jumps having
an average of 0.40%, showing the serious depreciation of the local currency in short time periods. The maximum number of jumps, on the other hand, is observed in August 2017. In this month, there are 42 negative and 55 positive jumps, adding up to 97 in total. However, we need to emphasize that 61 out of 97 jumps that occurred in this month are realized in the off-shore trading hours.
2.4.
Potential Sources of the Jumps I: Portfolio
Flows
In this section, we try to find out the potential sources of the jumps in the USDTRY exchange rate series through a portfolio flow analysis. Specifically, we test for the effects of equity and bond flows, and carry trade activity.
2.4.1
Equity and Bond Flows
To investigate the linkage between the weekly foreign portfolio flows and the weekly average jump size and frequency, we aggregate high frequency jump observations into a weekly series denoted by Jt. To avoid synchronicity problems, we carefully
match the jumps and the portfolio flow data (which is recorded from Monday to Friday) to cover exactly the same time period within a week. To analyze the impact of equity and bond portfolio flows, we follow a similar specification with Caporale et al. (2017) and estimate the following regression in equation (4.4).
Jt= µ + ϕ1Jt−1+ ϕ2F equity
t + ϕ3F
equity
t−1 + ϕ4Ftbond+ ϕ5Ft−1bond+ vt (2.7)
In this equation, Ftequity and Ftbond stand for net equity and bond inflows in million USD units in week t, respectively. When we estimate the model above, we consider several variants of the jump variable Jt. In particular, we analyze the number of
jumps and their average size; their direction (overall, positive, negative); and jump occurring times (overall, local trading hours, off-shore) that add up to
2 × 3 × 3 = 18 versions of the Jt. Such an identification allows us to identify
differential impacts of potential explanatory variables to different jump variants. The lagged jump term Jt−1 is included to capture the potential jump clustering
phenomena.5,6 In each estimation (and the following estimations within the rest of
this paper), standard errors are adjusted for heteroskedasticity and autocorrelation using Newey and West (1987) procedure.
In addition to the segregate analysis of the impact of equity and bond flows, we want to see the effect of the overall portfolio flows on the exchange rate’s jump dynamics. To do so, we sum up equity and bond flows and estimate the model in equation (4.5) for the total flows Fttotal:
Jt= µ + ϕ1Jt−1+ ϕ2Fttotal+ ϕ3Ft−1total+ vt (2.8)
The estimation results of the models in equations (4.4) and (4.5) are displayed in Table 2.3. The regression results show that there is a contemporaneous and significantly negative impact of equity and bond inflows. The lagged equity and bond inflows on the other hand, has no significant impact on any variant of jump
5One of the stylized facts of the financial markets is volatility clustering, i.e., ‘large asset price
changes tend to be followed by large changes again, of either sign, and small changes tend to be followed by small changes’ as stated by Mandelbrot (1963). Since jump is a special case of volatility, it is plausible to assume that similar effect might also be observed. For example, see Ait-Sahalia et al. (2015).
6Through the rest of the paper, when we search for the potential sources of jumps, the
inde-pendent lagged jump term Jt−1 is considered in the same category with the dependent concurrent
jump term Jt with respect to the sign of the jump. In particular, when we try to explain the size
or the frequency of the positive (negative) jumps, the lagged jump term Jt−1is also either the size
or the frequency of the positive (negative) jumps. However, one might argue that lagged jumps can create concurrent jumps with the opposite sign as the markets tend to display bouncing effects from time to time. In this paper, for all the analyzed models in search for the sources of jumps, we
also estimate their counterparts where the lagged jump term Jt−1 is independent of the sign; i.e.,
it reflects the values related to the total jump characteristics. The corresponding results are quali-tatively the same with the original findings (since jumps are usually found to occur symmetrically in a week in our analysis) and they are provided in the Internet Appendix.
T able 2.3: Impact of p ortfoli o flo ws on jump size and frequency Equit y & Bond Flo ws T otal Flo ws Jt− 1 F eq uity t F eq uity t− 1 F bond t F bond t− 1 R 2 Jt− 1 F total f low s t F total f low s t− 1 R 2 All J f r eq 173.11*** 1.031 1.244 -1.85*** -0.371 4. 7% 167.70587*** -1.23898** 0.080 4.0% J f r eq ,− 58.301 0.375 0.63 2 -0.95** * 0.006 2.2% 56.475 -0.67525* 0.194 1.7% J f r eq ,+ 166.79*** 0.554 0.659 -0.85** -0.473 4.1% 161.22558*** -0.542 -0.188 3.5% J siz e 323.89*** -0.05* ** 0.03** -0.01** -0.006 13.9% 316.44882*** -0.01878*** -0.001 12.6% J siz e, − 242.41*** -0.06* ** 0.03** -0.02*** -0.008 10 .5% 231.15213*** -0.02558*** -0.003 9.0% J siz e, + 252.73*** -0.04** 0.028 -0.01** -0.008 8.8% 250.62331*** -0. 01811*** -0.003 8.1% Lo cal J f r eq 148.56* 0.677 0.240 -0.32445* 0.005 4.0% 159.03712** -0.123 0.104 2.9% J f r eq ,− -51.275 0.53201* 0.30 8 -0.121 0.049 2 .3% -34.379 0.014 0.132 0.8% J f r eq ,+ 168.15** 0.228 0.035 -0.22648* -0.067 4.1% 170.70948** -0.136 -0.023 3.6% J siz e 176.93* -0.1** -0.013 -0.017 0.000 6.2% 176.22044* -0.0 3339*** -0.007 5.3% J siz e, − 67.009 -0.07127* 0.000 -0.01887* 0.005 1.6% 63.706 -0.02911** 0.002 1.3% J siz e, + 80.996 -0.08** 0.000 -0.02** -0.014 3.6% 80.751 -0.03204** -0.015 3.1% Off-Shore J f r eq 161.63*** 0.316 1.022 -1.53** -0.399 3.9% 156.32729*** -1.11949** -0.039 3.5% J f r eq ,− 69.942 -0.099 0.385 -0.85*** -0.051 2.1% 67.104 -0.6915** 0.06 9 1.9% J f r eq ,+ 159.45*** 0.305 0.624 -0.6257* -0.408 3 .4% 154.52529*** -0.409 -0.166 3.0% J siz e 223.35*** -0.04 *** 0.02 2 -0.01** * -0.007 8.0% 219.6 0136*** -0.01816*** -0.003 7.2% J siz e, − 244.32*** -0.05 *** 0.02543* -0.02*** -0.006 10.7% 237.16511*** -0.02169*** -0.002 9.5% J siz e, + 168.92*** -0.04** 0.021 -0.01** -0.007 4.6% 168.41094*** -0 .01606*** -0.003 4.1% Note: Th is table presen ts the regress ion results of equations (4.4) and (4.5). The sample p erio d is from Ma y 2013 to July 2019. F eq uity t , F bond t and F total t stand for w eekly equit y , b ond and total p ortfolio flo ws in million USD units resp ectiv ely . The co efficien t estimates are m ultiplied b y 1000 for impro ving readabilit y . J f r eq and J siz e denote the jump in tensit y and a v erage jump size resp ectiv ely . The ”+” and ”-” signs sho w direction of the jumps. Stand ard errors are adjusted using the New ey-W est pro cedure. ***, **, and * refer to 1%, 5% and 10% significance lev els.
size and frequency except the positive impact of lagged equity inflows on average size of negative jumps at 5% level. An increase in equity, bond or total foreign portfolio inflows significantly reduces the average jump size in general, and also the jump intensity in some occasions. In both local and off-shore trading sessions, equity and bond inflows significantly decrease the average size of positive jumps. In addition to that, the bond inflows significantly reduce the number of jumps in off-shore trading sessions. Overall, the coefficient estimates show that, increase in bond inflows decreases both the size and frequency of jumps significantly. One billion US dollar worth of equity inflow reduces overall jump sizes by 0.05% which is 55% of the average jump size. Likewise, the bond inflows that worth the same amount in US dollars reduce the average jump size by 0.01% which is 11% of the average jump size. Total of equity and bond inflows reduce the average size of upward and downward jumps in both local and off-shore trading sessions. We further observe that in the off-shore trading session, total inflows and the number of negative jumps are inversely related. As the jump component accounts for a significant portion of volatility, results confirm the hypothesis that foreign portfolio inflows have a stabilizing effect on the exchange rates.
2.4.2
Carry Trade Activity
In practice, while equity and bond flows mainly measure the flow in exchange traded funds, another important source of foreign funds are in the form of carry trade investments, and the Turkish lira is among the most heavily traded emerging market currencies in carry trade strategies. However, since such strategies involve over the counter transactions, their volume data is not readily available as in the case of equity and bond flows. Therefore, we use some proxies at this stage. Since carry trade investors seek for risk adjusted rate differentials, an ex-ante
trade activity (or profitability) which is expected to have a significant impact on exchange rate jumps since this profitability performance can lead to unwinding or increasing carry trade positions and thus may lead to sudden upwards or
downwards movements in the exchange rates (Curcuru et al., 2011; Galati et al., 2007).
Carry trade profitability can be calculated through a plain vanilla carry trade strategy by taking the differences in investing and the funding currency interest rates and adjusting it for risk via the implied volatility as in follows,
Ct= rT RY t − rtU SD IVU SDT RY t (2.9)
where rT RY is the 3 month FX swap rate, rU SD is the 3 month LIBOR rate and
IVU SDT RY denotes the 3 month at-the-money implied volatility derived from the
USDTRY options. Changes in Ct enables us to decide whether a currency will be
(hypothetically) subject to unwinding of carry trade positions or not; in other words, increasing Ct implies position formation in Turkish lira whereas decreasing
Ct shows unwinding of long positions in Turkish lira. In order to analyze the
impact of carry trade profitability on the exchange rate jump dynamics, we estimate the model in the following equation (4.6),
Jt= µ + ϕ1Jt−1+ ϕ2∆Ct+ ϕ3∆Ct−1+ vt (2.10)
and as in the previous analysis, we consider all 18 variants of the Jt to understand
the impact of carry trade profitability in several dimensions.
Carry trade activity can also be measured by the net short positions in the funding currency and the net long positions in the target currency. For instance,
Brunnermeier et al. (2008) and Hutchison and Sushko (2013) use net futures positioning data from Commodity Futures Trading Commission for that purpose. In their setting, net long futures position in the target currency is used as a proxy for carry trade activity. Since a major funding currency in Turkish lira carry strategies is the Japanese yen (JPY), we also use the net long open interest in TRYJPY futures contracts traded in the Tokyo Financial Exchange as an alternative tractable measure of carry trade activity for robustness. Although trading volume in this market constitutes a small portion of the total trading volume of the Turkish lira derivatives, we still believe that the results might present new insights on the subject and provide consistency for the analysis of carry trade strategies involving US dollars. At this stage, the main model to be estimated is presented in the following equation (4.7) in which the NLP refers to the net long position in the Turkish lira.
Jt= µ + ϕ1Jt−1+ ϕ2∆N LPtT RY J P Y + ϕ3∆N LPt−1T RY J P Y + vt (2.11)
Figure 2.5 exhibits the carry trade profitability in time through investing in Turkish lira against the US dollar (on the right) and Japanese yen (on the left). Comparing these figures shows us that net long positions in TRYJPY futures contracts closely follow the carry-to-risk ratio of the Turkish lira against the US dollar, confirming the appropriateness of carry-to-risk ratio as a proxy for carry trade activity. Table 2.4 displays the estimation results of both equations (4.6) and (4.7). Increases in carry-to-risk ratio significantly reduce the number of positive jumps in local trading sessions and both negative and positive jump frequency in the off-shore trading sessions. Furthermore, we find that carry-to-risk ratio is negatively related to the average size of upward jumps in off-shore trading sessions. These findings are not surprising as the decreasing carry-to-risk ratio lowers the attractiveness of the Turkish lira, leading to unwinding of positions. Thus, negative
relationship between jump frequency and carry trade activity confirms the previous risk based explanations of Brunnermeier et al. (2008) on the subject. Furthermore, the significance of the negative impact is stronger in off-shore trading hours which implies a stronger carry trade activity in this period.
2016 2017 2018 2019 100000 150000 200000 250000 300000 350000 TR
YJPY Net Long P
ositions 0.6 0.8 1.0 1.2 1.4 JPYTR Y Carr y T rade Profitability 2014 2015 2016 2017 2018 2019 0.4 0.6 0.8 1.0 1.2 1.4 USDTR Y Carr y T rade Profitability
Figure 2.5: Carry trade profitability ratios (Carry-to-Risk Ratio) and net TRYJPY long positions
Note: Subfigure in the left shows the monthly net open interest in TRYJPY futures contracts and the risk adjusted profitability (carry-to-risk ratio) of JPYTRY carry trade. Net long open interest is plotted as the dashed line and is calculated by the difference between open long interests and the open short interest. Single futures contract size is 10,000 TRY. Subfigure in the right shows the weekly carry-to-risk ratio which measures ex-ante carry trade profitability of USDTRY exchange rate.
As mentioned earlier, carry-to-risk ratio measures carry trade activity implicitly whereas the net changes in long TRYJPY futures positions provide a more direct measure. Since, the Japanese yen denominated instruments have long been providing low yield, the high interest rates provided by the Turkish lira makes TRYJPY as a popular carry trade pair. Accordingly, an increase in net long
T able 2.4: Impact of carry trade activit y on jump size and frequency Carry T rade Profitabilit y TR Y/JPY Net Long P ositions Jt− 1 Ct Ct− 1 R 2 Jt− 1 N LP T R Y J P Y t N LP T R Y J P Y t− 1 R 2 All J f r eq 0.148*** -16.736*** -3.651 4.3% -36.8733 -0.1341* 0.0544 8.8% J f r eq ,− 0.062 -4.881 -2.149 1.2% -183.4973 -0.0637** 0.018 11.7% J f r eq ,+ 0.138** -11.742* ** -1.999 4.8% 52.3938 -0.071 5* 0.0343 7 .5% J siz e 0.396*** -0.092 -0.09 4 16.3% 596.1289*** -0.0 009*** 0.0002 56.2% J siz e, − 0.326*** 0.02 -0.05 10.8% 5 62.3427*** -0.001*** 0 57.0% J siz e, + 0.274*** -0.156** -0.165 10.0% 479.5376** * -0.0008*** 0. 0004 43.8% Lo cal J f r eq 0.177** -1.73 1.833 3.7% 686.3612*** -0.0185 0.0042 45.9% J f r eq ,− 0.004 1.186 1.332 1.2% 595.3123*** -0.0142** 0.0061 34 .7% J f r eq ,+ 0.205*** -2.902 *** 0.766 5.9% 457.8866*** -0.0015 -0. 0019 21.3% J siz e 0.275*** -0.125 0.011 7.7% 608.6433*** -0.0011** -0.0004 57.6% J siz e, − 0.088** 0.099 0.29 1.9% 351.803** -0.0018 *** -0.00 09 40.1% J siz e, + 0.15** -0.19 2 -0.132 3.1% 617.6753*** -0.0009*** 0 48.9% Off-Shore J f r eq 0.12** -15.075*** -5.851 3.6% -36.4452 -0.1312** 0.0517 8.9% J f r eq ,− 0.037 -6.024** -3.558 1.7% -189.5123 -0.062** 0.0138 10. 4% J f r eq ,+ 0.12** -8.991** -2.776 3.6% 72.9318 -0.0719** 0.0376 9.4% J siz e 0.262*** -0.08 -0.175 ** 9.8% 374.1526*** -0.0 008*** 0.0003 43.0% J siz e, − 0.32*** -0.026 -0.152* 12.1% 424.7652*** -0.0008*** 0.0002 43.7% J siz e, + 0.205*** -0.147** -0.18 4* 7.7% 257.9756** -0.0009*** 0.0003 37.8% Note: This table presen ts the regression res u lts of equations (4.6) and (4.7). The sample p erio d is from Ma y 2013 to July 2019 for carry trade p rofitabilit y and Jan uary 2015 to July 2019 for TR Y/JPY net long p ositions. C t and N LP T R Y J P Y t denote altern ativ e carry trade activit y (profitabilit y) measures using US dol lar an d Jap anes e y en resp ectiv ely . The co efficien t estimates of N LP T R Y J P Y t are m ultiplied b y 1000 for impro ving readabilit y . J f r eq and J siz e denote the n um b er of jumps and the a v erage jump size. The ”+” and ”-” signs sho w direction of jumps. New ey-W est standard errors are used. ***, **, and * refers to 1%, 5% and 10% significance lev els.
positions significantly reduces the average jump size in local trading sessions, and both the jump size and intensity in the off-shore trading sessions. In numbers, 100,000 increase in the number of monthly net long futures contracts (that is 1 billion Turkish lira in size) reduces the number of jumps by 13.4 and jump magnitude by 0.09% on average. Similar to the carry-to-risk ratio, significance of the coefficients in off-shore trading sessions are higher suggesting a higher carry trade activity in this period of the day. Furthermore, the magnitude of the coefficients are relatively larger in the case of both size and frequency of positive jumps compared to the negative jumps confirming the previously addressed
asymmetry between positive and negative jumps in the literature by Piccotti (2018) and Kapadia and Zekhnini (2019). Overall, we find that an increase in carry trade positions (proxied by either carry-to-risk ratio or net long positions in TRYJPY futures contracts) is negatively related to the average jump size and intensity.
2.4.3
Robustness Analysis: Generalized Method of Moments
The investigation of the relation between portfolio flows and exchange rate jumps can suffer from simultaneity bias when portfolio outflows (inflows) coincide with exchange rate appreciation (depreciation) episodes. Furthermore, both variables are subject to omitted variable bias as they can be affected by variables like changes in liquidity or risk premium. Likewise, both carry-to-risk ratio and jumps can be strongly related with the changes in volatility risk premium (Cho et al., 2019). For example, Busch et al. (2011) find that implied volatility has a good out-of sample predictive power for the jump components of equity, bond and foreign exchange rate realized volatilities.
To mitigate such potential endogeneity issues, we use Generalized Method of Moments (GMM) estimation procedure in this sub-section. Within this framework, we use the lagged values of the endogenous variables as instrumental variables, and
for each Xt and Jt pair we estimate the following system of structural equations,
∆Xt= φ0+ φ1Jt+ φ2∆Xt−1+ φ3Jt−1+ ut (2.12)
Jt= γ0+ γ1∆Xt+ +γ2∆Xt−1+ γ3Jt−1+ vt (2.13)
where Jt is the 18 different jump variants described earlier and the ∆Xt is the first
differences of weekly (i) equity flows, (ii) bond flows, (iii) total flows, and (iv) carry-to-risk ratio variables. In total, we have 18 × 4 = 72 pairs to be analyzed. Table 2.5 documents the coefficient estimates of the contemporaneous terms of equations (2.12) and (2.13).
Although a broad view of GMM estimation results capture the previously shown negative relationship, some specific cases exhibit slight differences for the individual jump variants. For the equity and bond flows, the differential impact is particularly evident for positive jump frequency in local trading hours. That is, while the weekly net equity inflows significantly increase average jump size, bond flows have the reverse impact. Similarly, equity and bond flows have opposite impacts on the average jump size in off-shore trading session. The total portfolio flows reduce both the average size and frequency of the negative and positive jumps in the local trading sessions.
Similarly, an increase in the carry-to-risk ratio significantly reduces the frequency of both positive and negative jumps, but such an increase has a significantly positive impact on the average jump size. This finding actually is in line with the previous papers by Brunnermeier et al. (2008) and Jurek (2014) who state that carry trade activity leads to infrequent, however larger jumps in exchange rates.