4
Fiscal Policy in Turkey and the
Transitional Economies of Europe
Hikmet Ulugbay and Osman ZaimThis chapter presents a comparative study of public finance issues in the Central and Eastern European (CEE) countries, the Baltic countries and Turkey. Section 4.1 considers fiscal policy and economic restructuring. Section 4.2 looks at tax reform and Section 4.3 analyses expenditure reform.
Privatisation is discussed in Section 4.4, and problems related to social safety
nets and social security are discussed in Section 4.5. The last section presents
some conclusions.
4.1 Fiscal policy and economic restructuring
In socialist economies resource allocation was regulated by a central plan. The planners' task was to determine optimal resource allocation by balancing supply and demand at both the microeconomic and the macroeconomic level. The counterpart of the plan consisted of the state budget, the credit plan, the cash plan and the foreign exchange plan. Given the administratively set prices
and quantities, the financial plan was essentially an accounting exercise. In
socialist countries public finance was entirely passive and subordinate to economic plans. In those economies government actions, as emphasised by Chand and Lorie (1992), were aimed at implementing a development strategy focused on rapid industrialisation and rapid economic growth, the generous provision of public goods and achieving social equity through a comprehen-sive system of social security and welfare provision. Since all pricing and production decisions were made by the state, taxes had a neutral effect on the allocation of resources. The budget was under the control of the government and fiscal balance could be ensured by changing taxes.
Public finance in market economies can be summarised under the following
headings: (1) allocation, (2) distribution and (3) stabilisation. The first involves
the allocation of resources between private and public goods, as well as choosing the desired mix of public goods. The second is related to attaining a more fair income distribution than is the case when market forces are unconstrained. Finally, stabilisation requires the government to help the economy to promote growth and employment and control inflation.
65
S. Togan et al. (eds.), Turkey and Central and Eastern European Countries in Transition © Palgrave Macmillan, a division of Macmillan Publishers Limited 2001
66 Fiscal Policy in Turkey and the Transitional Economies
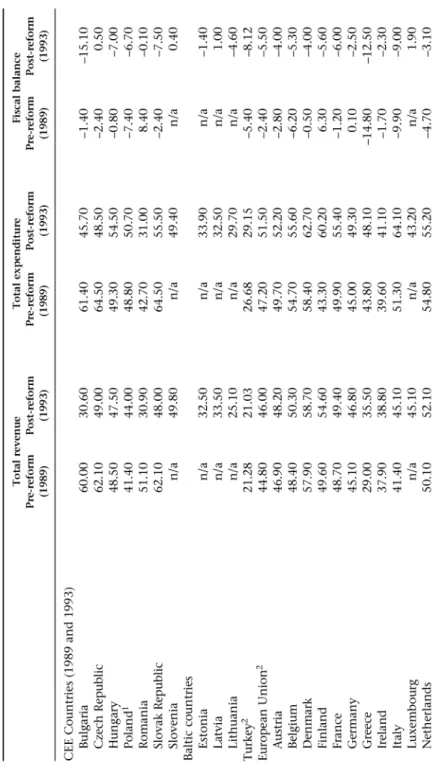
Total revenue and expenditure levels as a percentage of GDP in the CEE and Baltic countries, Turkey and the EU are shown in Table 4.1. The table reveals that prereform revenue and expenditure in the Eastern-bloc countries
amounted to 50-60 per cent of GDP. In market economies such levels have
been reached by only a few industrial countries with large public sectors, such as Sweden and Denmark. The figures for the transition countries are at least
10 per cent higher than for the typical EU countries. In Turkey revenues
account for only 20 per cent and expenditure for 26.6 per cent of GDP. When
the transition process is completed in the Eastern-bloc countries the size of the public sector will probably be, as stressed by Burgess and Stern (1993) and Newberry (1995), much smaller than it is now. According to Slemrod (1995) there is no clear relation between size of government and prosperity, but it could be expected that over time the revenue and expenditure of the transitional economies, as shares of GDP, will reduce and that the shares will increase in the case of Turkey.
The economic reforms considerably affected government revenues, ex-penditure and budget deficits. The reasons for the changes shown in Table 4.1 are as follows.
First, early in the transition process the outputs and profits of enterprises fell sharply, reducing the tax base. In addition, enterprises were allowed to retain a share of profits as an incentive to restructure and innovate. As a result revenues declined. Expenditure on the other hand, seemed to be more resilient to reductions, mainly because of the political difficulties associated with cutting such items as transfers to non-performing enterprises, price subsidies, social expenditure, the public sector wage bill and procurement.
Second, during the pre-reform period state-owned enterprises (SOEs) provided numerous social services to workers and their families. Employees had access through the workplace to old-age, disability and widows' /widowers' pensions, sick pay, maternity benefits and family allowances. The SOEs also provided free holidays at designated resorts, housing, and access to consumer goods at discounted prices. With transition to a market economy all of these functions had to be financed through the government budget. Thus with transition, budgetary expenditures increased.
Third, with the advent of reform the SOEs started to lay off labour due to a contraction in their output. This increased government expenditure on pensions, unemployment benefits, poverty relief and so on.
Fourth, an important proportion of expenditure went on subsidies
-10-15 per cent of GDP in most of the transition countries. These large budgetary allocations were mainly used to subsidise the retail price of consumer goods, energy and heating charges, agricultural input prices, unprofitable production items and exports. However, as a result of budgetary constraints and the desire to expedite the transformation of the economy into a market structure, these subsidies have recently been substantially reduced in size and scope.
Table 4.1 Fiscal balances (as percentage of GOP) Total revenue Total expenditure Fiscal balance Pre-reform Post-reform Pre-reform Post-reform Pre-reform Post-reform (1989) (1993) (1989) (1993) (1989) (1993) CEE Countries (1989 and 1993) Bulgaria 60.00 30.60 61.40 45.70 -1.40 -15.10 Czech Republic 62.10 49.00 64.50 48.50 -2.40 0.50 Hungary 48.50 47.50 49.30 54.50 -0.80 -7.00 Poland 1 41.40 44.00 48.80 50.70 -7.40 -6.70 Romania 51.10 30.90 42.70 31.00 8.40 -0.10 Slovak Republic 62.10 48.00 64.50 55.50 -2.40 -7.50 Slovenia n/a 49.80 n/a 49.40 n/a 0.40 Baltic countries Estonia n/a 32.50 n/a 33.90 n/a -1.40 Latvia n/a 33.50 n/a 32.50 n/a 1.00 Lithuania n/a 25.10 n/a 29.70 n/a -4.60 Turkey 2 21.28 21.03 26.68 29.15 -5.40 -8.12 European Union 2 44.80 46.00 47.20 51.50 -2.40 -5.50 Austria 46.90 48.20 49.70 52.20 -2.80 -4.00 Belgium 48.40 50.30 54.70 55.60 -6.20 -5.30 Denmark 57.90 58.70 58.40 62.70 -0.50 -4.00 Finland 49.60 54.60 43.30 60.20 6.30 -5.60 France 48.70 49.40 49.90 55.40 -1.20 -6.00 Germany 45.10 46.80 45.00 49.30 0.10 -2.50 Greece 29.00 35.50 43.80 48.10 -14.80 -12.50 Ireland 37.90 38.80 39.60 41.10 -1.70 -2.30 Italy 41.40 45.10 51.30 64.10 -9.90 -9.00 Luxembourg n/a 45.10 n/a 43.20 n/a 1.90 Netherlands 50.10 52.10 54.80 55.20 -4.70 -3.10 0\
"
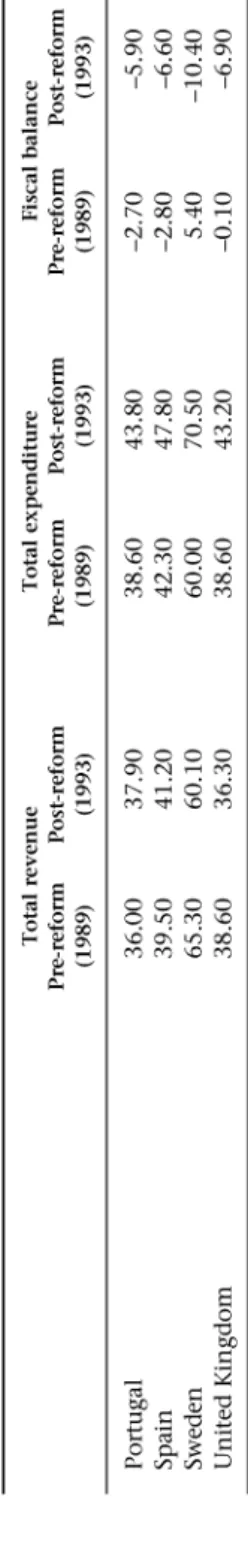
Table 4.1 Fiscal balances (as percentage of GDP) (continued) Total revenue Total expenditure Pre-reform Post-reform Pre-reform Post-reform (1989) (1993) (1989) (1993) Portugal 36.00 37.90 38.60 43.80 Spain 39.50 41.20 42.30 47.80 Sweden 65.30 60.10 60.00 70.50 United Kingdom 38.60 36.30 38.60 43.20 Note: (1) Post-reform data refer to 1992; (2) Post-reform data refer to 1994 Sources: EBRD (1994); Turkish Republic (1996a); Main Economic Indicators Qune 1996); European Economy, no. 60 (1995). Fiscal balance Pre-reform Post-reform (1989) (1993) -2.70 -5.90 -2.80 -6.60 5.40 -10.40 -0.10 -6.90 0\ 00
Hikmet Ulugbay and Osman Zaim 69
Fifth, economic activity used to be concentrated among a small number of large state enterprises, making the collection of taxes easy. With reform the number of enterprises, both private and public, increased. The private enterprises, finding it in their interest to engage in tax evasion, have been able to exploit weaknesses in the taxation of enterprises, and even state enterprises have tried to avoid taxation, leading to revenue losses. Unless the transitional economies reform their tax administration by introducing an effective monitoring system and enforcement procedures they may face further reductions in revenues.
Finally, the growing budget deficits have been financed by borrowing from domestic and external markets. Due to the inadequacy of household savings, internal financial markets have been crowded out and interest rates have surged. This has increased the interest burden on the budgets. The Eastern-bloc countries have used the central bank for deficit financing, which has fed inflation in these countries, along with other factors.
As a result of the developments summarised above, revenues in all the former socialist countries but Poland have declined and expenditure has decreased in all but Hungary and Poland. In Bulgaria, the Czech Republic, Romania and the Slovak Republic there have been sharp decreases in both
revenues and expenditure. By 1993 Bulgaria, Hungary, Poland and the Slovak
Republic had incurred large budget deficits, but the budget deficit figures have to be viewed with caution as some of the SOEs have been subsidised not through the budget but through soft and cheap loans from the banking system. Whereas subsidies granted through the budgeted appropriations increase the budget deficit, cheap loans do not.
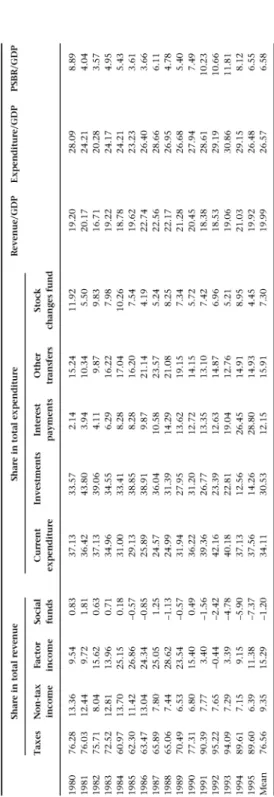
Table 4.2 contains data on revenues and expenditure in Turkey for the
period 1980-95. Fiscal reform was introduced in 1985. The table reveals that,
on average, prior to (after) the fiscal reform of 1985 revenues formed
19.0 (20.6) per cent of GDP, expenditure 24.0 (28.1) per cent of GDP and the
budget deficit 5.1 (7.5) per cent of GDP. Taxes were the main source of
revenue forming about 70.6 per cent 80.1 per cent of total revenues before
and after 1985 respectively. Factor incomes generated by the profits of SOEs
on average constituted 16.8 per cent and 14.4 per cent of total revenues before
and after 1985 respectively. After 1989 the share of factor income in total
revenues declined considerably, from 23.5 per cent in 1989 to -0.4 per cent in
1992, mainly as a result of the government's refusal to increase the prices of products produced by SOEs in an inflationary environment. On the expenditure side, current expenditure and investments constituted, on
average, 34.3 (34.0) per cent and 37.2 (26.5) per cent of total expenditure
before (after) 1985. Over the entire period the public sector borrowing
requirement (PSBR) remained positive. The PSBR/GDP ratio increased sharply
after 1989, reaching 11.8 per cent in 1993.
As a consequence of this growing public sector deficit, Turkey faced a
'-J 0 Table 4.2 Structure of revenues, expenditure and the public sector borrowing requirement in Turkey, 1980-95 (per cent) Share in total revenue Share in total expenditure Revenue/GDP Expenditure/GDP PSBR/GDP Taxes Non-tax Factor Social Current Investments Interest Other Stock income income funds expenditure payments transfers changes fund 19HO 76.2H J:U6 9.54 0.83 37.13 :n.57 2.14 15.24 11.92 19.20 2H.09 H.89 1981 76.03 12.44 9.72 1.81 36.42 43.80 3.94 10.34 5.50 20.17 24.21 4.04 1982 75.71 8.04 15.62 0.63 37.13 39.06 4.11 9.87 9.83 16.71 20.28 3.57 19Kl 72.52 12.Hl 13.96 0.71 34.96 34.55 6.29 16.22 7.9H 19.22 24.17 4.95 19H4 60.97 13.70 25.15 0.18 :n.oo :n.41 8.2H 17.04 10.26 18.7H 24.21 5.43 19H5 62.30 11.42 26.86 -0.57 29.13 38.85 8.2H 16.20 7.54 19.62 23.23 3.61 1986 63.47 13.04 24.34 -0.85 25.89 38.91 9.87 21.14 4.19 22.74 26.40 3.66 19H7 65.H9 7.80 25.05 1.25 24.57 36.04 10.58 23.57 5.24 22.56 2H.66 6.11 19HH 65.06 7.44 2H.62 -1.13 24.99 31.39 14.29 21.0H H.25 22.17 26.95 4.78 19H9 70.49 6.53 23.54 -0.57 :n.94 27.95 13.62 19.15 7.34 21.2H 26.68 5.40 1990 77.31 6.80 15.40 0.49 36.22 31.20 12.72 14.15 5.72 20.45 27.94 7.49 1991 90.39 7.77 3.40 -1.56 39.36 26.77 13.35 13.10 7.42 18.38 28.61 10.23 1992 95.22 7.65 -0.44 -2.42 42.16 23.39 12.63 14.87 6.96 18.53 29.19 10.66 1993 94.09 7.29 3.39 -4.78 40.18 22.81 19.04 12.76 5.21 19.06 30.H6 !!.HI 1994 89.61 7.15 9.15 -5.90 37.13 12.56 26.45 14.91 8.95 21.03 29.15 8.12 1995 89.60 6.39 11.38 -7.37 37.56 14.26 28.80 14.93 4.45 19.92 26.48 6.55 Mean 76.56 9.35 15.29 -1.20 34.11 30.53 12.15 15.91 7.30 19.99 26.57 6.58 Sources: Turkish Republic (1996a); Main Economic Indicators Qune 1996).
Hikmet Ulugbay and Osman Zaim 71
concluded a stand-by agreement with the IMF in July 1994. According to the
latter agreement, Turkey would reduce its PSBR and the consolidated budget deficit to more sustainable levels. The growing PSBR/GDP ratio caused crowding out in financial markets and led to very high real interest rates on
lending. It also caused a rapid surge in external borrowing. The reduction in
the PSBR/GDP ratio in 1994-95 was achieved mainly by reducing real
government investment expenditure and the real value of government expenditure on wages and salaries. Finally it should be emphasised that a
Table 4.3 Seigniorage and inflation tax, 1994-95 (percentage averages) Seigniorage
(percentage
of Inflation tax
Inflation GOP) (percentage of GOP)
CEE Countries Bulgaria 79.15 5.51 8.11 Czech Republic 9.57 0.01 0.00 Hungary 23.53 4.66 5.22 Poland 30.50 2.35 2.17 Romania 84.50 3.33 3.56 Slovak Republic 11.70 4.11 1.18 Slovenia 16.20 1.29 0.52 Baltic countries Estonia 38.29 1.70 4.62 Latvia 30.45 1.22 3.48 Lithuania 53.50 6.84 2.84 Turkey 99.95 3.48 3.52 European Union Austria 2.61 0.16 0.24 Belgium 1.92 0.01 0.14 Denmark 2.01 0.46 0.13 Finland 1.00 1.99 0.09 France 1.70 0.16 0.06 Germany 2.38 0.01 0.25 Greece 10.10 2.40 1.22 Ireland 2.43 1.05 0.17 Italy 4.65 -0.32 0.25 Luxembourg 2.07 -0.08 0.03 Netherlands 2.35 -0.30 0.22 Portugal 4.49 -7.07 0.77 Spain 4.71 0.86 0.57 Sweden 2.37 0.29 0.27 United Kingdom 2.96 0.22 0.11
Note: Seigniorage and inflation tax are respectively defined as [MJ and (rr1 M1-J), where M1 denotes reserve money and rr1 the rate of inflation during period t.
72 Fiscal Policy in Turkey and the Transitional Economies
large part of the budget deficit in Turkey has always been financed by the central bank, which has fed the inflationary tendencies in the economy. In recent years, central bank deficit financing has been around 36 per cent.
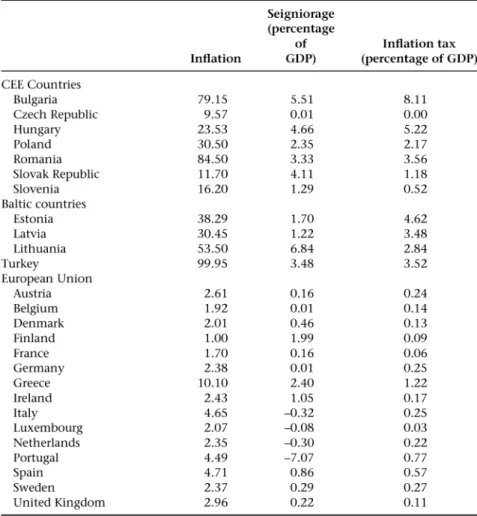
Table 4.3 presents data on seigniorage and inflation tax for the CEE and Baltic countries, Turkey and the EU. The table shows considerable differences across countries in the use of seigniorage and inflation tax. In recent years inflation tax has been a negligible source of revenue in all EU countries except Greece. In the period 1994-95 inflation tax was highest in Bulgaria, at 8 per cent of GDP, followed by Hungary at 5.2 per cent. Inflation tax was also considerable in Turkey, amounting to 3.5 per cent of GDP.
The growing budget deficits in the CEE and Baltic countries and Turkey have induced a rapid surge in the debt stocks of these countries, which have tried to finance the growing budget deficits by domestic and external borrowing. The transition countries, after concluding stand-by agreements with the IMF, considerably reduced their dependence on central bank funds for deficit financing. Furthermore some of them refrained completely from using that funding, as shown by the seigniorage figures in Table 4.3. All the countries in question have also borrowed heavily from domestic markets for budget deficit financing, and some have even used the interbank market to channel deposits
for the purchase of government debentures. It should be emphasised that
since the second half of the 1980s, by law commercial banks in Turkey have, had to place 30 per cent of their deposits in government debentures. Recently the ratio has been reduced considerably.
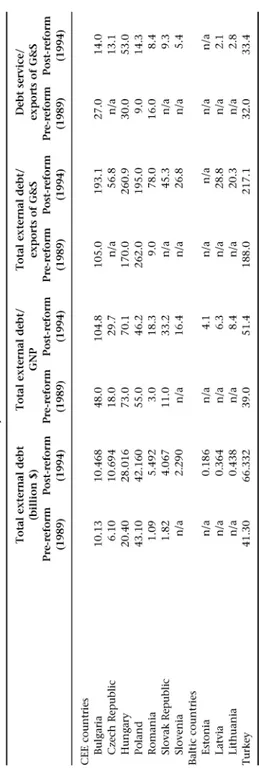
For budget deficit financing, the transition countries and Turkey have, besides domestic borrowing, resorted to foreign borrowing, and SOEs and the banking sector have also been allowed to borrow from abroad. Table 4.4 shows the external debt of the countries under consideration for the period 1989-94. The table reveals that after the reforms the total external debt of all the transition countries increased. After 1992 Poland and Bulgaria benefited from the debt reduction and rescheduling of the Paris and London Clubs and their external debt almost halved. Bulgaria's external debt had surpassed the GNP level by 1994, and in the same year foreign debt exceeded export earnings in Hungary, Turkey, Poland and Bulgaria. Debt service payments reached half of export earnings in Hungary and one third of export earnings in Turkey. Turkey's external debt was high by international standards and it grew even higher in 1995, reaching 73.3 billion. Turkey faced a credit rating decline in late 1993 and a balance of payments crisis in early 1994.
It is evident from the above that if the transition countries and Turkey do
not increase their tax effectiveness and fail to carry out the necessary expenditure reforms, the volume of both domestic and external debts will continue to grow and debt problems will serve as a destabilising force in the respective economies.
Table 4.4 External debt of the transition countries and Turkey, 1989 and 1994 Total external debt Total external debt/ (billion$) GNP Pre-reform Post-reform Pre-reform Post-reform (1989) (1994) (1989) (1994) CEE countries Bulgaria 10.13 10.468 48.0 104.8 Czech Republic 6.10 10.694 18.0 29.7 Hungary 20.40 28.016 73.0 70.1 Poland 43.10 42.160 55.0 46.2 Romania 1.09 5.492 3.0 18.3 Slovak Republic 1.82 4.067 11.0 33.2 Slovenia n/a 2.290 n/a 16.4 Baltic countries Estonia n/a 0.186 n/a 4.1 Latvia n/a 0.364 n/a 6.3 Lithuania n/a 0.438 n/a 8.4 Turkey 41.30 66.332 39.0 51.4 Source: World Bank (1995b). Total external debt/ exports of G&S Pre-reform Post-reform (1989) (1994) 105.0 193.1 n/a 56.8 170.0 260.9 262.0 195.0 9.0 78.0 n/a 45.3 n/a 26.8 n/a n/a n/a 28.8 n/a 20.3 188.0 217.1 Debt service/ exports of G&S Pre-reform Post-reform (1989) (1994) 27.0 14.0 n/a 13.1 30.0 53.0 9.0 14.3 16.0 8.4 n/a 9.3 n/a 5.4 n/a n/a n/a 2.1 n/a 2.8 32.0 33.4 ..., w
7 4 Fiscal Policy in Turkey and the Transitional Economies
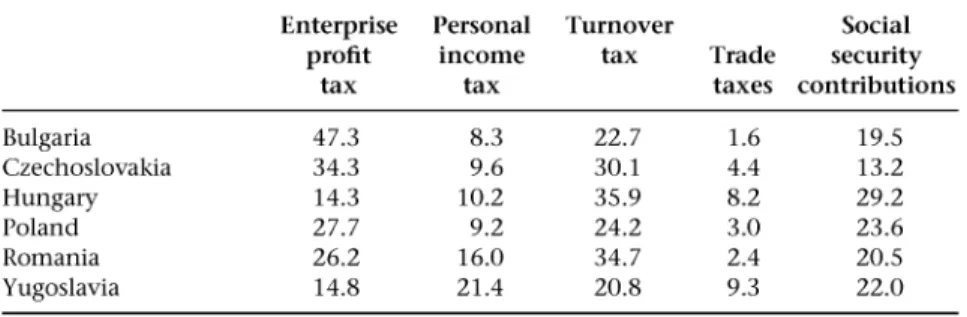
Table 4.5 Composition of tax revenue in Central and Eastern Europe, 1989 (percentage of total tax revenue)
Enterprise Personal Turnover Social
profit income tax Trade security
tax tax taxes contributions
Bulgaria 47.3 8.3 22.7 1.6 19.5 Czechoslovakia 34.3 9.6 30.1 4.4 13.2 Hungary 14.3 10.2 35.9 8.2 29.2 Poland 27.7 9.2 24.2 3.0 23.6 Romania 26.2 16.0 34.7 2.4 20.5 Yugoslavia 14.8 21.4 20.8 9.3 22.0
Source: Gandi and Mihaljek (1992).
4.2 Tax reforms
Taxation was essential for the former socialist economies. Table 4.5 shows the sources of tax revenue in these countries for 1989 and reveals the dominance of enterprise profits and turnover tax. As noted by Gandhi and Mihaljek (1992), during the pre-reform period governments set, the producer prices of goods and services with a mark-up over money wages and other costs. The mark-up determined enterprises' economic surplus, which was deposited with the state bank and helped finance the government budget. Thus during the prereform period the state bank performed the function of a tax collection agency. As the state was both tax collector and taxpayer, profit tax payments
were often negotiated and determined ex-post at levels consistent with the
planned allocation of resources between enterprises and industries in the public sector. On the other hand, turnover taxes were defined as the difference between administratively set wholesale and retail prices. As a result the number of turnover tax rates was as large as the number of commodities.
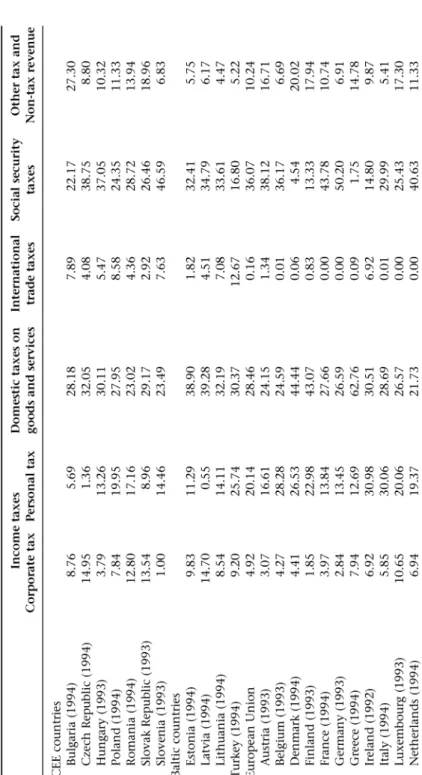
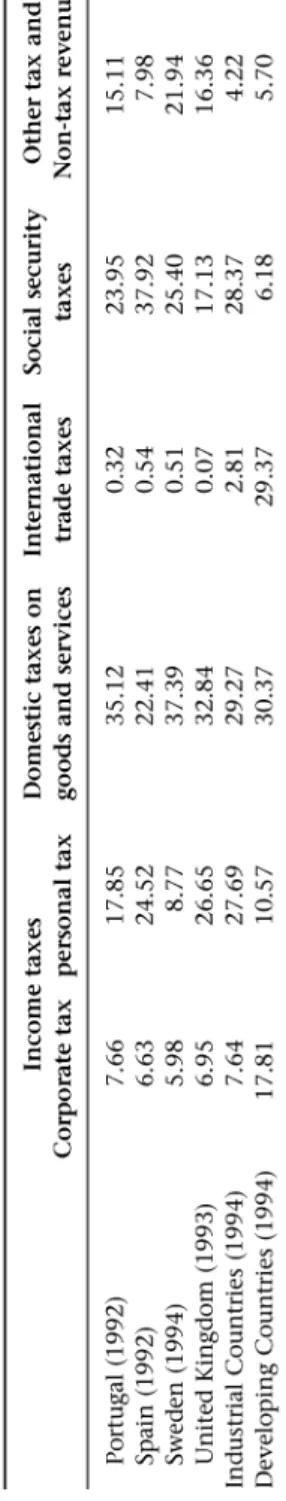
During the pre-reform period there was no possibility of tax evasion. Taxation was merely a transfer of funds from enterprises' accounts to the state bank. With the introduction of the reforms the old administrative arrange-ments for tax collection broke down. Firms wishing to conceal their profits were able to do so and were therefore able to keep down their tax liabilities. Furthermore, the enterprise tax was replaced by corporate income tax, which required property rights to be restructured. The earnings of state enterprises had to be distinguished from those of the Treasury. Finally, with the transition to a market economy the turnover tax was replaced by value added tax (VAT). Table 4.6 shows the composition of tax revenue in the transitional economies, Turkey, the EU and industrial and developing countries. The table reveals that the EU countries obtain a large percentage of their tax revenue from social security taxes, domestic taxes on goods and services such as value added tax, and from personal income tax. International trade taxes
Table 4.6 Tax structure in the CEE countries, the Baltic countries, Turkey and the EU Income taxes Domestic taxes on International Social security Other tax and Corporate tax Personal tax goods and services trade taxes taxes Non-tax revenue CEE countries Bulgaria (1994) 8.76 5.69 28.18 7.89 22.17 27.30 Czech Republic (1994) 14.95 1.36 32.05 4.08 38.75 8.80 Hungary (1993) 3.79 13.26 30.11 5.47 37.05 10.32 Poland (1994) 7.84 19.95 27.95 8.58 24.35 11.33 Romania (1994) 12.80 17.16 23.02 4.36 28.72 13.94 Slovak Republic (1993) 13.54 8.96 29.17 2.92 26.46 18.96 Slovenia (1993) 1.00 14.46 23.49 7.63 46.59 6.83 Baltic countries Estonia (1994) 9.83 11.29 38.90 1.82 32.41 5.75 Latvia (1994) 14.70 0.55 39.28 4.51 34.79 6.17 Lithuania (1994) 8.54 14.11 32.19 7.08 33.61 4.47 Turkey (1994) 9.20 25.74 30.37 12.67 16.80 5.22 European Union 4.92 20.14 28.46 0.16 36.07 10.24 Austria (1993) 3.07 16.61 24.15 1.34 38.12 16.71 Belgium (1993) 4.27 28.28 24.59 0.01 36.17 6.69 Denmark (1994) 4.41 26.53 44.44 0.06 4.54 20.02 Finland (1993) 1.85 22.98 43.07 0.83 13.33 17.94 France (1994) 3.97 13.84 27.66 0.00 43.78 10.74 Germany (1993) 2.84 13.45 26.59 0.00 50.20 6.91 Greece (1994) 7.94 12.69 62.76 0.09 1.75 14.78 Ireland (1992) 6.92 30.98 30.51 6.92 14.80 9.87 Italy (1994) 5.85 30.06 28.69 0.01 29.99 5.41 Luxembourg (1993) 10.65 20.06 26.57 0.00 25.43 17.30 Netherlands (1994) 6.94 19.37 21.73 0.00 40.63 11.33
"
u,Table 4.6 Tax structure in the CEE countries, the Baltic countries, Turkey and the EU (continued)
"
0\ Income taxes Domestic taxes on International Social security Other tax and Corporate tax personal tax goods and services trade taxes taxes Non-tax revenue Portugal (1992) 7.66 17.85 35.12 0.32 23.95 15.11 Spain (1992) 6.63 24.52 22.41 0.54 37.92 7.98 Sweden (1994) 5.98 8.77 37.39 0.51 25.40 21.94 United Kingdom (1993) 6.95 26.65 32.84 0.07 17.13 16.36 Industrial Countries (1994) 7.64 27.69 29.27 2.81 28.37 4.22 Developing Countries (1994) 17.81 10.57 30.37 29.37 6.18 5.70 Sources: IMF (1995); EBRD (1994); Turkish Republic (1996a); Treasury Monthly Statistics (May-June 1996); Burgess and Stern (1993).Hikmet Ulugbay and Osman Zaim 77 form only 0.16 per cent of tax revenue. The same is true for industrial countries. In the transitional economies the bulk of tax revenue comes from social security taxes and domestic indirect taxes. The shares of personal income tax and international trade taxes are relatively low. In Turkey, on the other hand, domestic indirect taxes constitute 30.4 per cent and personal income tax 25.74 per cent of tax revenue. The share of social security contributions is 16.8 per cent and that of international trade taxes 12.67 per cent. The share of corporate income taxes in total tax revenue in Turkey is relatively high compared with those in the EU and industrial countries, but low relative to those in developing countries. As emphasised by Burgess and Stern (1993), large corporations in developing countries are an attractive target for taxation.
Tables 4.5 and 4.6 reveal that the tax structures of the transitional economies shifted after the economic reforms toward, less dependence on income and other taxes levied on enterprises and greater dependence on foreign trade taxes. In this respect the transitional economies are moving towards the Turkish tax structure. With the introduction of market-oriented reforms, the transitional economies are replacing turnover tax with VAT and profit taxes and transfers with corporate income taxes with simple rate structures. The introduction of a comprehensive system of personal income tax may take quite a while, but initial steps have been taken. At present, agriculture is exempt from profit taxes and foreign investors continue to enjoy preferential tax rates. The base rates are often very high, and as a result those transitional economies with weak tax administrations encourage tax evasion. Finally, the many tax exemptions coexist with high tax rates on the private sector and this variation in treatment complicates tax administration and distorts resource allocation.
The above considerations reveal that the transitional economies and Turkey have to decide on an appropriate balance between direct and indirect taxation, the degree of progression of the direct tax system, and the degree of coverage and differentiation of VAT and excise taxes. There are no commonly agreed models for these but it is probable that countries wishing to join the EU will, over time, adopt the EU taxation system.
In the transitional economies, tax administration still operates mainly
according to earlier set-ups. It is organised according to the type of taxpayer or
type of tax. However, a more efficient tax administration structure should be based on functions such as collection, auditing and appeals. In addition the tax administration bureaus of these countries have a three-layer geographical hierarchy, that is, main headquarters, regional and local offices. In certain transition countries the local tax administrators collect both local and central government taxes. In others the central government agency controls all tax personnel, who collect all taxes. At the beginning of the 1990s, the tax administration bureaus in the transition countries had full control over the SOEs' tax accounts. However, with the growth of the private sector the
78 Fiscal Policy in Turkey and the Transitional Economies
number of small and medium-size business establishments will increase, which will reduce auditing effectiveness and require changes in auditing methods and techniques. The growing private sector demand for skilled tax experts, which will be met to a large extent by personnel from the tax administration bureaus, will weaken official auditing and, as a result, collection. In most of the transition countries the penalty for non-payment of tax is lagging behind the market interest rates which may adversely affect tax revenues. The right to appeal in taxation matters is a new concept in all the transition countries and the creation of an effective tax appeal mechanism is an urgent requirement. In summary, the transition countries, as emphasised
by de Jantscher et al. (1992), will have to restructure their fiscal
administra-tions in a way that suits market condiadministra-tions. Two important changes are required. First, the arbitrary and negotiable tax structures should be replaced by a more uniform, rules-based system. Second, the tax system should be designed to minimise demands on the limited administrative resources available. Turkey has had a market-oriented tax structure since 1949, including personal income tax (PIT) and corporate income tax (CIT). A major adjustment was made to PIT in 1960 and minor improvements and amendments have been made to PIT and CIT since then. The most recent adjustments were made in late 1993 and early 1994.
Tax reform in Czechoslovakia started in 1990. Interim reforms were carried out as a preparatory step towards the 1993 tax reform, which sought to create a tax system similar to those in the EU economies. The turnover tax was replaced by VAT and major changes were made to corporate and personal income tax. During the first two years of the reform the Czechoslovak government abolished retail price subsidies. Negative turnover taxes on foodstuffs were removed and this was later extended to non-food products. The basic number of turnover tax rates was reduced to four: zero, 12 per cent, 22 per cent and 32 per cent, with some higher rates applying to alcohol and tobacco. The interim reform, as noted by Heady and Smith (1995), extended the liability for turnover taxes to the newly legalised private sector and the new tax law imposed PIT on private non-wage income. The taxes included in the 1992 tax reform follow the broad outline of Western practice. VAT has been levied at the standard rate of 23 per cent in the Czech Republic and 25 per cent in the Slovak Republic, with a reduced rate of 5 per cent in the Czech Republic and 6 per cent in the Slovak Republic, applied to basic food items, medicines, fuel, books and services such as repairs. In addition, excise duties have been levied on alcohol, tobacco and mineral products. PIT was introduced as a progressive tax. The tax base includes employment and self-employment income, rental, interest and dividend income. A progressive structure of marginal tax rates applies to most categories of income, beginning at 15 per cent on taxable income up to 60 000 crowns per annum and rising to a maximum of 47 per cent. Dividends are taxed at 25 per cent. A corporate profit tax (CPT), based on legislation closely conforming to legislation in the
Hikmet Ulugbay and Osman Zaim 79
EU countries, is levied at the rate of 45 per cent. The 1992 tax reform also included payroll-based social insurance levies, paid partly by employees and partly by employers for pensions, sickness benefit and unemployment insurance.
Tax reforms in the transition countries were typically introduced in two stages. In the first stage, the aspects of the tax system that caused the most serious distortions were corrected by introducing market-oriented taxes such as corporate profit tax and personal income tax. During this stage, the number of turnover taxes were significantly reduced and non-tariff barriers were replaced by ad valorem import duties. In the second stage, efforts were typically concentrated on introducing a uniform rate of VAT and modifying income taxes so as to broaden the tax base and simplify the tax administration. These reforms are expected to enhance the efficiency of the tax system in the long run, but in the short term they may have contributed to the drop in tax revenues.
Compared with general government receipts of over 35 per cent in the EU countries, tax receipts in Turkey during 1995 amounted to net 18 per cent of GDP, indicating the country's relatively poor tax-collecting capacity. Since a substantial part of the informal economy effectively avoids tax, the tax rates on the formal economy are comparatively high. Table 4. 7 shows the major features of the Turkish PIT schedule in 1990- number of brackets, level of the first positive rate, level of the top rate- and compare them with those of the EU countries. The table reveals that Turkey has fewer brackets than Greece and
Table 4.7 Major features of the personal income tax system in Turkey and the EU
countries, 1990
Number of
non-zero First positive rate
brackets Top rate (per cent) Rate spread Average rate
Turkey 6 50 25 25 22.5 European Union Austria 5 50 10 40 3.0 Belgium 7 55 25 30/55 10.8 Denmark 3 40 22 18 35.6 Finland 6 43 9 34/43 23.7 France 12 57 5 52/57 Germany 0 19 34 9.2 Greece 9 50 18 32 3.7 Ireland 3 53 30 23 17.0 Italy 7 50 10 40 14.8 Luxemburg 24 56 10 46/56 Netherlands 3 60 7 53 9.1 Portugal Spain 16 56 25 31/56 6.8 Sweden 1 20 20 0/20 35.7 United Kingdom 2 40 25 15 15.6 Source: OECD (1992).
80 Fiscal Policy in Turkey and the Transitional Economies
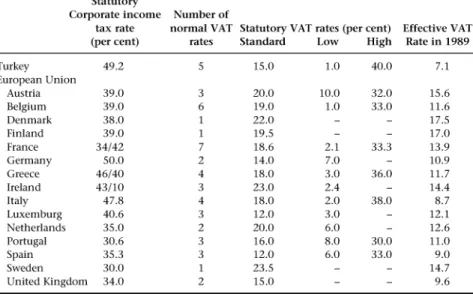
Table 4.8 Major features of corporate tax and the VAT systems in Turkey and the EU countries, 1990
Statutory
Corporate income Number of
tax rate normal VAT Statutory VAT rates (per cent) Effective VAT
(per cent) rates Standard Low High Rate in 1989
Turkey 49.2 5 15.0 1.0 40.0 7.1 European Union Austria 39.0 3 20.0 10.0 32.0 15.6 Belgium 39.0 6 19.0 1.0 33.0 11.6 Denmark 38.0 22.0 17.5 Finland 39.0 19.5 17.0 France 34/42 7 18.6 2.1 33.3 13.9 Germany 50.0 2 14.0 7.0 10.9 Greece 46/40 4 18.0 3.0 36.0 11.7 Ireland 43/10 3 23.0 2.4 14.4 Italy 47.8 4 18.0 2.0 38.0 8.7 Luxemburg 40.6 3 12.0 3.0 12.1 Netherlands 35.0 2 20.0 6.0 12.6 Portugal 30.6 3 16.0 8.0 30.0 11.0 Spain 35.3 3 12.0 6.0 33.0 9.0 Sweden 30.0 23.5 14.7 United Kingdom 34.0 2 15.0 9.6 Source: OECD (1992).
Spain but more than Ireland, the United Kingdom and Sweden. The first positive rate of the Turkish schedule is far higher than those in the EU and the Turkish top rate is also very high. (Extensive reliance on lump-sum assessments for lower income levels has facilitated tax evasion in Turkey.) Table 4.8 compares the CIT rates and VAT systems in Turkey with those in the EU countries. The table reveals that the corporate tax rate in Turkey is relatively high compared with most EU countries. However, owing to various exemptions the effective corporate tax rate is relatively low. The Turkish VAT system was introduced in 1985. The standard rate, shown in Table 4.8, is rather low by international standards. There are five VAT rates in Turkey, ranging from 1-40 per cent. The multiplicity of VAT rates complicates the adminis-tration of VAT and encourages tax evasion, and the relatively low effective tax rate indicates that there is room for base broadening.
Tax auditing in Turkey was institutionalised in 1945 with the creation of a special board of tax auditors within the Ministry of Finance, and tax administration was automated in the 1980s. The main trust of the Turkish tax laws was comparable with that of the European tax laws. The Turkish tax system was, however, weakened by the scope for unrecorded transactions and the wide range of tax exemptions and exclusions. In order to improve the tax base, Turkey introduced new measures in the early 1980s. The introduction of VAT in 1984 helped to broaden the tax base. In addition the use of cash
Hikmet Ulugbay and Osman Zaim 81
registers became compulsory for all businesses. The other measure to broaden the tax base was the adoption of a tax return system. All income tax payers now have to file a tax return and furnish their purchase slips and invoices. Another important measure, aimed at reducing tax evasion, was to grant authority to the Ministry of Finance to contract with selected printing houses in the major cities for the printing of invoices for business use. A more recent measure to improve tax management was the assignment of individual numbers to taxpayers, which are used in all tax-related transactions throughout the country. The complexity of the tax system and the lack of computerisation still cause problems for the tax administrators, but the above developments show that the infrastructure of the Turkish tax system and administration is already very firmly established along the lines of a modem market-oriented model.
4.3 Expenditure reforms
The pre- and post-reform expenditure structures in the transitional economies are shown in Table 4.9. On average expenditure was about 55 per cent of GDP in the pre-reform period, with 64.5 per cent in Czechoslovakia and 61.4 per cent in Bulgaria. Subsidies amounted to 16.6 per cent of GDP in Czechoslovakia and 15.5 per cent in Bulgaria. During this period subsidies were effected mainly through low producer prices, through products imported at overvalued exchange rates and through artificially low interest rates. The table also shows the importance that the transitional economies attach to social security and housing- in 1989 expenditure on these programmes amounted to 15.8 per cent of GDP in Hungary and 13.2 per cent in Czechoslovakia. On the other hand the share of the wage bill appears to be relatively low.
Market-oriented reform has compelled the governments of the transitional economies to reduce their activities by shifting functions to the private sector, but also to assume new responsibilities. Subsidies on energy, housing, food and enterprises have also fallen as a result of efforts to deregulate prices. However, social outlays, consisting of social security and social service expenditure, have remained relatively buoyant. With the crumbling of the pre-transition social security system, the state has taken responsibility for unemployment insurance and social service provision. Thus the transitional economies, in an attempt to build up a social consensus for the reforms by maintaining spending to protect living standards and to provide key services and infrastructure, face difficulties in cutting expenditure. Finally, public investment has fallen sharply in these economies, often to less than 3 per cent of GDP.
The observed changes in the pattern of budget expenditure have been partially the result of intended policy alterations and partially the unavoidable consequences of the transformation process. The decline in subsidies was the product of a policy change. However, the decline in capital expenditure was a
Table 4.9 Expenditure structure in the transition economies (percentage of GOP) Goods and services Total expenditure Investment wages and salaries Subsidies Social outlays Pre-reform Post-reform Pre-reform Post-reform Pre-reform Post-reform Pre-reform Post-reform Pre-reform Post-reform C:EE countries ( 19H9 and 1993) Bulgaria 61.4 45.7 3.0 1.5 19.0 11.7 15.5 3.9 10.4 12.9 Czech Republic 64.5 48.5 8.9 3.6 14.9 26.0 16.6 13.2 14.6 Hungary 49.3 54.5 2.2 0.9 14.9 20.2 10.7 :u 15.H 22.5 Poland ( 19H9 and 1992) 4H.H 50.7 :u 1.5 7.6 10.7 12.9 :u 2.4 6.3 Romania 42.7 31.0 17.6 3.9 9.8 11.4 0.4 5.5 9.5 8.9 Slovak Republic 64.5 55.5 8.9 0.1 14.9 4.7 16.6 4.8 13.2 17.0 Slovenia n/a 49.4 2.2 7.5 4.1 30.5 Baltic countries (1991 and 1993) Estonia 31.8 33.9 3.4 2.0 15.5 19.5 2.5 1.3 10.4 8.8 Latvia 31.0 32.5 3.0 1.1 10.2 12.1 0.0 0.2 11.4 13.0 Lithuania (19H9 and 1993) 53.H 29.7 4.9 2.6 4.6 6.7 17.2 1.4 20.5 14.4 Source: EBRD (1994). Other Pre-reform Post-reform 13.5 15.7 10.9 4.3 5.7 7.H 22.6 2H.9 5.4 1.3 10.9 28.9 5.1 0.0 2.3 6.4 6.1 6.6 4.6 00 N
Hikmet Ulugbay and Osman Zaim 83
combined result of intended reductions in investment in SOEs, privatisation and a fall in public revenues. The rapid rise in transfers to social security agencies was the unavoidable consequence of the large increase in unemploy-ment caused by the transformation process. The rising ratio of interest payments, shown by the increase in other expenditures in Table 4.9 was also the result of the transformation process. The sharp decline in revenues could not be balanced with an equal reduction in expenditure. A natural consequence of this was, as emphasised above, rapid growth in domestic and external debt. Continuing economic and political restructuring will definitely lead to further changes in the composition of public expenditure in the coming years. Continuation of the fall in capital expenditure may lead to serious deterioration in health and educational facilities and key infrastructur-al assets such as highways, ports and so on. In the long term, the level of government expenditure will have to depend on the countries' capacity to finance that expenditure and on the demand for social services. Therefore, it will depend on their ability to raise taxes and on the role the state will play in the economy.
Table 4.10 shows the structure of expenditure in Turkey and the EU in 1994. Investment expenditure comprised 3.7 per cent and 2.7 per cent of GDP in Turkey and the EU respectively. The share of goods and services and compensation of employees in GDP amounted to 10.8 per cent in Turkey and 18.7 per cent in the EU, and interest payments comprised 7.7 per cent of GDP in Turkey and 5.3 per cent in the EU.
Referring back to Table 4.2, expenditure on personnel during the late 1980s and the beginning ofthe 1990s, plus interest payments after 1987, contributed to the rapid surge in government expenditure. Turkish budgets have continued to be dominated by these two expenditure items. The deteriorating financial circumstances of the social security agencies shown in column four of Table 4.2 under social funds, are putting increased pressure on the budget. Another important drain on the budget has been transfers to SOEs. Investment outlays declined continuously in the latter half of the 1980s and during the 1990s. The share of investment in total expenditure fell from 38.9 per cent in 1986 to 12.6 per cent in 1994. The Turkish economy is in as much need of reform on the expenditure side as it is on the revenue side in order to redress the fall in spending on education, health and infrastructure. Furthermore, the ever increasing budget deficit has crowded out the financial markets and adversely affected private investment.
The government wage bill more than doubled in real terms between 1988 and 1993, to reach 12 per cent of GNP. The number of civil servants increased from 1.2 million in 1980 to more than 1.8 million in 1994, and real wages increased considerably after 1988. However, after the 1994 crisis civil servants' salaries were reduced significantly in real terms. Turkey is in need of a comprehensive civil service reform that will improve the quality of public administration.
00 *'" Table 4.10 Structure of expenditure in Turkey and the EU countries, 1994 (percentage of GOP) Goods and services Final capital and compensation Other expenditure of employees Interest payments transfers Other Turkey 3.66 10.82 7.71 4.35 2.61 European Union 2.69 18.69 5.33 18.26 6.55 Austria 1.62 14.95 10.31 17.87 10.87 Belgium 2.07 24.26 7.12 20.31 8.98 Denmark 2.67 18.55 3.44 19.31 5.34 Finland 2.98 13.81 14.74 1.78 14.73 France 3.78 15.80 5.21 16.24 6.77 Germany 3.42 19.55 3.76 24.46 4.20 Greece 2.41 15.21 5.82 11.11 6.48 Ireland 2.32 16.57 10.70 12.10 12.35 Italy 6.42 15.84 0.51 27.80 2.19 Luxemburg 2.39 13.54 6.05 25.61 7.59 Netherlands 2.96 19.04 4.19 20.34 5.70 Portugal 4.40 17.69 5.77 10.42 5.15 Spain 2.71 22.39 5.08 24.92 5.09 Sweden 3.03 27.26 6.87 26.33 6.99 United Kingdom 1.73 21.72 3.36 12.43 4.14 Sources: Turkish Republic, Main Economic Indicators Qune 1996); 'European Economy' no. 60 (1995).
Hikmet Ulugbay and Osman Zaim 85
Table 4.11 Subsidies in Turkey (percentage of GDP)
Export incentives Investment incentives Agricultural transfers
Source: World Bank (1995a).
1989-91 1.7 1.4 3.0 1992 1.4 1.1 2.7 1993 1.2 1.0 2.3 1994 1.2 1.0 1.7
Table 4.11 shows subsidies in Turkey as a percentage of GDP. Export and investment incentives, provided in the form of decreased or deferred tax obligations, concessional credits and direct cash subsidies, absorb a substantial share of government spending. Agricultural support (output price support, subsidies for the capital and operating costs of SOEs taking part in the price support programmes, input price subsidies and concessional credits for farmers) amounted to 2.3 per cent of GDP in 1993.
Finally, with regard to expenditure on debt-service payments, limited access to the international capital markets since April1994 and a reduction in central bank financing have led to greater dependence on domestic borrowing to finance public deficits. Lenders have demanded very large risk premia as
inflation has been very volatile. While the ex post real returns have increased to
30-45 per cent a year, the average maturity of domestic debt has shortened. The above considerations reveal that the transitional economies and Turkey share common policy issues. They have to determine, as emphasised by Chu and Holzmann (1992), the speed at which to establish private property rights, create a competitive climate, eliminate price distortions and transfer state production of private or semiprivate goods to the private sector. They have to improve their infrastructure to pave the way for efficient private investment, and they must reform their social security systems. In addition, Turkey has to enhance its human capital as a basis for sustained economic growth. Finally, it should be emphasised that Turkey and the transitional economies have to take the necessary administrative measures to create competent budget offices, well-functioning treasuries and independent central banks. The central banks will have to focus on monetary policy, and the budget offices and treasuries on fiscal policy and debt management.
4.4 Privatisation
In market economies resources are allocated through the invisible hand of the price system, which transmits to consumers, workers and producers, information on relative scarcities, preferences, comparative advantage and technology. Economists, when tackling the intricacies of market interactions, take it for granted that everything of value has an owner and that the owner has the right to control the use of resources. When considering the efficiency of resource allocation, economists assume that property rights are a basic right
86 Fiscal Policy in Turkey and the Transitional Economies
of the individual and that the resource allocation decisions of society are generated by the pursuit of individual self-interest. In the private economy self-interest is formalised as the maximisation of profits by producers and the maximisation of utility by consumers. Economists assume that this society of greedy, self-seeking people is constrained only by criminal law and the law of property and contract. In such an economy the government is essential as a forum for determining the rules of the game and as the enforcer of the rules decided upon. In such an economy resources are efficiently allocated as long as property rights are properly defined, market participants are able freely to exchange property rights through a system of legally enforceable agreements, and the system provides reasonably secure and predictable enforcement of such agreements. Proper functioning of the price system also requires that policy makers follow prudent macroeconomic policies, that new firms can enter freely into any industry, that unviable firms exit from the industry, that the prices of all commodities are determined freely, that the government follows liberal foreign trade and foreign direct investment policies, and that the banking and payments systems function properly.
Prior to reform the means of production in socialist economies were almost exclusively under state ownership. The state determined what should be produced, how it should be produced and for whom. There was no role for markets or a price mechanism. With the introduction of market-oriented policies the newly emerging private sectors started to dominate the economies of the transition countries. This was achieved through the privatisation of state assets and the entry of new private businesses. Table 4.12 shows that by mid 1995 the private sector accounted for 70 per cent of GDP in the Czech Republic, 65 per cent in Estonia, 60 per cent in Hungary, Poland, the Slovak
Republic and Latvia, 55 per cent in Lithuania, 45 per cent in Bulgaria and
Slovenia, and 40 per cent in Romania. These results are impressive.
The privatisation of small firms, commercial real estate and housing proved
to be relatively easy compared with the privatisation of larger firms. In this
case there were none of the major weaknesses of privatising larger entities, such as regulatory and governance weaknesses, high capital requirements and major restructuring needs. Widespread ownership of small businesses was achieved by various methods, such as privatisation by open competitive auction, giving concessions to employees, restitution and voucher sales. In the case of larger firms different methods of privatisation were used by different countries. As shown in Table 4.12, the Czech Republic and Lithuania mainly used a voucher system. Hungary and Estonia privatised a significant proportion of their state enterprises by direct sale, for example through block sales. Management-employee buyouts were used extensively in Poland, where sales to municipalities, social insurance organisations and sales through insolvency proceedings were the dominant methods of privatisation. Accord-ing to the World Bank (1996) each method of privatisation has its own advantages and disadvantages. Privatisation through sales to outside owners
Table 4.12. Share of the private sector and methods of privatisation in selected transition countries (percentage of total) Methods of Privatisation Private sector (Share of GOP Management-Equal-access during Sale to outside employee voucher Still in mid 1995) owners buyout privatisation Restitution Other state hands CEE countries Bulgaria 45 n/a n/a n/a n/a n/a n/a Czech Republic 70 By number 32 0 22* 9 28 10 By value 5 0 50* 2 3 40 Hungary 60 By number 38* 7 0 0 33 22 By value 40* 2 0 4 12 42 Poland 60 By number 3 14 6 0 23* 54 Romania 40 n/a n/a n/a n/a n/a n/a Slovak Republic 60 n/a n/a n/a n/a n/a n/a Slovenia 45 n/a n/a n/a n/a n/a n/a Baltic countries Estonia 65 By number 64* 30 0 0 2 4 By value 60* 12 3 10 0 15 Latvia 60 n/a n/a n/a n/a n/a n/a Lithuania
ss
By number <1 5 70* 0 0 25 By value <1 5 60* 0 0 35 * Dominant privatisation method in the country. Sources: EBRD (1995); World Bank (1996). 00"
88 Fiscal Policy in Turkey and the Transitional Economies
may lead to better corporate governance, higher government revenues and better access to capital and skills. Voucher privatisation excels in speed and fairness but does not yield revenue to the government. The effect on corporate governance and access to capital and skills is uncertain. Finally, the manage-ment-employee buyout system excels in speed but may not result in better corporate governance, more government revenue, fairness or better access to capital and skills. Thus countries with different priorities may employ different methods of privatisation.
In Turkey, land is privately owned but public ownership of industry and services is extensive. SOEs' have been an important part of the Turkish economy since the 1930s. Initially these enterprises performed well, but over time political interference, combined with policy and institutional weak-nesses, led to mounting losses, which increased the SOEs' debt and borrowing requirements and made the sector a major contributor to fiscal deficit. The SOEs' poor economic performance is considered to be due mainly to the soft-budget constraints they face. They follow objectives such as agricultural income support and employment creation, influenced by political pressure and they are not subject to a commercial code or the bankruptcy laws. Pricing, employment and investment decisions require, in general, the approval of the Treasury, the State Planning Organisation and sometimes the individual ministers. The SOEs receive subsidies from the government in the form of direct transfers, equity injections and debt consolidation. There are also barriers to exit in Turkey. The government, in order to protect workers from unemployment, subsidises unprofitable firms. Unviable firms are often not allowed to go bankrupt, but a proper functioning of the price system requires unviable firms to exit from the market. One possible way of achieving this objective is to require the SOEs to operate according to market rules and to remove the direct and indirect subsidies. The second alternative is privatisa-tion. Since 1983 privatisation has been a prominent part of the Turkish structural adjustment programme. However divestiture has been slow and inefficient, and poorly managed public firms continue to pose a public finance burden.
In Turkey the SOE sector consists of 240 fully or majority state-owned enterprises. In 1991 they accounted for 60 per cent of sectoral value added in mining, 40 per cent in energy, gas and water, and close to 40 per cent in transport and communication. As a share of GDP, aggregate SOE value added declined from 8.2 per cent in 1985 to 6.8 per cent in 1993. Seven SOEs account for the bulk of the economic and financial burden of the sector, producing commodities such as electricity, iron steel and coal, and providing services such as railway communication. The borrowing requirements of the SOEs increased from 2.5 per cent of GNP in 1984-88 to 4.1 per cent in 1991-92.
Legislation enabling privatisation in Turkey was passed in 1986 and the Public Participation Administration was vested with the authority to
admin-Hikmet Ulugbay and Osman Zaim 89
ister the privatisation. Implementation began in 1988, but in 1989 block sales of cement companies were overturned by a court ruling. The legal challenges were resolved in 1992. The pace of sales picked up between 1990 and 1993. The dominant methods were block sales, public offers of share participation and the sale of shares in the Istanbul Stock Exchange. Privatisation came to a halt in 1994 due to legal difficulties, and a challenge from opposition parties in parliament led to the annulment of the legislation. A new privatisation law was
enacted in November 1994 but the privatisation process, as noted by Arat et al.
in chapter 10 of this volume, did not gain momentum. Total privatisation revenues between 1985 and November 1996 amounted to a modest 3.1 billion compared with much larger revenues in Mexico and Argentina.
The major tasks facing the transitional economies and Turkey with regard to the larger SOEs are making them face hard budget constraints and solving the problem of corporate governance. Although SOEs could be forced to become competitive by making them subject to hard budget constraints, in practice there are many reasons why governments do not do so. There is broad agreement that privatisation is necessary, but privatisation by itself will not solve the problems of corporate governance for larger enterprises. The separation of ownership and management creates a need for monitoring. Direct monitoring by shareholders is one way of supervising managers. Another is to let falling stock prices in a well-functioning stock market discipline managers.
4.5 Social safety nets and social security
In the centrally-planned economies, state enterprises were the main providers of social services to workers and their families. These services included free housing, health care and education. In market economies these activities are financed through the budget. Thus, the centrally-planned economies were confronted, at the outset of the transition process, with the challenge of replacing their comprehensive systems of income and job security with social support structures compatible with a market economy. In the following subsections we consider social safety nets and social security systems.
Social safety nets
Under socialism, the implicit guarantee by the state of lifetime employment and access to highly subsidised commodities rendered unemployment benefit and income support schemes superfluous. In the transitional economies there was no involuntary unemployment prior to the reforms and food prices were kept low in order to support the real incomes of the consumers. However, after adoption of the reform measures the need arose for social safety nets in order to avoid unacceptable cuts in the living standards of vulnerable groups. Hence these countries had to introduce unemployment insurance and retraining facilities.
90 Fiscal Policy in Turkey and the Transitional Economies
Table 4.13 Unemployment rates in the transitional economies and Turkey
1989 1990 1991 1992 1993 1994 1995 CEE countries Bulgaria n/a 1.5 11.5 15.6 16.4 12.8 10.5 Czech Republic 0.8 4.1 2.6 3.5 3.2 2.9 Hungary 0.3 2.5 8.0 12.7 12.6 10.9 10.4 Poland 0.1 6.1 11.8 13.6 15.7 16.0 14.9
Romania n/a n/a 3.0 8.1 10.2 11.0 8.9
Slovak Republic 1.5 11.8 10.3 14.4 14.8 13.1
Slovenia 2.9 4.7 8.2 11.6 14.4 14.4 13.8
Baltic countries
Estonia n/a n/a n/a 0.9 2.1 1.8 1.8
Latvia 0.1 2.1 5.3 6.5 6.0
Lithuania n/a n/a 0.3 1.0 2.5 4.2 6.6
Turkey 8.6 7.5 8.4 8.0 8.0 7.9 6.9
Sources: EBRD (1996); Turkish Republic (1996a).
Table 4.13 shows the unemployment rates in the period 1989-95. As can be seen, at the end of the 1980s the rates were very low. With the introduction of reforms the countries in question granted rather generous unemployment benefits. The programmes, as noted by Ahmad (1992), included lax eligibility criteria, high replacement levels, low contribution rates and a fairly long duration of benefits. The initial replacement rate in Poland was 70 per cent, indicating that unemployment benefit amounted to 70 per cent of the pre-termination wage. The rate declined to 40 per cent after nine months, but benefits were still provided for an indefinite period. The eligibility criteria in Poland were lax in that dismissed workers, voluntary resigners and first-time jobseekers were eligible for benefit. The employers contribution rate was set at 2 per cent, but with the rise in unemployment to 11.8 per cent in 1991 it became obvious that the contribution rate was insufficient to cover the costs. Furthermore, the generous unemployment benefits reduced the incentive to find work and led to reduced labour-market flexibility. Poland had to tighten the eligibility criteria, shorten the duration of benefits and lower the benefit rates. With the introduction of market reforms, the other transitional economies introduced similar unemployment insurance systems. By 1995, benefits in all countries had been lowered, and differential benefit structures have now been eliminated in Hungary and Poland. All countries have limited the period for which unemployment benefits are paid to a year or less. Workers unemployed for more than a year have to rely on poverty relief.
The two problems faced by countries introducing unemployment benefit systems are: how should the system be financed and what steps can be taken to insure that they do not distort incentives and discourage unemployed workers from seeking a job? Generous unemployment benefits may discourage some
Hikmet Ulugbay and Osman Zaim 91
workers from seriously seeking work or accepting job offers that do not meet their aspirations. Countries try to solve this problem by changing the time profile and amount of unemployment compensation. With regard to financing of the scheme, most do this through a flat payroll tax but this implies that stable employers and their workers are financing their less stable counterparts. In most EU countries the unemployment protection system follows the 'insurance' and 'assistance' principles. Under the insurance principle, unemployment protection is considered an insurance mechanism, and hence only those who have been employed previously and contributed to the social security funds are entitled to receive unemployment benefit. The benefit is paid for a limited duration and the amount received is tied to past contributions. Under the assistance principle, persons in special need are entitled to receive help from the state. Consideration of the main characteristics of the unemployment protection system in Spain, where the assistance principle applies jointly with the insurance principle, reveals the following. The unemployment protection system covers all groups of workers, but to receive unemployment benefit, workers must have made social security contributions for a total period of twelve months during the previous four
years. The sum paid amounts to 70 per cent of the basic wage during the first
six months of the unemployment period, 60 per cent from the seventh to the
twelfth month and SO per cent from the thirteenth month. The maximum
benefit is 170-220 per cent of the minimum wage, depending on the number
of dependent children. The duration of benefit depends on the number of months of past contributions, but the maximum is two years. Benefit is paid
for four months after a contribution period of 12-18 months, six months after
a contribution period of 18-24 months, eight months after a contribution
period of 24-30 months, and ten months after a contribution period of 30-36
months. According to Jimeno and Toharia (1994) unemployment benefits in
Spain are not subject to income tax. Workers in Austria, in order to receive unemployment benefit, must have been employed for one year during the previous two years and have paid social security contributions for one year.
The time span for payment of unemployment benefit is 30 weeks and the level
of unemployment benefit is on average 55 per cent of previous net income. Unemployment benefits are financed by employers' and employees'
con-tributions, amounting to 2.6 per cent of gross earnings.
The governments of the transitional economies initiated, besides the unemployment insurance schemes, various programmes to ease social tensions. First, the old system of subsidies was replaced by direct cash compensation to individuals on a means-tested basis. Second, new institutions and programmes were developed to increase labour flexibility. In the past the emphasis had been on individual security in the form of guaranteed jobs, but in a market system employees have to move between employers, between types of work and between places. One institution that can increase labour flexibility is a well-functioning employment agency. During the
transforma-92 Fiscal Policy in Turkey and the Transitional Economies
tion process most of the countries established employment offices at the regional and local levels in order to help the unemployed to find new jobs. In addition to these public offices, private labour bureaus have started to emerge. Third, retraining programmes have been introduced for the unemployed. Fourth, social assistance programmes target low-income households. These programmes generally receive their funds from the state budget and render services to the elderly, disabled, orphans, the poor and so on, and as the programmes are relatively young there may be some overlap with other social programmes. Finally, measures have been taken to dismantle forms of social support such as housing and day care that tie workers to a single enterprise.
In Turkey there is no unemployment insurance. Since the loss of income from paid employment can have a profound effect on the living standards of workers and their families, Turkey has introduced a system of notice and severance payments. Article 13 of Labour Law 147 5 requires workers to be paid for a period of two weeks to two months from the date of notifice, depending on length of service. In addition Article 14 requires workers to be paid severance pay, which depends on length of service and amounts to a minimum of 30 days' wages for each year worked.
There are also programmes aimed at increasing of labour market flexibility. Labour placement is the task of the Labour Placement Agency, which finds jobs for around 250 000 people a year in the domestic market and another 60 000 in foreign markets. Retraining is available through the adult education
pro-grammes. The Ministry of Education has about 9 SO adult training centres, which
are attended by over half a million people. The duration of these programmes is a minimum of eight months. In addition, public agencies such as the National Productivity Centre and universities organise short courses and seminars in selected areas. Finally, there are agencies providing social assistance to targeted groups. The Child Protection Agency, under the Ministry of Health, takes care of orphans. During the late 1980s the Fund for the Poor and Needy was established
to help the poor. It extends financial help to the jobless and other people in
need. All of these provisions are backed by the state budget. Social security systems
The social insurance system in Turkey is the responsibility of three independent agencies: the Pension Fund (PF), whose members are public servants; the Social Insurance Agency (SIA), which is responsible for employ-ees in all sectors; and the Self-Employed Insurance Scheme (SEI), which meets the social security needs of self-employed individuals. With minor exceptions the services provided by these agencies are almost the same, and coverage includes retirement pension, disability pension, maternity, death and occupational injury insurance. However, since the late 1980s the financial situation of the three funds making up Turkey's social insurance system has deteriorated considerably. The system went into deficit during the 1990s and by 1995 the deficit had reached 1.8 per cent of GNP.
Hikmet Ulugbay and Osman Zaim 93
The problems with the social security system can be studied by considering the eligibility criteria for retirement benefit, the average number of years social assistance payments are provided to a pensioner, the extent of the pension and social assistance payments to the pensioner over his or her lifetime, and the contribution revenues. Eligibility criteria are usually set in terms of a minimum retirement age. Until1992 this was 60years for men and 55 for women, but the minimum retirement age limit was removed in 1992. Consequently those who have been enrolled in the pension system for at least 25 years in the case of men and 20 years in the case of women are eligible to receive full pension benefits upon completion of a relatively short minimum contribution period of only 5000 days for men and 3600 days for women. Hence women aged 38 and men aged 43 are able to retire. These pensioners will draw benefits for a long time-the life expectancy of women at time-the age of 38 is 38.5 years and that of men at the age of 43 is 30.8 years. Thus the system will have to support women who retire at the age of 38 for 38.5 years, and men who retire at the age of 43 for 30.8 years. Furthermore the pensions and social assistance payments provided to pensioners over their lifetime are relatively large - about 120 per cent of the average wage. On the revenue side, the problem facing the pension system is not related to low statutory contribution rates. On the contrary, the contribution rates- amounting to 21.5 per cent of the basic salary, excluding bonuses and fringe benefits - are relatively high compared with other OECD countries. Rather the difficulty faced is associated with contribution collection. The compliance ratio (cash receipt/accrued contribution revenues) is around 80
per cent in the case of the SIA, SO per cent in the case of craftsmen and
tradesmen, 32 per cent in the case of fanners and about 100 per cent in the case of the PF. The excellent collection record of the PF is due to the fact that the government is both employer and tax collector.
The data in Table 4.14 indicate that, with the average worker paying 21.5 per cent of the average basic wage in pension contributions and the average pension amounting to 120 per cent of the average basic wage, there
must be 5.6 workers to support every pensioner. If all workers between the ages
of 20-59 are contributors and all those aged 60 or over are pensioners, the demographics of Turkey- with 6.6 persons of working age per person over 60-should be adequate to support the current pension system. However, by 1994 there were only 2.4 active contributors per pensioner. Thus a deficit in the Turkish pension system was unavoidable. In 1995 the deficit amounted to
1.8 per cent of GNP. It should be noted that over time the age dependency
ratio will increase, resulting in a decrease in the number of persons of working
age per person over 60 from 6.6 to 6.0. It has been predicted that the pension
deficit will increase to 2.2 per cent of GNP by the tum of century and with rise above 8 per cent by the year 2020.
The Turkish social security system requires three basic reform measures to be affected: a rise in the minimum retirement age, a reduction in pension and social assistance payments, and an increase contribution revenues. Recently