MAGNETIC RESONANCE
Structural brain alterations of Down
’s syndrome in early
childhood evaluation by DTI and volumetric analyses
Hediye Pınar Gunbey1&Meltem Ceyhan Bilgici1&Kerim Aslan1&Arzu Ceylan Has2& Methiye Gonul Ogur3&Aslıhan Alhan4&Lutfi Incesu1
Received: 12 June 2016 / Revised: 26 August 2016 / Accepted: 29 September 2016 / Published online: 31 October 2016 # European Society of Radiology 2016
Abstract
Objectives To provide an initial assessment of white matter (WM) integrity with diffusion tensor imaging (DTI) and the accompanying volumetric changes in WM and grey matter (GM) through volumetric analyses of young children with Down’s syndrome (DS).
Methods Ten children with DS and eight healthy control sub-jects were included in the study. Tract-based spatial statistics (TBSS) were used in the DTI study for whole-brain voxelwise analysis of fractional anisotropy (FA) and mean diffusivity (MD) of WM. Volumetric analyses were performed with an automated segmentation method to obtain regional measure-ments of cortical volumes.
Results Children with DS showed significantly reduced FA in association tracts of the fronto-temporo-occipital regions as well as the corpus callosum (CC) and anterior limb of the internal capsule (p < 0.05). Volumetric reductions included total cortical GM, cerebellar GM and WM volume, basal ganglia, thalamus, brainstem and CC in DS compared with controls (p < 0.05). Conclusion These preliminary results suggest that DTI and volumetric analyses may reflect the earliest complementary changes of the neurodevelopmental delay in children with
DS and can serve as surrogate biomarkers of the specific ele-ments of WM and GM integrity for cognitive development. Key Points
• DS is the most common genetic cause of intellectual disability.
• WM and GM structural alterations represent the neurolog-ical features of DS.
• DTI may identify the earliest aging process changes. • DTI-volumetric analyses can serve as surrogate biomarkers
of neurodevelopment in DS.
Keywords Down’s syndrome . Brain . MRI . DTI . Volumetry
Introduction
Down’s syndrome (DS), or trisomy 21, is the most common genetic cause of intellectual disability and occurs in 14.7 out of every 10,000 live births [1]. The association of several neurological features, such as impairments in language [2], cognition [3], learning and memory [4], with unclear origin make it one of the most speculated neurodevelopmental dis-orders in childhood. The cognitive profiles of DS include lan-guage deficits in articulation [5], syntactic weakness [6] and significant verbal short-term memory deficits [7] accompa-nied by motor weaknesses [8].
Although the clinical features of DS have been character-ized, few neuroimaging studies have qualified the pathophysi-ology of the neurological deficits in DS. As the first manifes-tation of neuroanatomical abnormality, a characteristic reduced brain size of children with DS appears in the 4- to 5-month fetus and progresses during the last 3 months of gestation [9,
10]. Structural MRI reports, based on fewer than 15 original studies in children and youths, have suggested that the total
* Hediye Pınar Gunbey [email protected]
1 Faculty of Medicine, Department of Radiology, Ondokuz Mayıs
University, Neuroradiology Section, 55139 Kurupelit, Samsun, Turkey
2
National Magnetic Resonance Research Center, Bilkent University, Ankara, Turkey
3
Department of Genetics, Ondokuz Mayıs University,
Samsun, Turkey
brain volume is smaller [11–14], with specific reductions in cerebellar [11–13,15] and hippocampal volumes [12,14,15]. Additionally, several studies have reported regional reductions in the frontal and temporal lobes [13,14] and preserved parietal lobar grey matter (GM) volume [12] in children. Knowledge of GM involvement has been extended by recent paediatric voxel-based morphometry (VBM) studies with high spatial resolu-tions. Differences in GM density have been reported in the frontal temporal lobes and cerebellum [15–17]. The latest study utilizing cortical morphometry in young people also noted re-ductions of cortical GM and white matter (WM) volumes, ac-companied by decreased frontotemporal surface areas [18]. A case study of cortical morphometry using FreeSurfer reported reduced volumes of bilateral precentral and cingulate gyri [19]. FreeSurfer is a powerful tool with high reproducibility and accuracy for extensive and automated analysis of the human brain [20]; it provides completely automated parcellation of the cerebral cortex and subcortical structures.
Due to the severity of the DS cognitive phenotypes, it is surprising that no existing study has evaluated the WM integrity of children with DS. The impaired intellectual function in DS is caused by abnormalities in memory, language and learning [21]. Morphosyntax, verbal short-term memory and explicit long-term memory are typically affected by memory and language abilities. Along with volume reductions, the connections of white matter structures between the frontal and temporal lobes may also be affected and may disclose the underlying pathophysiology of these deficits. In addition, emotion and the affected visuospatial functions may also be linked to limbic and temporo-occipital connections. Lastly, an evaluation of cerebellar microstructures may define the involvement of motor and non-motor functions in the cerebellums of patients with DS [22]. Due to the growing interest in potential alterations in anatomical connectivity, diffu-sion tensor imaging (DTI) has become a popular tool for assessing structural connectivity in the human brain.
DTI is a non-invasive, advanced MRI method that characterises the microstructure of WM in vivo by quantita-tively measuring the diffusion of water [23]. DTI parameters, especially fractional anisotropy (FA), identify the directional diffusion properties of tissues and are sensitive to anomalies in axonal density, diameter and myelination within WM tracts [24]. Another DTI parameter, mean diffusivity (MD), reflects the magnitude of diffusion that is independent from anisotropy and demonstrates the degrees of myelination, interstitial space and axonal density. According to the existing literature, only one DTI study has evaluated the WM integrity of DS in adults: Powell et al. [25] reported FA decline in evaluating dementia in DS adults. Against the background of morphological brain changes that have been detected as early as in 4- to 5-month fetuses, we aimed to investigate 2- to 4-year-old children with DS. These data provide an initial assessment of WM integrity and accompanying white and grey matter volumetric changes in early DS childhood.
Materials and methods
SubjectsThe study included ten children with DS (five girls and five boys; mean age 2.6 ± 0.69 years) and eight healthy controls (four girls and four boys; mean age 2.5 ± 0.707 years). The patients were recruited from DS individuals who were referred for brain MRI acquisition by the Department of Genetics dur-ing clinical follow-up. The diagnosis of DS was confirmed by karyotype examinations that showed trisomy of the chromo-some 21. Exclusion criteria included untreated medical condi-tions that might affect cognition (e.g. hypothyroidism in DS). The control group consisted of eight right-handed, age- and sex-matched healthy subjects who had been referred for MRI scan for other reasons and had normal findings on structural MRI. Controls were excluded for having any history of pre-vious neurological, psychiatric or systemic disease. After a complete description of the study, informed consent was ob-tained from the patients’ parents before the administration of sedative drugs prior to going for the MR scan. The study was approved by the Ethics Committee of Ondokuz Mayıs University Medical School, Samsun, Turkey.
The MRI studies were conducted under sedation with chlo-ral hydrate (CH). The protocol for paediatric MRI sedation was 50 mg/kg CH, followed by a second dose if sedation failed. In patients who were monitored, oxygen saturation and electro-cardiogram monitoring were applied during sedation. The pa-tients were discharged 1–2 hours after they recovered. Image acquisition and processing
All images were acquired on a 1.5-T Philips Gyroscan Intera system equipped with a Synergy-L Sensitivity Encoding (SENSE) head coil. The DTI data were acquired using a 16-direction EPI sequence with 60 contiguous 2-mm AC-PC aligned interleaved slices with no gap (TR/ TE = 10.15/ 90 ms; matrix = 128 × 128; b-value = 1,000; FOV = 256 mm, 2-mm isotropic resolution, NSA = 3). In addition, a high res-olution T1-weighted 3D gradient-echo sequence (TR/ TE = 7.2/33 ms; matrix = 256 × 256 pixels; NSA = 1; FOV = 256 mm; slice thickness = 1 mm; gap = 0 mm; flip angle = 8°) of structural images of 160 slices of the entire brain was acquired for anatomical reference.
DTI data were analysed using FSL v. 4.1.5 (Functional MRI of the Brain software library, FMRIB). Preprocessing of the raw images of diffusion-weighted data involved correcting of head motion, eddy current distortion and diffu-sion tensor fitting using FMRIB’s Diffudiffu-sion Toolbox (FDT v. 2.0). After pre-processing, FA and MD were calculated. Tract-based spatial statistics (TBSS) (TBSS v. 1.2; http://www. fmrib.ox.ac.uk/fsl/tbss/) were used for voxelwise statistical analyses of the DTI data. The thinned mean FA skeleton
was computed after registration of FA maps and aligning to the average space as input for TBSS. A permutation-based, non-parametric test was performed with 500 permutations to produce the voxelwise statistics.
The threshold-free cluster enhancement was used to avoid the use of an arbitrary threshold in the initial cluster formation and output was corrected for multiple comparisons. Family-wise error corrected maps were obtained with p-values less than 0.05. Standard cluster-based thresholding corrected for multiple comparisons, comprising Gaussian-smoothing, thresholding of the smoothed data at a cluster-forming t threshold of two and, finally, formation of the contiguous clusters of supra-threshold voxels (using 26-neighbour con-nectivity) were carried out. Supratentorial WM clusters with significant changes on the resulting TBSS maps were extract-ed as regions of interest (ROIs) and registerextract-ed and overlaid onto an anatomical Montreal Neurological Institute (MNI) template. These ROIs were labelled according to Johns Hopkins University WM tractography and the International Consortium for Brain Mapping DTI-81 WM atlases in FSL, and the mean diffusion indices of the ROIs were calculated. The author who performed the measurements was blind to subjects’ clinical information and compared right and left
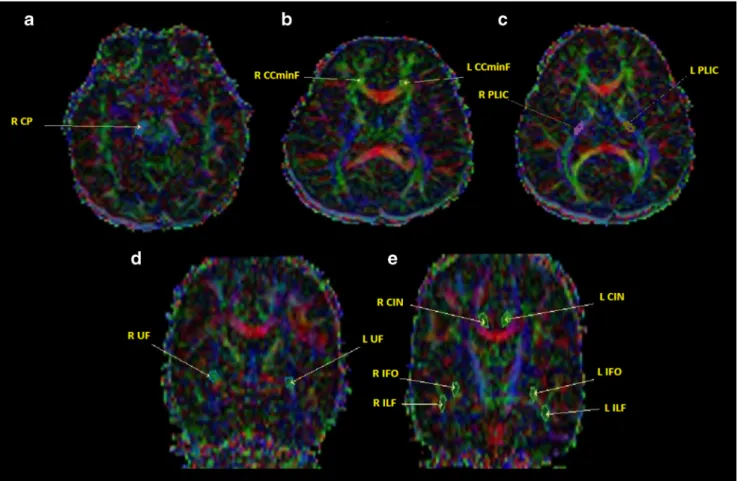
sides. For the special analyses for measuring FA values, ROIs were drawn to the right cerebral peduncle (R-CP), bilat-eral posterior limb of internal capsule (PLIC), uncinate fascic-ulus (UF), inferior longitudinal fascicfascic-ulus (ILF), inferior fronto-occipital fasciculus (IFOF), cingulum (CIN) and cor-pus callosum minor forceps (CCminF) (Fig.1).
The volumetric segmentation analysis was performed using Freesurfer v. 5.3.0 (http://surfer.nmr.mgh.harvard. edu/) including the removal of non-brain tissue (skull, eyeballs and skin), using an automated algorithm with the ability to successfully segment the whole brain with-out any user intervention. Next, cortical surface recon-struction methods were applied to acquire regional mea-surements of cortical volume (mm3). Fischl et al. [26] described the automated procedures for volumetric mea-surements of the different structures of the brain. After checking the reconstructed cortical surface models to con-firm segmentation accuracy for each participant, regions with poor segmentation accuracy were excluded from analyses due to poor image quality or misregistration. Cortical surfaces were automatically parcellated and com-bined to create averages for cortical-total GM and for frontal, temporal, parietal and occipital lobar regions.
Fig. 1 The regions of interest (ROIs) on coloured fractional anisotropy (FA) maps on axial (A, B, C) and coronal sections (D, E). R right, L left, CP cerebral peduncle, PLIC posterior limb of internal capsule, IFOF
inferior frontooccipital fasciculus, ILF inferior longitudinal fasciculus, UF uncinate fasciculus, CIN cingulum, CCminF corpus callosum minor forceps
The Shapiro-Wilk test was used to determine normality, and the Mann-Whitney U test was used for comparisons of the means of variables with controls. Correlations between volumetric values and volumetric-DTI values were calculated with Spearman’s correlation test. A p-value less than 0.05 was considered to indicate statistical significance.
Results
Volumetric analyses
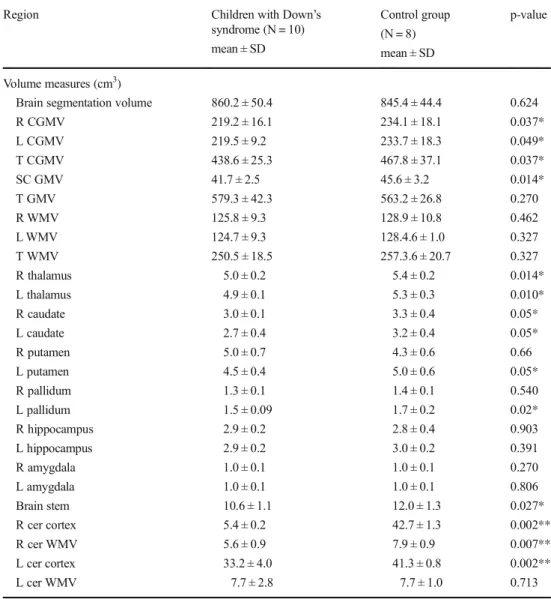
Children with DS showed significant reductions in the region-al GM volume of of the left putamen, bilaterregion-al thregion-alamus prop-er, caudate nucleus and cerebellar cortex, as well as the brain stem and corpus callosum (CC) (p < 0.05). Additionally,
subcortical GM volume (SGMV) and total cortical GM vol-ume (TCGMV) of both hemispheres and right cerebellar WM volume were significantly lower in DS subjects compared to controls (p < 0.05) (Table1). There were no significant differ-ences in the total WM, total GM and brain segmentation vol-umes (p > 0.05) between DS subjects and the controls. DTI analyses
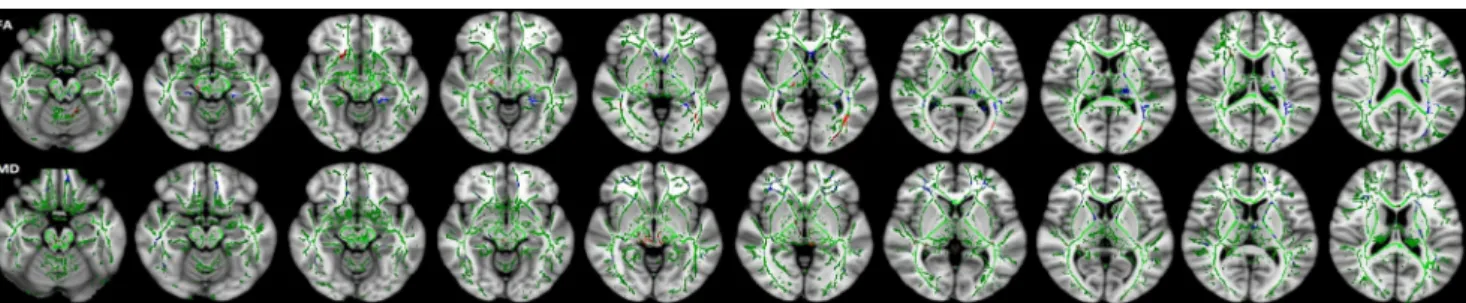
The whole brain TBSS revealed extensive reductions of FA in the supratentorial WM including right-CP, right-UF, CC body, bilateral ILF/IFOF and right anterior limb of the internal cap-sule (ALIC). Clusters showing increments of MD values for DS compared to control subjects were found in the CP, ILF and IFOF of the right hemisphere and in the external capsule and posterior thalamic radiation (PTR) of the left hemisphere.
Table 1 Regional brain volumes
of subjects with Down’s
syndrome versus control subjects
Region Children with Down’s
syndrome (N = 10) mean ± SD Control group (N = 8) mean ± SD p-value Volume measures (cm3)
Brain segmentation volume R CGMV L CGMV T CGMV SC GMV T GMV R WMV L WMV T WMV R thalamus L thalamus R caudate L caudate R putamen L putamen R pallidum L pallidum R hippocampus L hippocampus R amygdala L amygdala Brain stem R cer cortex R cer WMV L cer cortex L cer WMV 860.2 ± 50.4 219.2 ± 16.1 219.5 ± 9.2 438.6 ± 25.3 41.7 ± 2.5 579.3 ± 42.3 125.8 ± 9.3 124.7 ± 9.3 250.5 ± 18.5 5.0 ± 0.2 4.9 ± 0.1 3.0 ± 0.1 2.7 ± 0.4 5.0 ± 0.7 4.5 ± 0.4 1.3 ± 0.1 1.5 ± 0.09 2.9 ± 0.2 2.9 ± 0.2 1.0 ± 0.1 1.0 ± 0.1 10.6 ± 1.1 5.4 ± 0.2 5.6 ± 0.9 33.2 ± 4.0 7.7 ± 2.8 845.4 ± 44.4 234.1 ± 18.1 233.7 ± 18.3 467.8 ± 37.1 45.6 ± 3.2 563.2 ± 26.8 128.9 ± 10.8 128.4.6 ± 1.0 257.3.6 ± 20.7 5.4 ± 0.2 5.3 ± 0.3 3.3 ± 0.4 3.2 ± 0.4 4.3 ± 0.6 5.0 ± 0.6 1.4 ± 0.1 1.7 ± 0.2 2.8 ± 0.4 3.0 ± 0.2 1.0 ± 0.1 1.0 ± 0.1 12.0 ± 1.3 42.7 ± 1.3 7.9 ± 0.9 41.3 ± 0.8 7.7 ± 1.0 0.624 0.037* 0.049* 0.037* 0.014* 0.270 0.462 0.327 0.327 0.014* 0.010* 0.05* 0.05* 0.66 0.05* 0.540 0.02* 0.903 0.391 0.270 0.806 0.027* 0.002** 0.007** 0.002** 0.713 R right, L left, T total, GMV grey matter volume, CGMV cortical grey matter volume, SC subcortical, WMV white matter volume
Clusters of ALIC and anterior parts of anterior thalamic radi-ation (ATR), UF, IFO and anterior corona radiate showed bilateral increments of MD. Notably, the clusters in the R-CP and bilateral IFO had lower FA values that were associated with greater MD (Fig.2).
Interestingly, individuals with DS exhibited greater FA in several clusters, such as the left superior cerebellar peduncle, frontal part of left IFO, bilateral medial lemniscus, PLIC and stria terminalis, temporal part of bilateral cingulum, right optic tract and ILF.
Furthermore, significant FA differences were revealed by ROI analyses of the right CP (p = 0.033), right ILF (p = 0.044), left UF (p = 0.006) and right UF (p = 0.016) between the DS and control groups (Fig.3). MNI coordi-nates of selected ROIs and significant FA values are sum-marized in Table2.
In correlation analyses, while right-CIN showed a positive correlation with right-CP (p = 0.004, r = 881), left-CIN corre-lated with left-PLIC ( p = 0.047, r = 714) in control subjects. In the DS group, positive correlations were seen between the
right-CIN and right-CP (p = 0.029, r = 685), the right-UF and right-CP (p = 0.024, r = 685) and the right-ILF and left-IFOF (p = 0.019, r = 721). The left-UC correlated positively with the CCminF in both DS (p = 0.004, r = 818) and control subjects (p = 0.037, r = 673).
Combined volumetry and DTI results
The correlation analyses of volumetry and DTI values showed a positive (p = 0.016, r = 733) relationship between FA of the CCminF and the anterior volume of the CC, which was an expected result. The FA values of the right PLIC correlated positively with the right WM (p = 0.006, r = 794) and total WM volumes (p = 0.005, r = 806).
Discussion
The alterations in neuronal and cognitive development with premature aging requires clear understanding of the earliest changes in brain structures for the earliest treatment strategies for DS. Although DS is a neurodevelopmental disorder, most neuroimaging studies have investigated the volumetric analy-ses of adult and adolescent samples not fit into a narrow age range. Interestingly, no study has investigated the WM integ-rity of children with DS. The present study revealed prelimi-nary data on alterations in GM and WM integrity through volumetric and DTI analyses in a homogeneous sample of participants between 2 and 4 years old, which is a critical age range for brain overgrowth.
Volumetry
Results of the present study documented lower widespread GM volumes of SGMV and TCGMV consistent with two recent studies that focused on cortical morphometry in young DS subjects [18,27]. A reduced cortical GM volume may reflect the post-mortem findings of simplified gyral patterns, decreased neuronal density, lamination [28] and reduction of about 30–40 % in the number of both neurons and glial cells
Fig. 2 Tract-based spatial statistics (TBSS) (family-wise error– corrected
threshold-cluster extend voxel p maps) display clusters with significantly different fractional anisotropy (FA) and mean diffusivity (MD) of
children with Down’s syndrome (DS) compared to control participants
at P < 0 .05. For all diffusion measures, blue shows increased values and red shows decreased values. FA skeleton projected on a mean FA map is shown in green
Fig. 3 Fractional anisotropy (FA) values of the most affected white matter (WM) tracts from region of interest (ROI) analyses between
children with Down’s syndrome (DS) and control subjects (p < 0.05). R
right, L left, CP cerebral peduncle, ILF inferior longitudinal fasciculus, UF uncinate fasciculus
of neocortical regions in DS [29]. This abnormal development of cortical neurons can lead to learning and memory problems or seizures that begin to emerge in late infancy.
Although a regional GM volume decline in the left puta-men, bilateral thalamus and caudate nucleus as well as the brain stem represents initial data in volumetric neuroimaging studies of DS, Anderson et al. [30] reported involvement of these structures with functional MR imaging (fmri) and Karlsen et al. [29] showed there were about 40 % fewer neu-rons in the thalami of DS brains compared to control brains. Gating sensory input from the brainstem and sensory areas to the cortex and other subcortical regions leads the thalamus and basal ganglia to act as key components for integrating cogni-tion and affective experience. Therefore, these structural alter-ations may be considered in causative issues of cognitive im-pairment in DS.
The significantly smaller CC was consistent with previous findings [31], and reflects the loss of neocortical neuronal projections involved in the maintenance of higher cognitive processes. Our findings of smaller cerebellar volumes were also consistent with the results of prior neuroimaging studies in children with DS [12,13,32]. In terms of cortical and WM volume reductions, the results of the current study are concor-dant with two recent paediatric neuroimaging studies utilizing voxel-based morphometry [15,17]. The cerebellum plays a major role in the regulation of proprioceptive motor control and motor learning as verified by the research of Rigoldi et al. [16], reporting a strong relationship between cerebellar vermis volume reduction and quality of gait in patients with DS. The involvement of the cerebellum might contribute to the cogni-tive phenotypes of DS through the non-motor cortico-cerebel-lar and cerebelcortico-cerebel-lar-limbic circuits that are involved in emotion,
attention, working memory, executive control and language learning [33]. Recently, Menghini et al. [17] found significant regional reductions in GM and positive correlations between GM density of cerebellum and measurements of linguistic ability.
Our results did not show as significant a difference in terms of total brain, segmentation and hippocampal volumes as pre-vious reports [12,14,15]. The total and subcortical GM vol-ume reduction may not have a significant influence on total brain and hippocampal volume in this age group. A compar-ison with these studies is challenging due to the wide age range in their included participants.
While we examined the youngest population of DS in neu-roimaging studies, they also included young adults, with dif-ficulties in establishing findings on early developmental or neurodegenerative progress.
DTI
These DTI data represent the first published study of children with DS. We observed significantly lower FA values in a sub-set of supratentorial WM tracts, which included the right-CP, right-UF, CC body, right ALIC and bilateral ILF and IFOF in DS. Our TBSS study’s results were consistent with those of Powell et al.’s DTI study on the frontal WM integrity of adults with DS [25]. As they reported we also detected much of the FA decrease in frontal circuits.
The internal capsule comprises much of the centrum semiovale and courses from the cortex to the brainstem tinuing as cerebral peduncles. Its first subdivision ALIC con-nects the thalamus and prefrontal cortex and contains axons in the frontopontine pathway. ALIC involvement in several
Table 2 Montreal Neurological Institute (MNI) coordinates of selected regions of interest (ROIs) and significant fractional anisotropy (FA) values of both Down’s syndrome subjects and controls
ROI MNI coordinates (x,y,z) Down’s syndrome
FA Control group FA p-value R CP 21,− 43 , − 36 0, 2482049 0,314408125 0.033 R PLIC 24,− 18, 13 0, 4677318 0,38414875 0,091 L PLIC − 23, − 18, 13 0, 4924511 0,387061375 0,062 R IFOF 35,− 10, − 12 0, 3989686 0,479078625 0,131 L IFOF − 36, − 14, − 12 0, 4367896 0,48864925 0,424 R ILF 42,− 29, − 12 0, 3679816 0,250141 0.044 L ILF − 41, − 29, − 12 0, 2487341 0,24346275 0,051 R UF 36, 2,− 15 0, 2727017 0,3578645 0.016 L UF − 35, − 5, − 15 0, 390128 0,289574875 0.006 R CIN 8, 19, 29 0, 3126787 0,2359035 0,214 L CIN − 7, 13, 29 0, 2818979 0,200515375 0,183 R CC minF − 7, 30, 5 0, 5488533 0,40169375 0,155 L CC minF 9, 29, 5 0,5390404 0,380602625 0,131
R right, L left, ROI region of interest, MNI Montreal Neurological Institute, CP cerebral peduncle, PLIC posterior limb of internal capsule, IFOF inferior fronto-occipital fasciculus, ILF inferior longitudinal fasciculus, UF unci-nate fasciculus, CIN cingulum, CCminF corpus callosum minor forceps, FA fractional anisotrophy
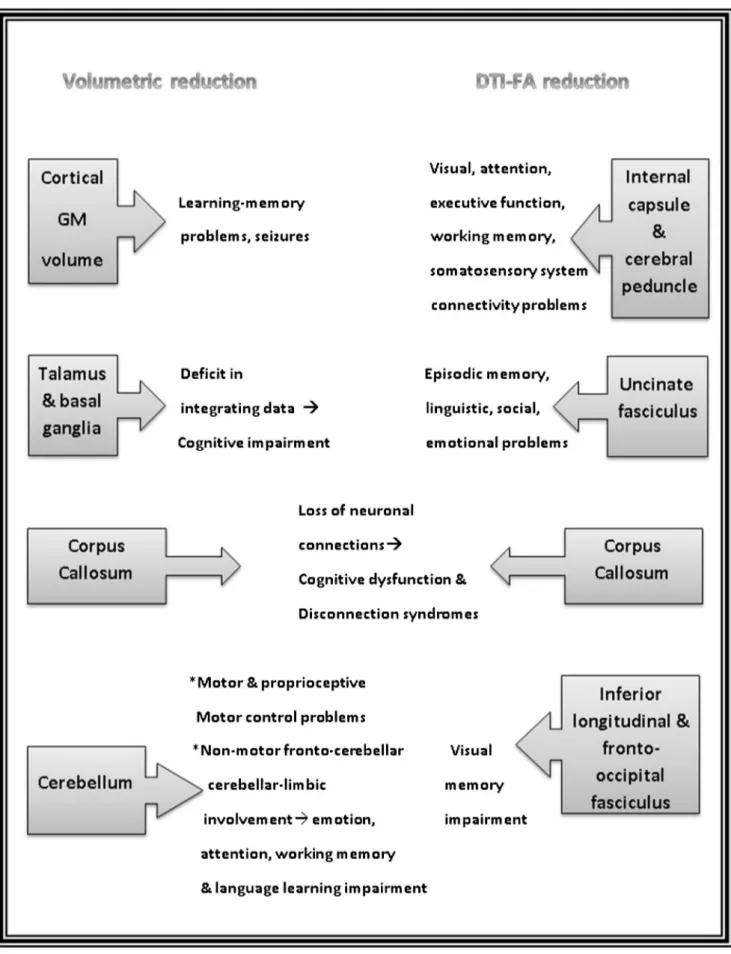
Fig. 4 Summary of the most affected regions through volumetric and diffusion tensor imaging (DTI) analyses in the present study and the possible outcomes of these results
diseases such as schizophrenia, autism and the evidence of neuropsychological abnormalities including memory impair-ment due to damage in genu and ALIC have been reported before [34–36]. Therefore, our findings on WM degradation in the ALIC may indicate the reduced function of the prefrontal cortex for executive function and spatial working memory in patients with DS. The impairment of thalamocortical fibres in the ALIC may affect the crucial connectivity of visual, atten-tional and somatosensory systems in patients with DS [37].
Another important aspect of frontal circuits is involvement of the UF which is one of the major long-range WM tracts that connects the orbitofrontal cortex to the anterior temporal lobes. It is assumed that the functions should align associative and episodic memory, linguistic and social-emotional functions due to typically relating with the limbic system. Deficits of short-term and episodic memory tasks and reductions in fMRI signals on the medial temporal lobe may be related to damage to the UF [38–40]. The FA decrease in UF may represent an earlier stage of hippocampal damage and reflect the affected cellular integrity with functional deficits.
Many individuals with DS face the daily challenge of nega-tively affected visual object memory [41]. The ILF is a ventral associative bundle with considerable functions in visual per-ception and object recognition. It connects the occipital lobe to the anterior part of the temporal lobe that runs above the optic pathways and overlaps with the IFOF, which is another direct pathway that connects the occipital, orbito-frontal and posterior-temporal areas. On the other hand, the ILF is linked to the UF so that it can transfer information to the orbito-frontal brain. In our study, degradation of integrity of the ILF and IFOF with decreased FA values may indicate visual memory impairment consistent with Ortibus et al. [42], who have reported a relationship between ILF and IFOF integrity in children with visual- perceptual impairment [42].
Finally, decreased FA in the CC, the largest WM structure that facilitates interhemispheric communication, provides sig-nificant evidence of WM involvement in DS. Lower FA values are consistent with the recent DTI study in adults by Powell et al. [25] and showed a positive correlation with decreased volumetry in our study. Cognitive dysfunction and several disconnection syndromes may result from the impaired integrity of the CC. The positive relationship between the UF and CCminF may indeed reflect functional similarity as well as spatially sharing overlapping paths.
MD and FA are complementary measurements of tissue damage. In our study, the UF, ILF, IFO, right-CP and ALIC showed decrements in FA accompanied by increments in MD, presenting the major affected fibres of WM in DS. However, independent MD increments in the clusters of the external capsule, anterior corona radiata and thalamic radiatio may demonstrate that diffusion is increased subjec-tively but the cellular integrity of these tissue is not signifi-cantly affected.
The FA increment is an uncommon finding during neuro-degenerative processes. However, increased FA values have been reported in autism and attention-deficit/hyperactivity dis-order [43,44] before. Thus, we can infer that the initially defective myelinated nerve sheaths of children with DS can show excessive hyperplasia during the overgrowth phase of brain development and lead to a high FA value of WM, where-as this extreme myelination may not completely compensate the defective cognitive function of DS. As previously report-ed, this condition may also be related to brain compensatory mechanisms of synaptic plasticity [45–47], even if the func-tion is not well preserved.
The most affected regions through volumetric and DTI analyses in the present study and the possible outcomes of these results are summarized in Fig.4.
Limitations
The present study has some limitations in that the cognitive/ motor functions of patients were not evaluated and the cross-sectional study method involved a small patient group using 1.5-T MRI.
Conclusion
The neurological deficits of DS appearing from childhood should be investigated for potential treatment strategies. To our knowledge, the preliminary results of WM alterations in children with DS in the present study may define impaired integrity of several fibres and may be related to executive function, visual and spatial memory, and disconnection syn-dromes. Additionally, as the first neuroimaging volumetric data in such a young patient group with DS, the results may suggest that cerebellar, CC, cortical, subcortical and deep GM volume reductions begin as early as 2 years of age. The lack of brain segmental volume reduction with more extensive WM impairment in this age group may suggest that WM degener-ation may be an early step in neurodevelopmental delay. In future studies, combining DTI and functional MRI in larger patient groups will contribute to providing further details about tissue microstructure and function of DS in neurodevelopmental and neurodegenerative progress.
Acknowledgements This paper was presented as an oral presentation
at ECR 2016. The scientific guarantor of this publication is Hediye Pınar
Gunbey. The authors of this manuscript declare no relationships with any companies whose products or services may be related to the subject mat-ter of the article. The authors state that this work has not received any
funding. Aslıhan Alhan kindly provided statistical advice for this
manu-script. Institutional Review Board approval was obtained. Written in-formed consent was obtained from all subjects (patients) in this study. Methodology: prospective, cross-sectional study, performed at one institution.
References
1. Parker SE et al (2010) Updated national birth prevalence estimates
for selected birth defects in the United States, 2004–2006. Birth
Defects Res Part A: Clin Mol Teratol 88:1008–1016
2. Martin GE et al (2009) Language characteristics of individuals with
Down syndrome. Top Lang Disord 29:112
3. Silverman W (2007) Down syndrome: cognitive phenotype. Ment
Retard Dev Disabil Res Rev 13:228–236
4. Jarrold C, Baddeley AD, Hewes AK (2000) Verbal short‐term
memory deficits in Down syndrome: a consequence of problems
in rehearsal? J Child Psychol Psychiatry 41:233–244
5. Dodd B (1975) Recognition and reproduction of words by down’s
syndrome and non-down’s syndrome retarded children. Am J Ment Defic 80:306–311
6. Fowler A, Gelman R, Gleitman LR (1994) The course of language
learning in children with Down syndrome. In: Tager-Flusberg H (ed) Constraints on language acquisition studies of atypical chil-dren. NJ Lawrence Erlbaum Associates, Hillsdale
7. Baddeley A, Jarrold C (2007) Working memory and Down
syn-drome. J Intellect Disabil Res 51:925–931
8. Carr J (1970) Mental and motor development in young mongol
children*. J Intellect Disabil Res 14:205–220
9. Engidawork E, Lubec G (2003) Molecular changes in fetal Down
syndrome brain. J Neurochem 84:895–904
10. Guihard-Costa A-M et al (2006) Biometry of face and brain in
fetuses with trisomy 21. Pediatr Res 59:33–38
11. Jernigan TL, Bellugi U (1990) Anomalous brain morphology on
magnetic resonance images in Williams syndrome and Down
syn-drome. Arch Neurol 47:529–533
12. Pinter J et al (2001) Amygdala and hippocampal volumes in
chil-dren with Down syndrome: a high-resolution MRI study.
Neurology 56:972–974
13. Kates WR et al (2002) Cerebral growth in fragile X syndrome: review
and comparison with Down syndrome. Microsc Res Tech 57:159–167
14. Śmigielska-Kuzia J et al (2011) A volumetric magnetic resonance
imaging study of brain structures in children with down syndrome. Neurol Neurochir Pol 45:363–369
15. Onorati P et al (2013) Whole-brain voxel-based morphometry study of
children and adolescents with down syndrome. Funct Neurol 28:19
16. Condoluci C, Onorati P, Albertini G (2009) Gait analysis and
cere-bral volumes in down’s syndrome. Funct Neurol 24:147
17. Menghini D, Costanzo F, Vicari S (2011) Relationship between brain
and cognitive processes in down syndrome. Behav Genet 41:381–393
18. Lee NR, Adeyemi EI, Lin A et al (2015) Dissociations in cortical
morphometry in youth with down syndrome: evidence for reduced
surface area but increased thickness. Cereb Cortex 26:2982–2990
19. Adeyemi EI, Giedd JN, Lee NR (2015) A case study of brain
morphometry in triplets discordant for down syndrome. Am J
Med Genet A 167:1107–1110
20. Fischl B (2012) FreeSurfer. Neuroimage 62:774–781
21. Nelson L et al (2005) Learning and memory as a function of age in
down syndrome: a study using animal-based tasks. Prog Neuro-Psychopharmacol Biol Psychiatry 29:443–453
22. Lott IT, Dierssen M (2010) Cognitive deficits and associated
neu-rological complications in individuals with down’s syndrome.
Lancet Neurol 9:623–633
23. Basser PJ, Pierpaoli C (2011) Microstructural and physiological
features of tissues elucidated by quantitative-diffusion-tensor
MRI. J Magn Reson 213:560–570
24. Alexander AL et al (2007) Diffusion tensor imaging of the brain.
Neurotherapeutics 4:316–329
25. Powell D et al (2014) Frontal white matter integrity in adults with
down syndrome with and without dementia. Neurobiol Aging 35:
1562–1569
26. Fischl B et al (2004) Sequence-independent segmentation of
mag-netic resonance images. Neuroimage 23:S69–S84
27. Romano A et al (2015) Age effects on cortical thickness in young
down’s syndrome subjects: a cross-sectional gender study.
Neuroradiology 57:401–411
28. Esposito G et al (2008) Genomic and functional profiling of human
down syndrome neural progenitors implicates S100B and
aquapo-rin 4 in cell injury. Hum Mol Genet 17:440–457
29. Karlsen AS, Pakkenberg B (2011) Total numbers of neurons and
glial cells in cortex and basal ganglia of aged brains with down
syndrome—a stereological study. Cereb Cortex 21:2519–2524
30. Anderson JS et al (2013) Abnormal brain synchrony in down
syn-drome. NeuroImage: Clin 2:703–715
31. Teipel SJ et al (2003) Relation of corpus callosum and hippocampal
size to age in nondemented adults with down’s syndrome. Am J
Psychiatr 160:1870–1878
32. Jeringan T, Bellugi U, Sowell E (1993) Cerebral morphological
distinctions between William's and down’s syndromes. Arch
Neurol 50:186–191
33. Strick PL, Dum RP, Fiez JA (2009) Cerebellum and nonmotor
function. Annu Rev Neurosci 32:413–434
34. Chukwudelunzu F et al (2001) Extensive metabolic and
neuropsycho-logical abnormalities associated with discrete infarction of the genu of the internal capsule. J Neurol Neurosurg Psychiatry 71:658–662
35. Rosenberger G et al (2012) Anterior limb of the internal capsule in
schizophrenia: a diffusion tensor tractography study. Brain Imaging Behav 6:417–425
36. Shukla DK et al (2010) White matter compromise of callosal and
subcortical fiber tracts in children with autism spectrum disorder: a diffusion tensor imaging study. Journal of the American Academy of Child & Adolescent Psychiatry 49:1269–1278, e2
37. Guillery R, Sherman SM (2002) Thalamic relay functions and their
role in corticocortical communication: generalizations from the vi-sual system. Neuron 33:163–175
38. Anderson JS et al (2015) Violence: heightened brain attentional
network response is selectively muted in down syndrome. J Neurodev Disord 7:1
39. Carlesimo GA, Marotta L, Vicari S (1997) Long-term memory in
mental retardation: evidence for a specific impairment in subjects
with down's syndrome. Neuropsychologia 35:71–79
40. Frenkel S, Bourdin B (2009) Verbal, visual, and spatio‐sequential
short‐term memory: assessment of the storage capacities of children
and teenagers with down's syndrome. J Intellect Disabil Res 53:
152–160
41. Vicari S, Bellucci S, Carlesimo GA (2006) Evidence from two
genetic syndromes for the independence of spatial and visual
work-ing memory. Dev Med Child Neurol 48:126–131
42. Ortibus E et al (2012) Integrity of the inferior longitudinal
fascicu-lus and impaired object recognition in children: a diffusion tensor
imaging study. Dev Med Child Neurol 54:38–43
43. Bashat DB et al (2007) Accelerated maturation of white matter in
young children with autism: a high b value DWI study. Neuroimage
37:40–47
44. Li Q et al (2010) Increased fractional anisotropy in white matter of
the right frontal region in children with attention-deficit/hyperactiv-ity disorder: a diffusion tensor imaging study. Neuroendocrinol Lett 31:747
45. Engvig A et al (2012) Memory training impacts short‐term changes
in aging white matter: a longitudinal diffusion tensor imaging study.
Hum Brain Mapp 33:2390–2406
46. Tavor I, Hofstetter S, Assaf Y (2013) Micro-structural assessment
of short term plasticity dynamics. Neuroimage 81:1–7
47. Chan KC et al (2011) In vivo manganese-enhanced MRI and
dif-fusion tensor imaging of developing and impaired visual brains. In: 2011 Annual International Conference of the IEEE Engineering in Medicine and Biology Society. IEEE. p. 7005-7008