Contents lists available atScienceDirect
Am J Otolaryngol
journal homepage:www.elsevier.com/locate/amjoto
Evaluation of the possible e
ffect of magnetic resonance imaging noise on
peripheral hearing organ with the otoacoustic emission
Cevahir Bulut Turay
a, Fulya Ozer
b,⁎, Tulin Yildirim
c, Seyra Erbek
b aBaskent University, Faculty of Medicine, Department of Audiology, TurkeybBaskent University, Faculty of Medicine, Department of Otolaryngology Head Neck Surgery, Turkey cBaskent University, Faculty of Medicine, Department of Radiology, Turkey
A R T I C L E I N F O
Keywords:
Magnetic resonance imaging (MRI) Hearing
High frequency audiometry
Transient Evoked Otoacoustic Emissions (TEOAE)
Distortion Product Otoacoustic Emissions (DPOAE)
A B S T R A C T
Purpose: The aim of this study is to evaluate the effect of noise produced by magnetic resonance imaging (MRI) device on hearing by using objective and subjective audiological assessments.
Methods: A total of 38 patients between the ages of 18 and 50 without hearing loss, and had performed MRI for brain, head, neck or cervical imaging were included in this prospective clinical study. Pure tone audiometry, speech audiometry, high frequency audiometry, transient evoked otoacoustic emissions (TEOAE) and distortion product otoacoustic emission (DPOAE) were performed before and after MRI.
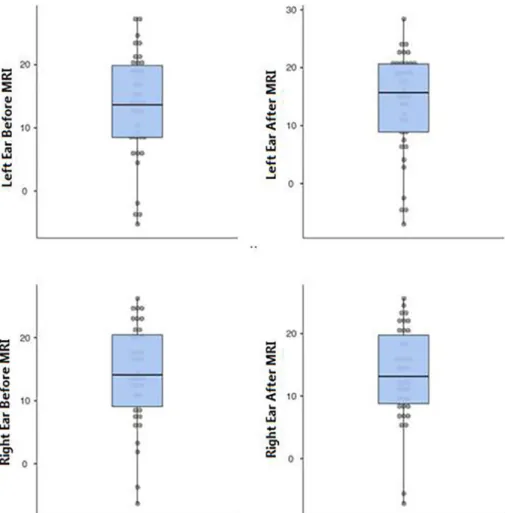
Results: There was no statistically significant difference in TEOAE, pure tone audiogram, high frequency audiogram and speech audiogram thresholds. In DPOAE, the median value before and after MRI at the frequency of the left ear at 4.0 kHz was 13.6 (8.5–19.9) and 15.7 (8.9–20.7) SNR respectively (p > .05). The median value before MRI at the right ear 4.0 kHz frequency was 14.1 (9.1–20.5) SNR, whereas the median value after MRI was 13.2 (8.8–19.8 SNR (p = 0,03). There was no statistically significant difference in other frequencies in DPOAE. Conclusions: This is thefirst objective study that examines the MRI noise on speech audiometry and otoacoustic emission together. However, the effect of MRI noise on hearing pathway is still doubt. Based on the difference at 4 kHz frequency on DPOAE; on-earphones may not sufficiently protect the patients from the MRI noise and this issue should deserve further research.
1. Introduction
Exposure to loud sound is known to cause irreversible sensorineural hearing loss. According to the World Health Organization, in developed and developing countries, the most appropriate exposure for occupa-tional noise is 8- h day at 85 dB(A) [1]. Noise above this limit is known to pose a risk for permanent hearing loss [2]. In fact in new studies, it has been showed that moderate noise levels that were previously con-sidered to be non-damaging can cause permanent changes in the phy-siology of auditory system [3].
Sensorineural changes occurring in pure tone thresholds due to noise are classified as temporary threshold shift or permanent threshold shift. Temporary threshold shift can be defined as a decrease in auditory sensitivity lasting 16–48 h following noise exposure [4]. During this period, auditory discrimination of the persons may be impaired and complain about tinnitus. Whether this threshold shift is temporary or permanent should be retested at the earliest 3 weeks, preferably
1 month later [5]. Temporary threshold loss resulting from noise ex-posure at a young age may cause degeneration in the cochlear nerve and cochlear synaptopathy, leading to an earlier date of age-related hearing loss [6].
Magnetic resonance imaging (MRI) is a frequently used imaging method in many parts of the medicalfield. Our country is the one of the countries that uses MRI frequently for diagnosis and follow-up. In MRI, gradient windings consisting of three sets of coils perpendicular to each other are used to enable the magnetic resonance signal to be encoded in three dimensions. The sounds heard during imaging are caused by the vibration of these gradient windings [7]. Wagner et al. [8] showed that MRI produces sound pressure at 86.5 dBA level and this pressure can increase up to 120 dBA. This loud noise of MRI may cause temporary or permanent threshold shift.
Otoacoustic emissions (OAEs) are sounds from the outer hair cells of the cochlea that respond to auditory stimulation, which can be recorded from a probe inserted in the outer ear canal. OAEs have been shown to
https://doi.org/10.1016/j.amjoto.2020.102586
Received 8 April 2020
⁎Corresponding author at: Baskent University, Adana Teaching and Medical Research Center, Department of Otorhinolaryngology Head and Neck Surgery, Baraj
Yolu 1, Durak, 01150, Seyhan, Adana, Turkey. E-mail address:[email protected](F. Ozer).
Available online 20 June 2020
0196-0709/ © 2020 Elsevier Inc. All rights reserved.
be highly correlated with pure tone audiometry and self-reporting hearing loss [9]. High frequency audiometry (HFA) can provide early detection of noise-induced cochlear dysfunction before any problem is detected in the audiogram [8,10]. HFA is more sensitive than the standard audiometry in evaluating the cochlear reserve and provides early detection of auditory pathology [11]. Speech audiometry using speech signals examines whether speech processing and perception ability are affected by disorders of the middle ear, cochlea, auditory nerve, brainstem pathway and auditory cortex. Accurate speech re-cognition requires both auditory and cognitive processes [12].
The aim of our study is to investigate of possible effect of the noise emitted by the MRI device on hearing by using objective (Transient Evoked Otoacoustic Emission, Distortion product otoacoustic emission) and subjective (high frequency and standart pure tone audiometry and speech audiometry) methods in healthy hearing individuals undergoing magnetic resonance imaging.
2. Material method
All patients who had brain, head, neck and cervical imaging and accepted to participate in the study were included in the study in the department of Radiology within 1 month after the approval. Written consent form was obtained from all participants.
1. Criteria for inclusion of patients in the study;
•
Being investigated with MRI for brain, head, neck or cervical ima-ging,•
Being between the ages of 18 and 50,•
Being normal otoscopic examination,•
Having never had ear surgery before,•
Not having any middle ear pathology (negative pressure, excessive flexibility, ossicular fixation, otitis media etc.)•
Having type A tympanogram•
Outpatient examination and treatment•
Having a normal audiogram 2. Criteria for exclusion in the study;•
Being under the age of 18 and over the age of 50,•
Being abnormal otoscopic examination,•
Having any middle ear pathology (negative pressure, excessive flexibility, ossicular fixation, otitis media etc.)•
Having a history of ear surgery•
Tympanogram except type A•
Inpatient and high morbidity patients•
Patients using ototoxic drugs 3. Audiological evaluationAll participants were undergone otolaryngological examination and tympanometric assessment, TEOAE, DPOAE, high frequency and speech audiometry tests before and after magnetic resonance imaging.
Acoustic Immitansmetry (GSI, Grason Stadler Tympstar Version 2, ABD); A probe is placed in the external auditory canal of patient. The sound is sent at 226 Hz, 85 dB SPL intensity, and the manometer por-tion changes the air pressure in the external ear canal between +200 daPa and− 400 daPa. Tympanogram and static admittance were re-corded and Type A was accepted for inclusion criteria.
Pure Tone Audiometry with High frequency (Interacoustics AC 40 ®, Denmark); The patients have been pure tone audiometry and speech audiometry in the quiet cabin with the standard of Industrial Acoustic Company (IAC). As a rule, the mean frequency of speech frequencies (0.5–4 kHz) was between 0 and 20 dB was accepted for inclusion cri-teria. Airway hearing levels were determined using TDH-39 Telephonic HB-7 headphones at frequencies between 250 and 8000 Hz, and
hearing thresholds at frequencies between 10,000, 12,000, 14,000 and 16,000 Hz using MX 41 headphones.
Speech Audiometry (Interacoustics AC 40 ®, Denmark); In speech audiometry, Speech Recognition Threshold (SRT) and Speech Recognition Score (SR score) or Speech Discrimination Scores (SDS) are usually used. SRT examines at what level the 50% of the speech sti-mulus (usually numbers or spondaic words) is repeated correctly. SDS represents the number of words correctly repeated from monosyllable word list and is expressed as a percentage of correct (discrimination score).
Otoacoustic emission (Otodynamics ILOV6 software, UK); TEOAE and DPOAE mode were used. Measurements were made in a quiet cabin. During the measurement of TEOAE (1000–4000 Hz), the stimulus in-tensity was 80 ± 3 dB SPL and the resulting transient impulses were averaged 260 times. If the reproducibility is 50–60% or more and the signal to noise ratio is at least three frequencies above 3 dB, the results were considered as “response present”. During the measurement of DPOAE (1000–8000 Hz), if the signal to noise ratio is at least 3 dB, the results were accepted“normal”.
4. Magnetic resonance imaging and noise measurement
Magnetic resonance imaging was performed with 1.5 Tesla Magnetom, Avanto device (Siemens, Germany) and 1.5 Tesla Magnetom, Siemens Symphony Tim (Siemens, Germany) devices. Noise measurement was done with Svan 971 (Svantek, Poland). It is a sound level measuring device with type 1, 1/1 and 1/3 octave real-time analysis according to IEC 61672: 2002. Measurements were performed in fast mode in 1/3 octave band usingfilter A and peak C for values. 5. Statistical analysis
The analysis was carried out using the R Project programming language (Version:“R.1.7.1 for Mac OS X”) [13,14]. Shapiro Wilk test was used to investigate whether the datafit the normal distribution. Quantitative datafitting the normal distribution are expressed as mean and standard deviation and expressed as the median and interquartile range (IQR) if the quantitative data do notfit the normal distribution. Because it was not assumed that the distribution of variables was normal, Wilcoxon Signed Rank Test was used to compare hearing test values performed before and after MRI measurement (for TEAOE and DPOAE in the direction of increasing for High Frequency). 95% con-fidence level was determined as test statistics; therefore p-value statis-tics were compared with 0.05 value.
6. Results
38 patients were included in the study (19 Female/19 Male). The mean age of participants was 38.47(min 19-max 50). MRI was per-formed on the brain in 21 patients, cervical in 7 patients, neck in 4 patients, and 6 in both brain and cervical region. 13 patients had ga-dolinium contrast and the remaining 25 patients received non-contrast imaging. The mean duration of patients to stay on the device was de-termined as 17.97 min (min10-max 36). The equivalent sound pressure level in the noise measurement with Svan 971 during imaging ranged from 91.1 to 106.7 dBA.
6.1. In TEOAE
The median value before the MRI of the left ear was 15.3 (13.0–17.5) SNR, whereas the median value after MRI was 16.2 (14.0–18.5) SNR (p > .05). The median value before the MRI of the right ear was 15.6 (14.1–18.8) SNR, whereas the median value after MRI was 16.3 (12.9–19.5) SNR (p > .05).Table 1shows the mean, median, minimum, maximum and quarterly values width (25% -75%) of TEOAE before and after MRI of all frequencies.
6.2. In DPOAE
While the median value before MRI at the frequency of the right ear at 4.0 kHz was 14.1 (9.1–20.5) SNR, the median value after MRI was 13.2 (8.8–19.8) SNR (p < 0. 05) and it was found statistically sig-nificant. In the DPOAE test, measurements made before and after MRI at all other frequencies were not significant.Fig. 1shows DPOAE values before and after MRI in the right and left ears andTable 2shows the DPOAE mean, median, minimum, maximum and quarter values width (25% -75%) before and after MRI of all frequencies.
It was observed that there was no difference when DPOAE mea-surements were examined in MRI patients taken with or without con-trast. It is observed that Gadolinium contrast agent has no effect on hearing (Table 3).
6.3. In PTA with high frequency
When the frequencies of 250 Hz−8 kHz were examined before and after MRI in pure tone audiometry, no statistically significant difference was found. In the extended high frequencies (9 kHz - 16 kHz) measured by replacing the headphones, again no difference was observed in the evaluation before and after MRI. Table 4shows the PTA with high frequency mean, median, minimum, maximum and quarterly values width (25% -75%) before and after MRI of all frequencies.
6.4. In speech audiometry
Speech Reception threshold (SRT) and speech discrimination scores (SDS) were evaluated. The median value of SRT before MRI in the left ear was 5 (0−10) dB, whereas the median value after MRI was 5 (0–10) dB (p > .05). The median value of SRT before MRI in the right ear was 5 (0–10) dB, whereas the median value after MRI was 5 (0–10) dB (p > .05). The mean value of SDS before MRI in the left ear was 99,2%; while the mean value after MRI was 99,6% (p > .05). The mean value of SDS before MRI in the right ear was 99,5%, whereas the mean value after MRI was 99,4% (p > .05). These values were not found statistically significant.
7. Discussion
Magnetic resonance wasfirst used by Paul Lauterbur in 1973 as a method of imaging. The patient is placed in afixed magnetic field, that is, a strong magnet. Today, the commonly used MRI devices are 0.5–3 T. Protons in the body line up parallel or anti parallel to the vector of the magnet and spin. Radio waves sent later produce devia-tions in hydrogen atoms containing a single proton in the nucleus. After the radio wave is cut, the protons return to their former positions and return the energy they received, and this energy is converted into sig-nals and images through the receiver. Hydrogen atoms, which are the basic atoms of water and fatty tissues, can be used in MRI because of these properties [15].
Lorentz force is the force that created by protons is proportional to both the gradient current and the static magneticfield. The currents create a field that opposes the static field, creating a real force that pushes against the staticfield. The gradient currents do not create a Lorentz force without a staticfield. With the static field on, these forces result in the microvibration of the materials in the gradient and these vibrations move with the applied current of the gradients. These mi-crovibrations act similarly as an acoustic speaker, acting against the large static magneticfield [7]. Although it changes, Magnetic resonance imaging can be very noisy; at times, acoustic levels can exceed 100–120 dBA [8,16]. Hattori et al. compared the noises of 1.5 Tesla and 3 Tesla MRI sequences in a study and found that 3 Tesla MRI was much louder by exceeding with mean of 99 dB with maximum 130.7 dB in all se-quences [17]. The maximum noise level of the 1.5 Tesla MRI was previously reported as 121–131 dB [18]. Therefore, it can be said that MRI sequences emit considerable noise regardless of 1.5 or 3 Tesla.
The American National Institute for Occupational Health and Safety (NIOHS) considers that exposure to noise of 115 dB or more and persists more than 15 min is dangerous [19]. Temporary threshold shift is de-scribed by NIOHS as an increase of 15 dB at 500, 1000, 2000, 3000, 4000 or 6000 Hz in 2 consecutive audiometric measurements [5]. The characteristic audiometric finding of noise-induced hearing loss is 4000 Hz notching and increased hearing thresholds at 4000–6000 Hz and neighboring frequencies [19]. The reason of 4000 Hz is that the center frequency of the stimulus sent to the outer ear canal is mostly displaced on the basilar membrane at half- octave frequency. The central frequency of the noise is about 3200 Hz. The noise stimulus,
Table 1
Transient evoked otoacoustic emission results.
n mean SD median 25% 75% Min Max Wilcoxon Statistic P
Left Ear 1 kHz MRI Before /After
38 19,1 7,0 19,5 14,3 23,7 5,5 32,2 279,5 0,86
38 20,3 6,7 20,1 15,4 26,4 3,9 32,6
Right Ear 1 kHz MRI Before /After
38 19,9 5,8 18,5 17,2 23,6 10,3 33,3 382,5 0,43
38 19,7 6,8 19,6 16,6 23,6 8,8 36,1
Left Ear 1,4 kHz MRI Before /After
38 21,4 6,1 22,3 17,2 25,5 8,2 34,9 317,5 0,78
38 22,0 4,9 22,7 19,2 25,2 11,0 32,1
Right Ear 1,4 kHz MRI Before /After
38 21,0 6,0 21,2 17,0 25,6 7,1 33,1 322 0,67
38 21,3 6,1 22,4 16,7 25,9 6,0 30,1
Left Ear 2 kHz MRI Before /After
38 18,0 5,1 18,2 14,9 21,0 6,5 26,8 258,5 0,92
38 18,7 5,4 18,6 16,0 22,7 6,3 31,5
Right Ear 2 kHz MRI Before /After
38 18,2 3,7 18,2 16,0 20,1 7,8 28,3 311,5 0,63
38 18,5 4,4 18,6 16,0 21,1 7,9 26,8
Left Ear 2,8 kHz MRI Before /After
38 13,2 4,9 12,7 10,6 16,1 3,5 23,3 346 0,64
38 13,3 6,1 14,5 9,3 16,5 -2,4 26,1
Right Ear 2,8 kHz MRI Before /After
38 14,7 6,3 15,1 11,3 18,6 −1,0 26,0 311,5 0,63
38 14,7 6,2 15,8 11,5 18,1 -1,7 25,1
Left Ear 4 kHz MRI Before /After
38 10,2 5,2 10,5 7,0 14,1 -1,0 22,9 281 0,79
38 10,5 4,6 10,1 6,7 14,5 2,7 18,8
Right Ear 4 kHz MRI Before /After
38 11,8 6,1 11,8 7,3 16,3 3,1 25,8 423,5 0,22
38 11,5 5,9 11,3 7,6 14,0 0,8 25,0
Total Response Left Ear MRI Before /After
38 15,5 3,4 15,3 13,0 17,5 8,8 23,3 205 0,99
38 16,3 3,2 16,2 14,0 18,5 10,0 23,3
Total Response Right Ear MRI Before /After
38 15,9 3,6 15,6 14,1 18,8 8,4 22,7 319,5 0,69
Fig. 1. DPOAE 4000 Hz values before and after MRI in right and left ears.
Table 2
Distortion product otoacoustic emission results.
n mean SD median 25% 75% Min Max Wilcoxon Statistic P-Value
Left Ear 1 kHz MRI Before /After
38 5,5 6,8 4,8 1,8 9,2 −5,2 21,0 292,5 0,81
38 6,1 7,0 5,6 0,3 11,7 −7,0 18,6
Right Ear 1 kHz MRI Before /After
38 6,6 8,3 7,4 −0,2 12,6 −9,7 25,2 391,5 0,38
38 7,2 7,3 5,8 0,7 12,5 −6,0 24,9
Left Ear 1,4 kHz MRI Before /After
38 13,5 8,2 13,5 6,5 19,9 −1,8 28,9 275 0,88
38 13,8 8,4 13,6 6,9 21,4 −4,0 28,2
Right Ear 1,4 kHz MRI Before /After
38 14,8 7,9 13,3 8,9 19,8 −1,4 32,3 467 0,08
38 14,5 7,5 13,9 9,9 19,0 −2,0 29,7
Left Ear 2 kHz MRI Before /After
38 13,8 7,4 13,0 9,0 18,9 −1,3 28,4 357,5 0,57
38 14,0 7,2 14,1 9,4 19,3 −5,0 28,9
Right Ear 2 kHz MRI Before /After
38 14,4 8,9 14,5 9,2 20,4 −1,8 33,0 420,5 0,23
38 14,2 9,1 14,9 8,6 21,2 −6,2 32,5
Left Ear 2,8 kHz MRI Before /After
38 11,1 8,0 11,8 4,8 17,1 −6,5 28,2 312,5 0,80
38 11,7 8,4 12,1 6,4 17,9 −9,1 28,5
Right Ear 2,8 kHz MRI Before /After
38 12,7 7,4 12,8 8,2 17,7 −5,6 27,4 435,5 0,10
38 12,3 6,4 12,1 7,5 16,6 −3,2 26,2
Left Ear 4 kHz MRI Before /After
38 13,3 8,4 13,6 8,5 19,9 −5,2 27,5 279 0,91
38 13,9 8,9 15,7 8,9 20,7 −7,0 28,4
Right Ear 4 kHz MRI Before /After
38 14,2 7,9 14,1 9,1 20,5 −6,3 26,2 473,5 0,03*
38 13,5 7,6 13,2 8,8 19,8 −7,2 25,6
Left Ear 6 kHz MRI Before /After
38 11,9 9,1 14,2 7,0 17,7 −8,8 29,0 284,5 0,89
38 12,5 9,2 14,8 8,3 18,3 −8,3 28,4
Right Ear 6 kHz MRI Before /After
38 14,0 10,1 15,5 7,1 21,8 −9,0 32,6 432 0,11
38 13,2 10,7 15,8 5,8 20,9 −9,1 32,3
Left Ear 8 kHz MRI Before /After
38 2,8 8,9 3,6 −5,4 7,1 −10,2 30,6 402,5 0,32
38 2,2 9,9 1,4 −4,4 9,2 −15,4 27,5
Right Ear 8 kHz MRI Before /After
38 2,4 11,3 −1,4 −6,4 11,3 −16,7 27,5 301,5 0,84
which creates an average resonance frequency of 3000 Hz on the outer ear canal, shows its effect on the frequency of 4000 Hz, which corre-sponds to the half-octave frequency [2].
In our study, we aimed to investigate whether the noise created by the MRI device affects healthy hearing individuals who enter the magnetic resonance imaging device. We found the ambient noise as equivalent sound pressure level on average between 91.1 and 106.7 dBA during imaging. The mean duration of patients in MRI scans was determined as 17.97 min (min10-max 36). Situations such as the combination of brain and neck MRI studies in the same patient and/or contrast enhancement seemed to increase this mean time slightly. TEOAE, DPOAE, pure tone audiometry and high frequency audiometry tests were applied before and after exposure to noise created by MRI device. We did not detect any deterioration of 15 dB or more in any patient at a frequency of 4 kHz. No patient had 15 dB or more dete-rioration in any ears with frequencies adjacent to 4 kHz (2–6 kHz). However, significant effect after MRI noise was observed in DPOAE measurements at the right ear at 4 kHz.
When studies on the effect of noise arising on MRI in the literature are examined, the first noticeable publications are cases of sudden hearing loss after MRI. After reporting these cases, the effect of MRI noise began to be examined. Mollasadeghi et al. [20] published a pa-tient with age of 29 who entered the cranial 1.5 Tesla MRI device due to headache. The patient did not use ear protector for 25 min during his stay on MRI device. He applied with complaints of tinnitus and hearing
loss 2 days after the examination. Flat sound hearing loss was detected in the pure tone audiogram. In addition, notching was observed in the right ear at 4 kHz. Hearing thresholds did not improve 2 months after the initial application.
One of thefirst studies evaluating the effects of MRI on hearing is from Brummet et al. [21] that found MRI can cause temporary threshold shift in a significant number of patients and these losses can be prevented by headphones. In this study, they did not use objective test material and use only pure tone audiometry not high frequency.
Lim et al. [18] studied 35 patients who underwent 3 Tesla MRI in the head and neck region. They applied high frequency audiometry up to 14 kHz before and 1 h after MRI. Patients used in-ear protection (3 M ear plugs) during MRI. They did notfind a significant difference be-tween hearing thresholds before and after MRI. The limitations of this study include the absence of an examination beyond 14 kHz (16 kHz and 20 kHz), and no objective measurement such as OAE or ABR.
Bahaloo et al. [22] evaluated the effects of 1.5 Tesla MRI on 33 patients by performing pure tone audiometry in the range of 0.5 kHz–16 kHz. In their measurements 1 h after MRI, they found that the highest threshold shifts in both ears were 4 kHz, 6 kHz and 14 kHz. However they showed that the threshold shifts were completely cured after 24 h and there was no permanent threshold shift in any patient. In our study, we used also high frequency audiometry test. In addition, we looked at OAE values differently from these authors to show the effect of noise objectively. However, we called our patients for test repetition after 1 week, since the incoming participants are few, we could not evaluate whether the changes are temporary or permanent after the noise in our patients.
It has been shown that temporary threshold shift after 3 Tesla MRI resolves after 3 days but tinnitus is much longer [5,23]. Actually, we did not apply a questionnaire for tinnitus evaluation before and after MRI.
Radomskij et al. [24] divided patients who entered the 1.5 Tesla MRI device into two groups with and without headphones. Using TEOAE, patients who did not wear ear protectors showed changes in their hearing thresholds with an average of 1.84 dB. In our study, all of our patients used on-ear headphones and we did not divide patients into two groups, whether using headphones or not, for ethical reasons. After MRI we found a difference of 0.8 dB in the right ear and 0.2 dB in the
Table 3
DPOAE test results according to the use of contrast non-contrast material (76 ears in total).
DPOAE Kontrastlı Kontrastsız
Frequency p Wilcoxon statistic p Wilcoxon statistic
1 kHz 0.400 185.5 0.682 475.5 1,4 kHz 0.111 223.5 0.662 480.5 2 kHz 0.540 171.5 0.235 606.5 2,8 kHz 0.672 158 0.269 572 4 kHz 0.634 162 0.155 607.5 6 kHz 0.254 201.5 0.554 505.5 8 kHz 0.729 151.5 0.689 495.5 Table 4
High frequency audiometry results.
n Ort. SD Ortanca 25% 75% Min Max Wilcoxon Statistic P-Value
Left Ear 9000 Hz MRI Before /After
38 14,5 16,4 12,5 1,3 20,0 0,0 65,0 63,5 0,91
38 13,4 15,0 10,0 0,0 20,0 0,0 55,0
Right Ear 9000 Hz MRI Before /After
38 16,1 14,4 10,0 10,0 25,0 0,0 65,0 206 0,96
38 14,6 15,0 10,0 5,0 23,8 0,0 60,0
Left Ear 10,000 Hz MRI Before /After
38 16,3 17,1 10,0 5,0 23,8 0,0 65,0 137 0,90
38 15,3 17,7 10,0 0,0 20,0 0,0 70,0
Right Ear 10,000 Hz MRI Before /After
38 18,2 17,3 15,0 5,0 25,0 0,0 70,0 75 0,93
38 17,0 17,8 10,0 5,0 25,0 0,0 75,0
Left Ear 11,200 Hz MRI Before /After
38 22,1 19,7 20,0 6,3 33,8 0,0 80,0 143,5 0,85
38 21,4 19,4 20,0 5,0 33,8 0,0 80,0
Right Ear 11,200 Hz MRI Before /After
38 24,6 21,5 20,0 5,0 35,0 0,0 80,0 133,5 0,44
38 24,6 20,8 20,0 10,0 35,0 0,0 80,0
Left Ear 12,500 Hz MRI Before /After
38 28,8 23,3 27,5 10,0 43,8 0,0 80,0 152 0,81
38 28,2 22,3 25,0 10,0 40,0 0,0 85,0
Right Ear 12,500 Hz MRI Before /After
38 29,2 24,0 27,5 10,0 43,8 0,0 85,0 104 0,92
38 27,6 23,0 25,0 6,3 40,0 0,0 80,0
Left Ear 14,000 Hz MRI Before /After
38 37,4 24,5 40,0 15,0 55,0 0,0 80,0 96,5 0,37
38 37,2 23,6 40,0 16,3 53,8 0,0 80,0
Right Ear 14,000 Hz MRI Before /After
38 39,5 23,9 40,0 25,0 55,0 0,0 80,0 99 0,73
38 38,7 23,8 40,0 21,3 55,0 0,0 75,0
Left Ear 16,000 Hz MRI Before /After
34 36,1 17,3 40,0 27,5 53,8 0,0 60,0 72,0 0,50
32 35,3 17,8 40,0 25,0 46,3 0,0 60,0
Right Ear 16,000 Hz MRI Before /After
31 39,5 19,4 40,0 32,5 55,0 0,0 60,0 37,0 0,90
31 39,5 19,3 45,0 32,5 55,0 0,0 60,0
left ear in TEOAE. This difference was not statistically significant. In our study, DPOAE and pure tone audiometry were evaluated in addition to TEOAE. As a result of our DPOAE measurements, we found the sig-nificant difference between before and after measurement at 4 kHz, the frequency most affected by hearing loss due to noise, suggests that there may be an effect even in patients wearing on-ear headphones.
Jin et al. [25] investigated the effects of MRI noise on patients with in-ear headphone with ABR and they found that in case of proper protection with in-ear headphones, threshold shifts are not permanent. These studies and our study indicate that the on-ear headphones used during MRI may not be as successful as we think in protecting patients from noise. There is a need for new studies on whether the in-ear protectors will be more effective.
In our study, unlike DPOAE, we did notfind temporary threshold shift in audiometry. Wagner et al. also did notfind difference with PTA in their study. They performed DPOAE tests with pure tone audiometry before and after MRI in 126 patients (244 ears) who entered the 1.5 Tesla head neck and thorax MRI device. In DPOAE measurements, they found an amplitude change in 48% of the ears [8]. The detection of latent changes that cannot be detected in subjective audiometric eva-luation like PTA and these results show us that OAE is a more reliable test in evaluating acoustic trauma.
Hair cell damage after noise starts within minutes after exposure and may continue for days [26]. Hair cell death may not always occur in the transient threshold shift. Structural changes related to glutamate may be also observed in cochlear nerve synapses and cochlear neurons [27]. This situation manifests as a reduction in amplitude of wave I in the ABR [26]. Actually, we did not apply the ABR test and so that we could not predict the damage of neurons together with hair cells in our study. This can be considered as one of the limitations of our study.
Venn et al. [28] conducted animal studies on dogs to investigate the effects of the MRI device on cochlear function. They put 36 dogs in 1.5 Tesla MRI device under general anesthesia. It was observed in 17 dogs as a control group. They performed DPOAE (between 1 kHZ-8 kHz) test before and after MRI. They found a decrease in hearing at all fre-quencies in the MRI group. However, it has not been investigated whether this threshold shift is permanent and the ear protection is not applied to animals during MRI. There is a need for studies with ex-perimental animals that examine the effects of MRI on the cochlea in more detail by making measurements including high frequencies and performing electron microscopy to obtain immunohistochemical as-sessment.
When noise-induced hearing loss causes synaptopathy, the patient cannot achieve a hundred percent success in speech discrimination scores under noise [6]. In our study, we also performed speech audio-metry as well as pure tone audioaudio-metry unlike other studies. We did not find a significant difference in SRT and SDS before and after the MRI. However, we did not apply noise masking when performing speech audiometry. Synaptopathy associated with MRI noise and the diagnosis of this situation with speech in noise test remains current as a subject worth researching.
This study has some limitations. The most important ones are that a third test could not be presented in the late period after MRI and al-though both subjective and objective tests have been applied, no ABR has been applied. Other limitations are low sample size and not per-forming tinnitus evaluation with tinnitus handicap index.
Despite these limitations, to the best of our knowledge, our study is the second study using high frequency audiometry and the first one using speech audiometry in the literature to examine the effect of MRI on hearing. The study of Lim et al. [18] is thefirst study using high frequency audiometry. However, our usage of TEOAE and DPOAE, to-gether with high-frequency audiometry, increases the level of im-partiality of our study.
As a conclusion,finding a difference in DPOAE measurements at a frequency of 4 kHz, which is known to be the most affected by noise-induced hearing loss, can be predicted that the noise created by the MRI
device may have an effect on hearing even if the on-ear headphones are used. This study is a pioneering study for studies such as speech in noise test and medial olivary complex suppression test to investigate possible MRI-related cochlear synoptopathy.
Ethical approval and funding
This study was approved by Baskent Univercity Institutional Review Board (Project no:KA19/348) and supported by Baskent Univercity Research Fund.
Informed consent
Written consent form was obtained from all participants. CRediT authorship contribution statement
Cevahir Bulut Turay: Conceptualization, Methodology, Data curation.Fulya Ozer: Software, Writing - review & editing. Tulin Yildirim: Data curation. Seyra Erbek: Methodology, Visualization, Supervision.
Declaration of competing interest
The authors declare that they have no conflict of interest. References
[1] Yang B, Wong E, Ho WH, Lau C, Chan YS, Wu EX. Reduction of sound-evoked midbrain responses observed by functional magnetic resonance imaging following acute acoustic noise exposure. J Acoust Soc Am 2018;143(4):2184–94.https://doi. org/10.1121/1.5030920.
[2] Henderson D, Hu B, Bielefeld E. Patterns and mechanisms of noise-induced cochlear pathology. Auditory trauma, protection, and repair. Springer; 2008. p. 195–217. [3] Fischl MJ, Ueberfuhr MA, Drexl M, Pagella S, Sinclair JL, Alexandrova O, et al.
Urocortin 3 signaling in the auditory brainstem aids recovery of hearing after re-versible noise-induced threshold shift. J Physiol 2019;597(16):4341–55.https:// doi.org/10.1113/JP278132.
[4] Kirchner D, Evenson E, Dobie R, Rabinowitz P, Crawford J, Kopke R, et al. ACOEM Guidance Statement: occupational noise-induced hearing loss. J Occup Environ Med 2012;54:106–8.https://doi.org/10.1097/JOM.0b013e318242677d.
[5] Ryan AF, Kujawa SG, Hammill T, Le Prell C, Kil J. Temporary and permanent noise-induced threshold shifts: a review of basic and clinical observations. Otology & neurotology: official publication of the American Otological Society, American Neurotology Society [and] European Academy of Otology and Neurotology 2016;37(8):e271.https://doi.org/10.1097/MAO.0000000000001071. [6] Campbell K, Hammill T, Hoffer M, Kil J, Le Prell C. Guidelines for auditory
threshold measurement for significant threshold shift. Otol Neurotol 2016;37(8):e263–70.https://doi.org/10.1097/MAO.0000000000001135. [7] Felmlee JP. The noise of MRI. American College of Radiology 2005:547.https://doi.
org/10.1016/j.jacr.2005.02.016.
[8] Wagner W, Staud I, Frank G, Dammann F, Plontke S, Plinkert PK. Noise in magnetic resonance imaging: no risk for sensorineural function but increased amplitude variability of otoacoustic emissions. Laryngoscope 2003;113(7):1216–23.https:// doi.org/10.1097/00005537-200307000-00020.
[9] Sisto R, Cerini L, Sanjust F, Carbonari D, Gherardi M, Gordiani A, et al. Distortion product otoacoustic emission sensitivity to different solvents in a population of industrial painters. Int J Audiol 2020;8:1–12.https://doi.org/10.1080/14992027. 2019.1710776.
[10] Zadeh M, Silbert NH, Sternasty K, Swanepoel W, Hunter LL, Moore DR. Extended high-frequency hearing enhances speech perception in noise. Proc Natl Acad Sci U S A 2019;116(47):23753–9.https://doi.org/10.1073/pnas.1903315116.
[11] Somma G, Pietroiusti A, Magrini A, Coppeta L, Ancona C, Gardi S, et al. Extended high-frequency audiometry and noise induced hearing loss in cement workers. Am j of Ind Med 2008;51(6):452–62.https://doi.org/10.1002/ajim.20580.
[12] Holder JT, Levin LM, Gifford RH. Speech recognition in noise for adults with normal hearing: age-normative performance for AzBio, BKB-SIN, and Quick SIN. Otol Neurotol 2018;39(10):e972–8.https://doi.org/10.1097/MAO.
0000000000002003.
[13] Fox J, Weisberg S. An R companion to applied regression (third). Thousand Oaks CA 2019: Sage. Retrieved from https: //socialsciences. mcmaster. ca.
[14] Team RC. A language and environment for statistical computing. 2013. [15] Kiruluta AJM, González RG. MR imaging: deconstructing timing diagrams and
de-mystifying k-space. Handb Clin Neurol 2016;135:21–37.https://doi.org/10.1016/ B978-0-444-53485-9.00002-7.
[16] Edlestein WA, Hedeen RA, Mallozzi RP, El-Hamamsy SA, Ackermann RA, Havens TJ. Making MRI quieter. Magnetic Reson Imaging 2002;20:155–63.https://doi.
org/10.1016/s0730-725x(02)00475-7.
[17] Hattori Y, Fukatsu H, Ishigaki T. Measurement and evaluation of the acoustic noise of a 3 Tesla MR scanner. Nagoya J Med Sci 2007;69(1/2):23.
[18] Lim EYL, Tang P, Peyman M, Ramli N, Narayanan P, Rajagopalan R. 3 Tesla magnetic resonance imaging noise in standard head and neck sequence does not cause temporary threshold shift in high frequency. Eur Arch Otorhinolaryngol 2015;272(11):3109–13.https://doi.org/10.1007/s00405-014-3232-y.
[19] Hattis D. Occupational noise sources and exposures in construction industries. Hum Ecol Risk Assess Int J 1998;4(6):1417–41.
[20] Mollasadeghi A, Mehrparvar AH, Atighechi S, Davari MH, Shokouh P, Mostaghaci M, et al. Sensorineural hearing loss after magnetic resonance imaging. Case Reports in Radiology 2013;2013:510258https://doi.org/10.1155/2013/510258. [21] Brummett RE, Talbot JM, Charuhas P. Potential hearing loss resulting from
MRimaging. Radiology 1988;169(2):539–40.https://doi.org/10.1148/radiology. 1692.3175004.
[22] Bahaloo M, Davari MH, Sobhan M, Mirmohammadi SJ, Jalalian MT, Zare Sakhvidi MJ, et al. Hearing thresholds changes after MRI 1.5 T of head and neck. Radiology Research and Practice 2019;2019:8756579https://doi.org/10.1155/2019/ 8756579.
[23] Farling PA, Flynn PA, Darwent G, De Wilde J, Grainger D, King S, et al. Safety in magnetic resonance units: an update. Anaesthesia 2010;65(7):766–70.https://doi. org/10.1111/j.1365-2044.2010.06377.x. Jul.
[24] Radomskij P, Schmidt M, Heron C, Prasher D. Effect of MRI noise on cochlear function. The Lancet 2002;359:1485–6.https://doi.org/10.1016/s0140-6736(02) 08423-4.
[25] Jin C, Li H, Li X, Wang M, Liu C, Guo J, et al. Temporary hearing threshold shift in healthy volunteers with hearing protection caused by acoustic noise exposure during 3-T multisequence MR neuroimaging. Radiology 2017;286(2):602–8.
https://doi.org/10.1148/radiol.2017161622.
[26] Wang Y, Hirose K, Liberman MC. Dynamics of noise-induced cellular injury and repair in the mouse cochlea. J Assoc Res Otolaryngol 2002;3(3):248–68. [27] Kujawa SG, Liberman MC. Adding insult to injury: cochlear nerve degeneration
after“temporary” noise-induced hearing loss. J Neurosci 2009;29(45):14077–85.
https://doi.org/10.1523/JNEUROSCI.2845-09.2009.
[28] Venn R, McBrearty A, McKeegan D, Penderis J. The effect of magnetic resonance imaging noise on cochlear function in dogs. The Veterinary Journal