w w w . a a s s j o u r n a l . c o m ISSN (Online): 2322 – 4479 ISSN (Print): 2476–4981
Original Article
www.AESAsport.com Received: 02/02/2018 Accepted: 02/05/2018The Relationship between the Isocapnic Buffering Phase and
Ventilatory Threshold in Endurance Athletes and Team
Sport Athletes during an Incremental Exercise Test
1
Selcen Korkmaz Eryılmaz
*,
2Metin Polat,
3Mehmet Soyal,
4Sami Aydoğan
1School of Physical Education and Sports, Cukurova University, Adana, Turkey. 2School of Physical Education and
Sports, Erciyes University, Kayseri, Turkey. 3School of Physical Education and Sports, Istanbul Esenyurt University,
Istanbul, Turkey. 4Division of Sports Physiology, Department of Physiology, Faculty of Medicine, Erciyes
University, Kayseri, Turkey
ABSTRACT
Background. There is sparse literature examining the ICB phase of aerobic- and anaerobic-trained athletes. Measurements
of ICB phase values of athletes can help to evaluate the sport’s physiological demands and understand the physiological adaptations in response to physical training. Objectives. The purpose of this study was to examine the relationship between the isocapnic buffering (ICB) phase and the maximal oxygen uptake (VO2max) as well as the ventilatory threshold (VT) in
trained athletes. Methods. Twenty-eight male endurance athletes and forty male team sports athletes underwent an incremental treadmill test to determine their VT, respiratory compensation point (RCP), and VO2max. The ICB phase was
calculated as the difference in Oxygen uptake (VO2) between the RCP and VT and expressed in either absolute or relative
values. Results. The VO2max, maximal running speed, time to exhaustion, VO2 at the VT and RCP, running speed at the
VT, and VT expressed as % VO2max was higher in the endurance athletes than in the team sport athletes (p < 0.01), whereas
the RCP expressed as % VO2max and running speed at the RCP showed similar values in both groups (p > 0.05). Both the
absolute and relative ICB phase values were found to be significantly higher in team sports athletes than in endurance athletes (p < 0.001). The relative ICB phase was significantly negatively correlated with the VO2max (– r = 0.517, p <
0.001), the VO2 at the VT (– r = 0.755, p < 0.001), and the VO2 at the RCP (r = – 0.517, p = 0.001). Conclusion. The
current findings suggest that, for trained athletes, the magnitude of the ICB phase is more closely related to the VT rather than the VO2max and RCP. Presumably, the high-intensity intermittent-type exercises performed by team sports athletes
may have improved their buffering capacity, leading to a shift in the RCP without a change in the VT, and consequently enhancing the ICB phase.
KEY WORDS:Buffering Capacity, Maximal Oxygen Uptake, Respiratory Compensation Point, Training.
INTRODUCTION
The ventilatory threshold and respiratory compensation point have been widely used to monitor the training status of endurance athletes
and to prepare their training program by determining three training intensity zones (1). During incremental exercise, the anaerobic
threshold (AT) can be estimated from non-invasive gas exchange measurements as an alternative to measurements of the blood lactate concentration (lactate threshold), in this case referred to as the ventilatory threshold (VT) (2). The VT corresponds to the nonlinear increase in carbon dioxide production and ventilation due to the bicarbonate buffering of hydrogen ions (H+) in response to the systematic increase of blood lactate above resting values (3). As the exercise intensity is increased during an incremental exercise test, the minute ventilation (VE), carbon dioxide output (VCO2) and oxygen uptake (VO2) increase linearly until lactic acidosis develops (3). At exercise intensities above the AT, the VCO2 increases more rapidly than the VO2 due to non-metabolic CO2 production from bicarbonate buffering of lactic acid being added to the metabolic CO2 production (2,3). When H+ can no longer be compensated for by circulation, bicarbonate leads to a decrease in the blood pH and stimulates the carotid bodies to increase the ventilatory drive, which results in hyperventilation (3) Therefore, the VE initially increases in proportion to the increase in VCO2, but it starts to increase more rapidly than VCO2 with further increases in exercise intensity above the AT (2). This additional ventilatory response is called the respiratory compensation point (RCP) (4). The region between the AT and RCP is defined as the isocapnic buffering (ICB) phase and represents a phase of compensation for the exercise-induced metabolic acidosis (5). The region between the RCP and the end of exercise is defined as the phase of hypocapnic hyperventilation (HHV) (6, 7).
The length of the ICB phase may be related to buffering capacity and lactate kinetics as well as the sensitivity of the carotid bodies to exercise-induced metabolic acidosis (5, 8-10). Some researchers suggested that the ICB phase contributes to the aerobic capacity in athletes (7). On the other hand, according to some researchers, the ICB is not related to endurance performance (11). Recently, it has been shown that the relative ICB phase can be useful for predicting both the aerobic and anaerobic capacities in athletes (8).
The observation of the ICB phase during incremental exercise testing may provide useful information on the non-invasive estimation of
the buffering capacity. The length of the ICB phase in athletes from different sports may vary depending on their training regime (8,12,13). A few studies have compared the ICB phase of athletes with aerobic training to those with anaerobic training. These studies found greater lactate increases during the ICB phase in anaerobic-trained athletes versus in endurance-trained athletes (8, 12, 13). However, to our knowledge, no investigation has attempted to compare the VO2 during the ICB phase between anaerobic-trained athletes and endurance-trained athletes.
Cross-country skiing and biathlon (which combines cross-country skiing and precision shooting) are winter Olympic endurance sports. A cross-country skiing and biathlon competition often lasts for 10 to 120 minutes, which requires skiers to have a high aerobic capacity (14, 15). Aerobic endurance training has always been the major component of the training program in cross-country skiing (1, 16, 17). On the other hand, team sports, such as soccer, volleyball, basketball and handball, are complex intermittent games requiring the repetition of maximal or near maximal intensity activities interspersed with periods of low- to moderate-intensity activity, thereby utilizing both aerobic and anaerobic energy systems (18-20). Traditionally, conditioning training programs for team sport athletes include anaerobic exercises, such as resistance, speed, change of direction and plyometric training (21, 22). There is sparse literature examining the ICB phase of aerobic- and anaerobic-trained athletes. Measurements of ICB phase values of athletes can help to evaluate the sport’s physiological demands and understand the physiological adaptations in response to physical training. The purpose of this study was to examine the relationship between the ICB phase and VO2max as well as the VT in trained athletes. A secondary purpose of the study was to compare the ICB phase in team sport athletes and endurance athletes during an incremental treadmill exercise test.
MATERIALS AND METHODS
Participants. Twenty-eight male endurance
athletes (including 11 biathlon and 17 cross-country skiers) competing in international competitions and forty amateur male team sport
athletes (including 11 soccer, 13 volleyball, 6 basketball and 10 handball players) from the Turkish League volunteered to participate in the study. All athletes had trained and competed regularly for at least 3 years. The demographic characteristics of the endurance athletes and the team sport athletes are given in Table 1. The
Erciyes University Medical Faculty Ethics Committee approved this study. All testing procedures were fully explained, and written informed consent was obtained from each subject. All measurements took place at the High Altitude and Sports Science Research and Implementation Center at Erciyes University. Table 1. The physical characteristics of the endurance athletes and team sport athletes (Mean ± SD).
Endurance athletes Team sport athletes
Age (year) 17.9 ± 2.3 20.3 ± 2.8
Height (cm) 170.7 ± 5.6 182.5 ± 6.9
Body Mass (kg) 62.5 ± 7.1 73.6 ± 10
Incremental Treadmill Test. The maximal
oxygen uptake (VO2max), VT and RCP were determined from a progressive intensity and continuous effort treadmill protocol. All tests were performed on a motorized treadmill (h/p/Cosmos Quasar med, Nussdorf-Traunstein, Germany). Oxygen uptake (VO2), carbon dioxide output (VCO2) and minute ventilation (VE) were measured online using a breath-by-breath cardiopulmonary exercise testing system (Quark PFT Ergo, CosmedSrl, Rome, Italy). Before each test, ambient conditions were measured, and the gas analyzers and turbine flowmeter were calibrated with known certified gas concentrations (16 %O2, 5 %CO2, and balanced N2) and a 3 L calibration syringe, respectively, following the manufacturer’s instructions.
To make sure the athletes were properly warmed up, prepared, and accustomed to the treadmill, each participant had to warm up for 6 min at their own pace. Then, the players were allowed to stop and stretch for approximately 3 min. Following the warm-up, athletes started running at 7 km/h with speed increments of 1 km/h every min until they could no longer keep pace. Endurance athletes were tested at a constant 5% incline on a motorized treadmill, while team sport athletes were tested at a 0% incline. The athletes were instructed to run until voluntary exhaustion and were given strong verbal encouragement throughout the test to elicit their best performance.
To reduce noise in the data and to enhance the underlying characteristics, the breath-by-breath VO2 was smoothed using a five-step
average filter and then reduced to 15 s stationary averages for the incremental test. The VO2max was defined as the highest 15 s VO2 value reached during the incremental test. Achievement of the VO2max was considered as the attainment of at least two of the following criteria: 1) a plateau in the VO2 despite increasing speed, 2) a respiratory exchange ratio (VCO2/VO2) above 1.10, and 3) a heart rate (HR) within 10 beats per minute of the age-predicted maximum HR (220 – age). The VO2max value was expressed as a relative value (milliliters per minute per body mass; ml kg– 1min–1). Time to exhaustion was recorded as the time from the start of the run until the point of exhaustion (the time at which the subject could no longer maintain the pace of the treadmill).
Determination of the Ventilatory
Threshold and Respiratory Compensation Point. The VT and RCP were determined using
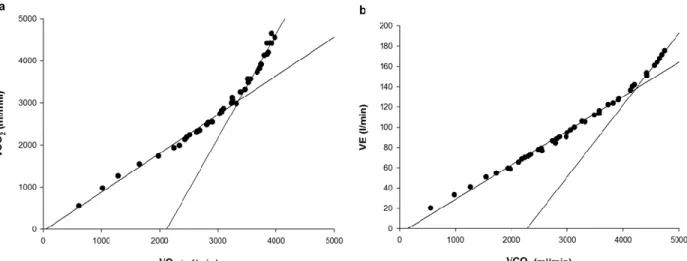
the V-slope method described by Beaver et al. (2). The VT and RCP were defined as the VO2 value corresponding to the intersection of two linear regression lines derived separately from the data points below and above the breakpoint in the VCO2 versus the VO2 and the VE versus the VCO2 relationships, respectively (Figure 1). Additionally, to increase the accuracy of the identification of the VT and RCP, a visual identification technique was used as described below. The VT was determined using the criteria of an increase in the VE/VO2 with no increase in the VE/VCO2 and an increase in the end-tidal O2 pressure with no decrease in the end-tidal CO2 pressure, whereas the RCP corresponded to an increase in the VE/VCO2
and decrease in the end-tidal CO2 pressure. To reduce the variability connected with the identification of the VT and RCP, analyses were performed by two independent investigators. If there was disagreement, the
opinion of a third investigator was sought. Each of the following variables was recorded at both the VT and the RCP: running speed (km h-1), VO2 (ml kg–1min–1) and VO2 as a percentage of the VO2max (%VO2max).
Figure 1. Examples showing methods of determining the ventilatory threshold (a) and the respiratory compensation point (b) in one subject.
Determination of the Isocapnic Buffering
and Hypocapnic Hyperventilation Phases. The
ICB phase was calculated as the difference in VO2 between the RCP and VT (23) and was expressed in either absolute or relative values (expressed as a percentage of the RCP previously described by Röcker et al. (13)). The HHV phase was calculated as the difference in VO2 between the end of exercise and the RCP (23) and was expressed in either absolute or relative values (expressed as a percentage of VO2max and maximal running speed).
Statistical Analyses. Data are reported as the
means ± standard deviation (SD). Statistical significance was accepted at p < 0.05. The normality of the data was examined by performing the Shapiro-Wilk test on all measured variables. Between two groups comparisons were made using either independent t-tests or the Mann-Whitney U test according to the distribution. Pearson product-moment correlations were determined for all correlation analyses. Simple linear regression analysis was used to determine the success of prediction. To allow a better interpretation of the results, effect sizes were also calculated using Cohen’s d (24). Effect sizes were interpreted as negligible (d ≥ 0.2),
small (0.2 ≤ d ≤ 0.5), medium (0.5 ≤ d ≤ 0.8) or large (0.8 ≥ d). IBM SPSS 21 software (IBM SPSS Statistics 21 Inc., Chicago, IL) was used for the statistical analyses. Linear regression analyses were performed by using the Sigma Plot program (Sigma Plot 12.0, Systat Software Inc., Chicago, USA).
RESULTS
The VO2max, maximal running speed, time to exhaustion, VO2 at the VT and RCP, and running speed at the VT were higher in the endurance athletes than in the team sport athletes (p < 0.01). There were no significant differences between the two groups for running speed at the RCP (p > 0.05). The VT expressed as % VO2max was significantly higher in the endurance athletes than in the team sport athletes (p < 0.001), whereas the RCP expressed as % VO2max showed similar values in both groups (p > 0.05). Both the absolute and relative ICB phase values were found to be significantly higher in team sport athletes than in endurance athletes (p < 0.001). There were no significant differences between the two groups in both absolute and relative HHV values (p > 0.05).
Table 2. Physiological variables corresponding to the ventilator threshold, respiratory compensation point, maximal values, isocapnic buffering and hypocapnic hyperventilation phases of the endurance athletes and team sport athletes.
Variables Endurance athletes Team sport athletes p d
Ventilatory threshold
VO2 53.1 ± 3.5 40 ± 5* 0.001 2.99
% VO2max 84.2 ± 3.2 77.8 ± 6.9* 0.001 1.14
Speed (km h-1) 12.1 ± 0.7 10.8 ± 1.3* 0.001 1,21
Respiratory compensation point
VO2 59 ± 3.6 47.9 ± 4.7* 0.001 2.63 % VO2max 93.6 ± 2.9 93.1 ± 5.1 0.6 0.12 Speed 14.3 ± 0.7 14.1 ± 1.7 0.4 0.15 Maximal VO2max 63.1 ± 3.9 51.4 ± 4.3* 0.001 2.87 Speedmax 16.6 ± 0.8 15.8 ± 1.3* 0.009 0.72 Time to ex 9.9 ± 0.8 9.1 ± 1.4* 0.005 0.68
Isocapnic buffering phase
Abs VO2 5.9 ± 1.4 7.8 ± 2.3* 0.001 0.97
Rel VO2 10.1 ± 2.3 16.4 ± 4.9* 0.001 1.58
Hypocapnic hyperventilation phase
Abs VO2 6.3 ± 2.9 6.8 ± 5.1 0.6 0.12
Rel VO2 4 ± 1.8 3.5 ± 2.6 0.4 0.22
Values are mean ± standard deviation. VO2 and running speed are expressed in ml kg min -1 and km h-1, respectively.
* Significantly different from endurance athletes. Maximal = maximal values of physiological variables, Time to ex= Time to exhaustion (min), VO2max = maximal oxygen uptake, Abs= absolute, Rel = relative, Speedmax= maximal
running speed.
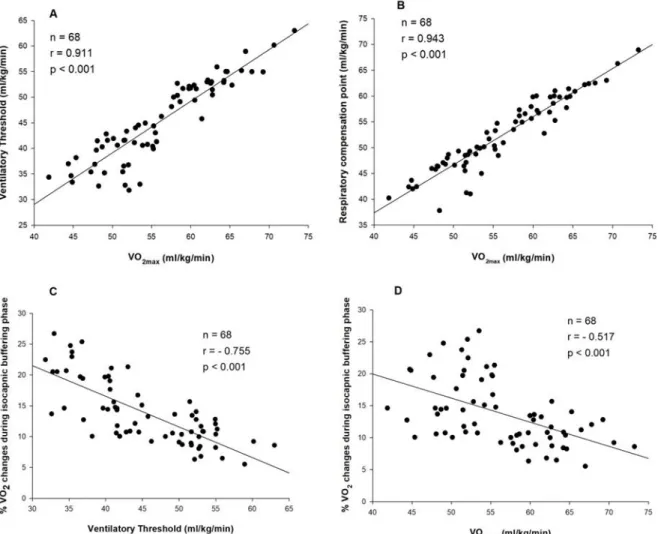
The relative ICB phase was significantly negatively correlated with the VO2max (– r = 0.517, p < 0.001), the VO2 at the VT (– r = 0.755, p < 0.001), and the VO2 at the RCP (r = – 0.517, p = 0.001). A weaker but significant negative correlation was also found between the absolute ICB phase and VO2max (– r = 0.242, p < 0.05) and the VO2 at the VT (– r = 0.497, p < 0.001). There was no correlation between the absolute ICB phase and the VO2 at the RCP (r = – 0.238, p = 0.05). In addition, a significant positive correlation was found between the VO2max and VO2 at the VT (r = 0.911, p < 0.001) and the VO2 at the RCP (r = 0.943, p < 0.001).
DISCUSSION
This study was performed to clarify the relationship between the ICB phase and VT as well as the VO2max and to compare the ICB phase between team sport athletes and endurance athletes. The results of this study indicated that the VO2max and VT values as well as maximal running speed and time to exhaustion were higher in the endurance athletes (despite performing the test at a 5% incline) than in the
team sport athletes, indicating that the endurance athletes have a higher aerobic capacity. On the other hand, both the absolute and relative ICB phase values were higher in team sport athletes than in endurance athletes. In addition, our results indicated that the magnitude of the ICB phase is more closely related to the VT rather than the VO2max and RCP in trained athletes.
Because the available literature that addresses the ICB phase is sparse, this study compared the ICB phase of aerobic- and anaerobic-trained athletes. To our knowledge, only three studies have compared the ICB phase between aerobic- and anaerobic-trained athletes. Our findings are in accordance with these studies, showing a higher relative ICB phase in anaerobic-trained athletes than in endurance-trained athletes. Hirakoba et al. found a greater lactate increase during the ICB phase in sprinters than in long-distance runners (12). Röcker et al. reported that the ICB phase, with the difference between the running speed at LT and at that RCP expressed as a percentage of the RCP, was higher in elite 400-m runners than in an aerobic-trained group (13). On the
other hand, in their study, the VO2max and maximal running speed did not differ between 400-m runners and the aerobic-trained group. Similarly, Hasanli et al. found that although the relative lactate changes during the ICB phase were higher in sprint-trained cyclists than in
endurance-trained cyclists, there were no significant differences in the VO2max between the two groups (8). Our study can be considered to be an appropriate model for the investigation of the ICB phase in aerobic- and anaerobic-trained athletes.
Figure 2. Correlation between A) VO2max and ventilatory threshold, B) VO2max and respiratory compensation point,
C) relative isocapnic buffering phase and ventilatory threshold, and D) relative isocapnic buffering phase and respiratory compensation point in all subjects.
It has been demonstrated that the longer ICB phase in trained subjects was associated with the RCP occurring at higher intensities of exercise (25). Oshima et al. showed that endurance training above the AT was more effective in increasing the RCP than in increasing the VT (23). According to Chicharro et al., intense training sessions involving anaerobic metabolism improves the buffering capacity, leading to a shift in the RCP towards higher
intensities, and consequently extends the ICB phase (6). On the other hand, training sessions involving aerobic metabolism may induce a similar shift in both the VT and RCP (6). From these results, the effect of high intensity training sessions on the RCP appears to be greater than the AT. In our study, there were no significant differences in relative RCP values between the team sport athletes and endurance athletes, which may have been due to having trained
athletes in both groups. Therefore, the greater ICB phase found in the team sport athletes may be attributable to their lower relative VT. Increased buffer capacities in the anaerobic-trained athletes may be a contributing factor in enhancing anaerobic performance capacities (26). On the other hand, the age differences between team sport athletes and endurance athletes should be taken into account when interpreting the findings.
The VO2max together with the VT are the most important physiological variables used in the evaluation of aerobic endurance (27). Therefore, it is expected that endurance athletes have high VT values. Different physiological adaptations occur depending on the intensity and duration of the training program. Traditionally, cross-country skiers are trained at intensities below the VT in most of their training sessions (1). It has been suggested that lower intensity training at levels slightly below the AT mainly induces central adaptations, which result in an increase of the AT and provide improvements in bodily processes, such as in pulmonary diffusion, hemoglobin affinity and cardiac output (28). Another possible explanation for the high VT values of the endurance athletes (vs. team sport athletes) may be related to the genetic makeup of this group. The percentage of slow-twitch muscle fibers and the respiratory capacity of muscles may play an important role in determining the relative AT (29). Ivy et al. reported a strong positive correlation between the lactate threshold (LT) values and the percentage of slow-twitch muscle fibers and muscle's respiratory capacity (29).
It has been shown that there is a greater muscle buffering capacity in anaerobic-trained athletes than in endurance athletes (30). During the ICB phase, more H+ has been reported to be buffered by the non-bicarbonate buffer system in sprint-trained cyclists than in endurance cyclists (8). Depending on differences in the metabolic pathways used during training sessions, the AT, the RCP and consequently the ICB phase varies between aerobic- and anaerobic-trained athletes. Team sport athletes are required to repeatedly produce maximal or near maximal activities interspersed with brief recovery periods through either daily practice or matches (31). This intermittent-type exercise predominantly
stimulates anaerobic energy pathways during high intensity exercise periods while aerobic metabolism gains importance at recovery intervals (32,33). A large accumulation of lactate and H+ during high intensity exercise may provide an important stimulus for adaptations of the muscle pH regulating systems (34). This finding is supported by increases in the muscle buffer capacity in response to high-intensity interval training (35). In addition, sprint training has been reported to increase the muscle buffer capacity, whereas endurance training showed no effect (36). Presumably, the anaerobic training stimulus for team sport athletes may have been to enhance the ICB phase, which may be attributable to the improvement of the buffering capacity as the contributing factor to the tolerance of high-intensity exercise.
Some researchers suggested that the ICB phase contributes to the aerobic capacity in athletes (7). Previous studies indicated a positive correlation between the ICB phase and VO2max in athletes (7,23). On the other hand, according to some researchers, the ICB phase is not related to the endurance performance in endurance athletes (11). In this study, the ICB phase was higher in team sport athletes than endurance athletes despite the VO2max being higher in the endurance athletes. Oshima et al. showed that the ICB phase is more strongly correlated with the VO2max than the AT in athletes (7). However, the sample size was too small for regression analysis in these studies. When pooling the data from all groups, our results indicated a strong positive correlation between the VO2max and the VT as well as the RCP. However, we found a weak negative correlation between the relative ICB phase and VO2max. It has been suggested that the length of the ICB phase is more closely related to the training status rather than the VO2max (25). Hirakoba et al. showed that the relative lactate increase during the ICB phase was inversely correlated with both the VO2max and VO2 at the LT in sprinters and long-distance runners (12). Similarly, Hasanli et al. found a significant negative correlation between the VO2max and relative lactate changes during the ICB phase in sprint-trained and endurance-trained cyclists (8). On the other hand, they found a positive correlation between the relative lactate changes during the ICB phase with the maximal
accumulated oxygen deficit as the anaerobic capacity index. Our data indicated that a relative ICB phase was more strongly negatively correlated with the VT in comparison to the VO2max and RCP.
CONCLUSION
Relative VT values were found to be significantly higher in endurance athletes than in team sport athletes, while relative RCP values were similar in both groups. Therefore, the greater IBC phase found in the team sport athletes may be attributable to the lower relative VT. Our findings would suggest that, for trained athletes, the magnitude of the ICB phase is more closely related to the VT rather than the VO2max and RCP. Presumably, high intensity intermittent-type exercises in team sport athletes may have improved their buffering capacity, leading to a shift in the RCP without change in
the VT, and consequently enhancing the ICB phase.
REFERENCES
1. Seiler KS, Kjerland GØ. Quantifying training intensity distribution in elite endurance athletes: is there evidence for an ‘‘optimal’’ distribution? Scand J Med Sci Sports. 2006;16(1):49-56.
2. Beaver WL, Wasserman K, Whipp BJ. A new method for detecting the anaerobic threshold by gas exchange. J ApplPhysiol, 1986;60:2020-2027.
3. Wasserman K. The anaerobic threshold measurement to evaluate exercise performance. Am RevRespir. 1984;129:35-40.
4. Meyer T, Faude O, Scharhag J, Urhausen A, Kindermann W. Is lactic acidosis a cause of exercise induced hyperventilation at the respiratory compensation point? Br J Sports Med. 2004; 38:622-625.
5. Whipp BJ, Davis JA, Wasserman K. Ventilatory control of the 'isocapnic buffering' region in rapidly-incremental exercise. Respir Physiol. 1989;76(3):357-67.
6. Chicharrro J, Hoyos J, Lucia A. Effects of endurance training on the isocapnic buffering and hypocapnic hyperventilation phases in Professional cyclists. Br J Sports Med. 2000;34:450-455.
7. Oshima Y, Miyamoto T, Tanaka S, Wadazumi T, Kurihara N, Fujimoto S. Relationship between isocapnic buffering and maximal aerobic capacity in athletes. Eur J Appl Physiol Occup Physiol. 1997;76:409-14.
8. Hasanli M, Nikooie R, Aveseh M, Mohammad F. Prediction of aerobic and anaerobic capacities of elite cyclists from changes in lactate during isocapnic buffering phase. J Strength Cond Res. 2015;29(2):321-9.
9. Takano N. Respiratory compensation point during incremental exercise as related to hypoxic ventilator chemosensitivity and lactate increase in man. Jpn J Physiol. 2000;50(4):449-55.
10. Rausch SM, Whipp BJ, Wasserman K, Huszczuk A. Role of the carotid bodies in the respiratory compensation for the metabolic acidosis of exercise in humans. J Physiol. 1991;444:567-78.
11. Bentley DJ, Vleck VE, Millet GP. The isocapnic buffering phase and mechanical efficiency: Relationship to cycle time trial performance of short and long duration. Can J Appl Physiol. 2005;30(1):46-60.
12. Hirakoba K, Yunoki T. Blood lactate changes during isocapnic buffering in sprinters and long distance runners. J Physiol Anthropol Appl Human Sci. 2002; 21(3):143-9.
13. Röcker K, Striegel H, Freund T, Dickhuth HH. Relative functional buffering capacity in 400-meter runners, long-distance runners and untrained individuals. Eur J Appl Physiol. 1994;68:430-434.
14. Staib JL, Im J, Caldwell Z, Rundell KW. Cross-country ski racing performance predicted by aerobic and anaerobic double poling power. J Strength Cond Res. 2000;14(3):282-288.
15. Hoffman MD, Street GM. Characterization of the Heart Rate Responseduring Biathlon. Int J Sports Med. 1992;13(5):390-394.
APPLICABLE REMARKS
It can be seen that team sport athleteshave a greater ICB phase than endurance athletes. The ICB phase may be related to the buffering capacity and a greater percentage of energy production from anaerobic metabolism during exercise.
Evaluation of the ICB phase of athletes can provide important information about the physical demands of different sport branches and the physiological adaptations to sport-specific training.
16. Holmberg HC. The elite cross-country skier provides unique insights into human exercise physiology. Scand J Med Sci Sports. 2015;25(4):100-109.
17. Sandbakk Ø, Holmberg HC. A reappraisal of success factors for olympic cross-country skiing. Int J Sports Physiol Perform. 2014;9(1):117-21.
18. Sheppard JM, Gabbett TJ, Stanganelli LC. An analysis of playing positions in elite men’s volleyball: considerations for competition demands and physiologic characteristics. J. Strength Cond Res. 2009;23:1858-1866.
19. Bangsbo J. The physiology of soccer - with special reference to intense intermittent exercise. Acta Physiol Scand.1994;151:619.
20. Buchheit M, Mendez-Villanueva A, Quod M, at al. Improving acceleration and repeated sprint ability in well-trained adolescent handball players: speed versus sprint interval training. Int J Sports Physiology Perform. 2010;5:152-164.
21. Gamble P. Periodization of training for team sports athletes. Strength Cond J. 2006; 28(5):56-66.
22. Freitas TT, Martinez-Rodriguez A, Calleja-Gonza Âlez J, Alcaraz PE. Short-term adaptations following complex training in team-sports: A meta-analysis. PLoS One, 2017;29;12(6):e0180223.
23. Oshima Y, Tanaka S, Miyamoto T. Effects of endurance training above the anaerobic threshold on isocapnic buffering phase during incremental exercise in middle-distance runners. Jpn J Phys Fitness Sports Med. 1998;47:43-52.
24. Thalheimer W, Cook S: (2002) How to calculate effect sizes from published research articles: A simplified methodology. Available at: http://work learning.com/effect_sizes.htm. Accessed on January 11 (2016)
25. Lenti M, De Vito G, Scotto di Palumbo A, Sbriccoli P, Quattrini FM, Sacchetti M. Effects of aging and training status on ventilatory response during incremental cycling exercise. J Strength Cond Res. 2011;25(5):1326-1332. 26. Parkhouse WS, Mckenzie DC, Hochachka PW, Ovalle WK. Buffering capacity of deproteinized human vastus
lateralis muscle. J Appl Physiol. 1985;58:14-17.
27. Helgerud J. Maximal oxygen uptake, anaerobic threshold and running economy in women and men with similar performance levels in marathons. Eur J Appl Physiol. 1994;68:155-61.
28. Docherty D. Sporer B. A proposed model for examining the interference phenomenon between concurrent aerobic and strength training. Sports Med. 2000;30 (6):385-94.
29. Ivy JL, Withers RT, Van Handel PJ, Elger DH, Costill DL. Muscle respiratory capacity and fiber type as determinants of the lactate threshold. J Appl Physiol, 1980;48:523-527
30. Edge EJ, Bishop D, Hill-Haas S, Dawson B, Goodman C. Comparison of muscle buffer capacity and repeated-sprint ability of untrained, endurance-trained and team-sport athletes. Eur J Appl Physiol. 2006;96:225-234. 31. Spencer M, Bishop D, Dawson DB, Goodman C. Physiological and metabolic responses of repeated sprint
activities: specific to field based team sports. Sports Med. 2005;35:1025-1044.
32. Hamilton AL, Nevill ME, Brooks S, Williams C. Physiological responses to maximal intermittent exercise: differences between endurance-trained runners and games players. J Sport Sci. 1991;9:371-382.
33. Glaister M. Multiple sprint work: physiological responses, mechanisms of fatigue and the influence of aerobic fitness. Sports Med. 2005;35:757-77.
34. Bishop D, Girard O, Mendez-Villanueva A. Repeated-Sprint Ability – Part II Recommendations for Training. Sports Med. 2011;41(9):741-756.
35. Edge J, Bishop D, Goodman C. The effects of training intensity on muscle buffer capacity in females. Eur J Appl Physiol. 2006;96:97-105.
36. Sharp RL, Costill DL, Fink WJ, King DS. Effects of eight weeks of bicycle ergometer sprint training on human muscle buffer capacity. Int J Sports Med. 1986;7:13-17.