m A l Cl & Ш П A m
JES
т / с 7 - ^ 9 2 . ^ s s sf/Æ
â m g s s s a i e t i - Ä S а а ш Е Е 8 ! й еж Ш «SÎITiâTî 0? ИвЕШИе âiS SCæSCES
m ш м ш ш ш з і г у
а ?да«ді
·:</
ш
ші»*шгит$
LOW BIT RATE SPEECH CODING METHODS AND
A NEW INTERFRAME DIFFERENTIAL CODING
SCHEME FOR LINE SPECTRUM PAIRS
A THESIS
SUBMITTED TO THE DEPARTMENT OF ELECTRICAL AND ELECTRONICS ENGINEERING
AND THE INSTITUTE OF ENGINEERING AND SCIENCES OF BILKENT UNIVERSITY
IN PARTIAL FULFILLMENT OF THE REQUIREMENTS FOR THE DEGREE OF
MASTER OF SCIENCE
Bv
Eng'iii Erzili
т к
I certify that I have read this thesis and that in my opinion it is fully adequate, in scope and in quality, as a thesis for the degree of Master of Science.
2
^
i !---;--- . Assoc. Prof. Dr. A. Enis Qetin(Principal Advisor)
1 certify that I have read this thesis and that in my opinion it is fully adequate, in scope and in quality, as a thesis for the degree of Master of Science.
1 certify that 1 have read this thesis and that in my opinion it is fully adequate, in scope and in quality, as a thesis for the degree of Master of Science.
Assoc. Prof. Dr. Levent Onural
Approved for the Institute of Engineering and Sciences:
Prof. Dr. Mehmet B^ray
ABSTRACT
LOW BIT RATE SPEECH CODING METHODS AND A
NEW INTERFRAME DIFFERENTIAL CODING SCHEME
FOR LINE SPECTRUM PAIRS
Engin Erzin
M.S. in Electrical and Electronics Engineering
Supervisor: Assoc. Prof. Dr. A. Enis Çetin
June 1992
Low bit rate speech coding techniques and a new coding scheme for vocal tract parameters are presented. Linear prediction based voice coding tech niques (linear predictive coding and code excited linear predictive coding) are examined and implemented. A new interframe differential coding scheme for line spectrum pairs is developed. The new scheme reduces the spectrcd distor tion of the linear predictive filter while maintaining a high compression ratio.
Keywords : Speech coding, lineiir predictive coding, vocal tract parameters, pitch, code excited linear prediction, line spectrum pairs.
ÖZET
AZ
b i t l e s o z k o d l a m a m e t o d l a r i v e d o ğ r u s a lSPEKTRUM ÇİFTLERİ İÇİN YENİ BİR
ÇERÇEVELERARASI FARK KODLAMA YAPISI
Engin Erzin
Elektrik ve Elektronik Mühendisliği Bölümü Yüksek Lisans
Tez Yöneticisi: Doç. Dr. A. Enis Çetin
Haziran 1992
Az bitle söz kodlama teknikleri irdelenmi.ş ve ses yolu parametreleri için \ eni bir kodlama yapısı sunulmu.çtur. Bu amaçla çeşitli doğrusal öngörü kökenli söz kodlama teknikleri (doğrusal öngörülü kodlama ve kod beslemeli doğrusal öngörülü kodlama) incelemiş ve gerçeklenmiştir. Ayrıca Doğrusal Spektrum Çiftleri için yeni bir çerçevelerarası fark kodlama yapısı geliştirilmiştir. Önerilen bu yapının doğrusal öngörülü süzgeçin spektral bozulmasını azaltmada başarılı olduğu gösterilmiştir..
Anahtar kelimeler : Söz kodlaması, doğrusal öngörülü kodlama, ses üretim parametreleri, perde, kod beslemeli doğrusal öngörü, doğrusal spektrum çiftleri.
ACKNOWLEDGMENT
I would like to thank Assoc. Prof. Dr. A. Enis Çetin for his supervision, guidance, suggestions and encouragement throughout the development of this thesis.
I want to express my special thanks to all my friends who worked in the LPC-10 vocoder project, especially to Dr. Ergin Atalar and to Deniz Erta§ for their valuable discussions and helps.
1 would also like to thank STFA Savronik who supported our work.
It is a pleasure to express my thanks to all my friends for their valuable helps during the preparation of this thesis.
C on ten ts
1 Introduction 1
1.1 LiliecU' Modelling of the Vocal T r a c t... 3
2 Linear P redictive C oding (LPC) of Speech 6
2.1 Covai'icuice Method for Linear Predictive A n aly sis... 7 2.2 Voicecl/Unvoiced Decision and Pitch Period D etection... 8 2.3 Implementation of LPC Vocoder with TMS320C2X Micro-Processors 11
2.3.1 A n a ly s is ... 11
2.3.2 Synthesis 13
2.3.3 Implementation of a LPC Vocoder on SUN-Sparc Stations 13
3 Code E xcited Linear P rediction of Speech 15
3.1 Synthesis... 15
3.2 Analysis 16
3.3 Search A lg o rith m ... 17 3.4 Implementation of CELP Vocoder on SUN-Sparc Stations 18
4 Interfram e Differential Coding of Line Spectrum Pairs 19
4.1 Computation of LSP Frequencies 20
4.2 DilFerential Coding of LSP F requencies... 22 vi
4.3 Quantizer 4.4 Simulation Examples 5 Conclusion Vll 23 24 28
L ist o f F ig u r e s
1.1 Acoustic Tube Model of the Vocal Tract 3
1.2 Signal flow graph for lossless tube model of the vocal tract. . . . 4
1.3 (a) Equivalent discrete-time system for lo.ssiess tube model of the vocal tract, (b) equivalent discrete-time system using only whole delays. 4 2.1 LPC Vocoder Synthesizer 7 2.2 Modelling of the speech production s y s t e m ... 9
2.3 Sample outcomes of cep.strum function for voiced (a) and un voiced speech (b), respectively... 10
2.4 LPC Vocoder Flow D iagram ... 12
3.1 CELP Synthesizer... 16
3.2 CELP A n a ly z e r ... 17
L ist o f T a b les
4.1 Spectral Distortion (SD) Performance of Intraframe and Inter frame Coding S c h e m e s ... 25 4.2 Spectral Distortion (SD) Performance of the Vector Quantizers
[21] and [22] 26
4.3 Spectral Distortion (SD) Performance of the Interframe Differ ential Coding with Entropy C o d in g ... 26
C h ap ter 1
In tro d u ctio n
Speech is an important tool of communication. Webster’s Dictionary defines s]jeech as “the power of audible expression, talk, oral expression or commu nication” . Therefore a speech signal is an information bearing signal. In this thesis coding and transmission of speech signals are studied.
An efficient speech coding and transmission method must be based on un derstanding of how human beings produce it. The main organs that help to the production of speech are the larynx^ which contains vocal cords, and the vocal tract, which is a tube leading from the larynx along the pharynx and then l:)ranching into the oral cavity leading to the lips and through the nasal cavity to the nostrils.
Acoustic energy in speech can be generated in two different ways. The first mechanism produces voiced excitation in the larynx. The vocal cords oscillate quasi-periodically at an average rate of 110 times per second for man and about twice of that for a woman. The resulting voiced speech include all vowels and many consoirant sounds. The second mechcurism produces acoustic energy in speech using the turbulence created by the tongue oi‘ lips. The generated sounds in this way (such as, ’s’ or ’sh’) are said to be voiceless and they generally play a less important role in speech than voiced sounds.
Human hearing system senses the loudness of the sound by the log of acous tic energy rather than its linear value. Therefore, doubling the energy in a sound leads linear increase in loudness. The maximum sensitivity of our am plitude hearing is in the 1 to 2 kHz range. This sensitivity falls off below 100 Hz and above 5-10 kHz de])ending on the cige.
A speech message is usually preserved in two ways,
(i) by the message content (type (i) coder), and
(ii) by retaining the speech waveform in a form that is convenient for trans mission and storage (type (ii) coder).
Waveform representation of speech which can be considered as a type (i) coder consists of concatenation of elements called phonemes. A set of phonemes forms a basis for speech signal and phonemes differ with different languages. A way of coding speech waveform is concatenating phonemes and this costs about 100 bits/sec transmission rate [1]. Although this may be the lowest rate that can be achieved, the concatenation technique can not sense the rate of speaking, the loudness and the emotional content of the speech, etc.
The acoustic speech signal can be translated into electrical signal by a transducer. The relative bandwidth of this signal is about 4 kHz. In many telecommunication applications the analog signal is filtered by a lowpass filter with cutoff cit 3.6 kHz. After lowpass filtering, this signal is sampled with a sampling rate of 8 kHz. Usually the A/D converter uses 12 bits per sample. The simplest type (ii) speech coder is the Pulse Code Modulator (PCM), which is just a non-uniform quantizer. The PCM method converts 12 bit samples to 8 bit /i-law or A-law coded samples at 8 kHz sampling rate and this corresponds to 64 kbit/sec transmission rate [1].
Today’s technology lets us process the discrete-time speech signal in a very flexible manner. There are microprocessors called digital signal processors, with 60 ns instruction cycle, that is we are capable of using about 2100 instruc tions for one sample of speech signal. Because of this, in recent years many computationally intensive speech coding techniques have been developed [2].
In this thesis we consider two ways of representing the speech signal based on linear modelling of the vocal tract. The Linecir Predictive Coding (LPC) [1] and Code Excited Linear Predictive Coding (CELP) [2] methods are imple mented by using the TMS320C25 digital signal processor and soundtool soft ware of SUN-Sparc workstations. The main contribution of this thesis is a new interframe differeiitial coding scheme for vocal tract parameters, this new cod ing method is used with LPC and CELP coders. The LPC and CELP coders are examined with their basic properties in Chapter 2 and 3, respectively.
Glottis A. A , A 3 A N-l ^ N Lips
A x A x A X A X A X A x A x A x A x
L
Figure 1.1: Acoustic Tube Model of the Vocal Tract
1.1
L inear M o d ellin g o f th e V ocal Tract
lu this section linear modelling of the vocal tract is described and parameters of this linear model called vocal tract parameters which are essentially important in many speech coding methods are defined.
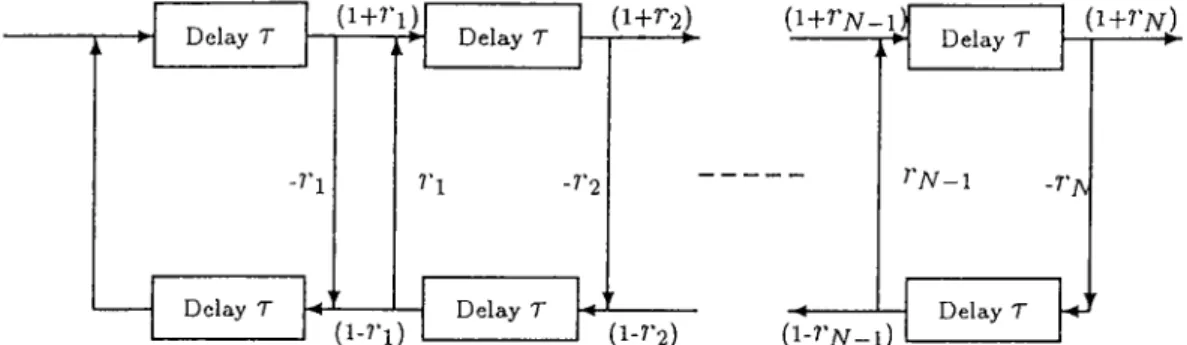
The vocal tract plays an im])ortant role in speech generation. It is excited by the flow of air coming from the lungs. Although the vocal tract area func tion, A(.T, /.), is considered to be a time-varying linear system, it is assumed to be constant for short time intervals (10-30 ms) during the speech generation process. Thus vocal tract is simulated by a concatenation of lossless acoustic tubes as shown in Figure 1.1. The length of each tube is A x — where L is the overall length of the vocal tract and N is the number of the tubes. Wiive propagating in this system can be represented [3] as in Figure 1.2 with the delays being ecjual to t = -^ which is the time to propagate the length of one
tube, where c is the velocity of sound. The parameters ?·/; are the reflection coefficients for the k''''’ junction and given as,
— At;
rr = (1.1)
d .A :+ l - f At;
where At; is the area of the A:'^* portion of the acoustic, tube. This definition implies that —1 < 7·^. < 1 as all areas are positive.
For a sampling period of T = 2t, the equivalent discrete-time system tor band-limited inputs can be obtained as shown in Figure 1.3-a. Since imple mentation of I sample delays is not easy, a more desirable configuration with
whole delays can be achieved, Figure 1.3-b. D e la y T -ri D e la y T D e la y T (1+^2) r-i -r’2 (1-i’l) D e la y T ( i + i ’ y v -' V D e la y T ( i + ^ X ) - - r y V- 1 - r - A D e la y T 0 - rN l )
1.2; Signal Bow graph for lossless tube model of the vocal tract.
j-l/2 ( 1 + r . ) ,-1/2 Z -'/^ -Vi ' --- 1' N - l ( 1 - n ) (l — ( a ) -I'M . -1 ( 1 + n ) .-1 ( l + 7’y V _ i ) ^-1 --- --- ►--- ---►· -r\ ' V TN-\ ' -t n 2i --- --- ^---( l - n ) (l — ryv-l) ( b )
Figure 1..3: (a) Equivalent discrete-time system for lossless tube model of the vocal tract, (I)) equivalent discrete-time system using only whole delays.
In general, the transfer function, H[z), for a lossless tube model can be expressed as follows [1],
H{z) =
Y{z) (1.2)
where Y{z) can be obtained from the recursion: Yq{z) = 1 Yk{z) = Y,_,{z) + r,z-^Y ,_ ^{z-^), k ^ l , 2, . . . , N.
y{ z ) = Yn{z) that is y { z ) will have the form,
N
Y{z) -k (1.3)
A : = l
Then the transfer function H(z) reduces to an all pole linear filter form, G
H(z) =
Y{z) (1.4)
where G = n L i ( l + >')i) .
The reflection coefficients, 7’r ’s, are called the vocal tract parameters and most of the speech coding methods use these parameters to represent the linear predictive filter. Coding performance of the reflection coefficients is better than coding of the filter coefficients, as reflection coefficients lie in the range -1 to 1.
Finally, the lossless tube model produces an all pole linear filter, which works well in modeling the human speech production system.
C h ap ter 2
Linear P r e d ic tiv e C oding (L P C ) o f S p eech
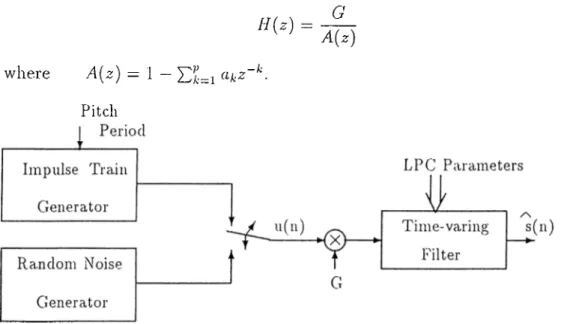
In this chapter we describe the linear predictive analysis and examine some necessary parameters for speech estimation and prediction, such as pitch value. Also, an implementation of the LPC vocoder (voice coder) is presented.
Linear predictive analysis method is a powerful speech analysis technique for estimating the basic speech parameters, such as pitch, vocal tract area function, etc [1]. Accurate estimation of the speech parameters and low com putational complexity make this method a widely used one.
The basic idea of linear predictive coding is that the current speech sample can be estimated as the linear combination of past samples. .Applying cin error minimization criterion one can come up with a set of predictor coefficients for an all pole, linear, time-varying filter model. This all pole linear filter is excited either by quasi-periodic pulses (during voiced speech), or random noise (during unvoiced speech) to form the synthetic speech.
There are various ways of carrying out the linear predictive analysis of speech such as, the covariance method, the cuitocorrelation method, the lattice method, and the inverse filter formuhition [1]. The most common ones are the autocorrelation and covariance methods. Although autocorrelation metliod always produces stable solutions, the performance of covariance method is slightly better than autocorrelation method especially for voiced speech [1]. In this chapter the covariance formulation is presented.
2.1
C ovariance M e th o d for Linear P r e d ic tiv e A n a ly sis
The basic form of the LPC vocoder is given in Figure 2.1. In this case, the modelling of speech waveform is represented by a time-varying digital filter with steady-state system function:
H{z) G
A{z) (2.1)
where A{z) — 1 — ^·
Pitch
Figure 2.1: LPC Vocoder Synthesizer
LPC analysis is a fVcime-oriented technique which performs analysis for speech segments of duration 20-30 ms. The LPC system is excited by an iin- ])ulse train for voiced speech and random noise sequence for unvoiced speech. Voiced/unvoiced decision and pitch period calculation are done in either time or freciuency domain. A frequency domain method, cepstrum method, is ex amined in the following section. The other parameters used in the system are the gain, C, and the coefficients of the LP filter. All these parameters slowly vary in time.
Let us define the prediction error,
e(n) = s(n) - Y2 (ihs{n - k) h=i
(2.2)
where s(n) is the true value and aics{n — k) is the predicted value of the speech at time instant n. Then the short-time average prediction error is defined as. E = X]e^(m) m = J2{s{rn) - ^ks{m - k ) f 7H A:=l (2.3) (2.4)
where the range of the outer summation is determined according to the duration of speech segments which range from 20 to 30 ms.
In order to minimize the predictor error we can obtain a set of equations by setting ^ = 0 for k = After some algebraic manipulations we obtain the following equations:
V
Y ^ s{m - i)s{m) = Y ^ a k Y ^ s { m - i)s{m - k), (2.5)
m l;-i in
Let us define,
<)6(i, ^ s(??i — ¿)s(m — A:) (2-6)
m
then Eq. (2.3) reduces to
Y^at:(l){i,k) = i = (2.7)
•;=1
Equation (2.5) is a linear system of p equations with p unknowns, and it can be solved in an efficient manner [1]. In matrix form these equations become.
<^(1,1) 0(1,2) <^(l,p) ^(2,1) ¿(2,2) ¿(2,p) 'Kl’.l ) ®(P,2) (li ■ < ^ ( 1 , 0 ) ■ Ct2 = < ^ ( 2 , 0 ) Clp _ H l k 0 ) _ (2.8)
and the pxp coefficient matrix is called the covariance matrix and Eq. 2.8 can be solved efficiently by Cholesky deccrmposition [4] or Levinson-Durbin recursion can also be used to determine the LPC parameters [5].
2.2
V o ic e d /U n v o ic e d D ec isio n and P itc h P e r io d D e
te c tio n
In this section we examine the voiced/unvoiced characteristics of the speech sigiml. One important characteristic of speech is the periodic or nearly periodic nature of it, if it is voiced. This characteristic causes considerable redundancy which can be exploited by predicting the current samples from samples ob served one period earlier. The number of glottal openings per second is closely associated with this periodic nature of speech segment and the repetition period is often called the pitch period. Estimation of the pitch period is an impor tant problem in analyzing the speech waveform. Autocorrelation method [6], average magnitude difference function (AMDF) method [7], cepstrum method
[3],[8] are the widely used methods for estimating the pitch period. AMDF and autocorrelation methods have low complexity but weak performance on finding the true value of the pitch period compared to the cepstrum method. So the details of the cepstrum method is presented in this section.
Voiced/unvoiced decision and pitch period are the parameters which deter mine the excitation of the linear prediction filter in Figure 2.1. The energy and the periodicity of the speech signal are the factors for the voiced/unvoiced decision. Voiced speech has a periodic characteristics with a high RMS value, and unvoiced speech has a pseudo-random characteristics with a low RMS value. Voiced/unvoiced decision cind pitch period detection can be made both in time or frequency domain. A frequency domain method, cepstrum method, is more reliable but it is more computationally complex than other time domain methods [3].
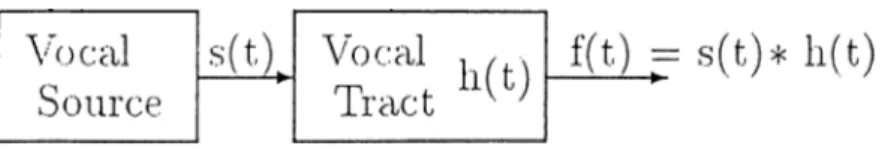
Ely considering the vocal tract model, the speech signal can be modelled as an output of the vocal tract excited by a vocal source as shown in Figure 2.2. Therefore the speech can be modeled as a convolution of a vocal source, s{t),
Figure 2.2: ModeU'mg of the speech production system
with a vocal tract function, h{t). In frequency domain this can be written as,
F{w) = S{io)H{w) (2.9)
Then the autocorrelation function,
.■(r) = ^ - ' ( | / » n (2 10)
expressed as a convolution of individuell autocorrelation functions of s(i) and h{t) as,
/■(r) = 7'^(r) * ?'/i(r). (2-11)
This convolution in some cases causes multiple peaks at the autocorrelation function ?’(r) and voiced/unvoiced decision becomes difficult to make. One way of separating the effect of vocal tract from vocal source is the cepstrum method.
10
By computing the logarithm of both sides of (2.9) in frequency domain one can separate the two vocal function as follows,
= Lo{j\S{w)\^ + Log\H{w)\‘^
(2 . 12)
(2.13) and we define the cepstrum function by taking magnitude squares of the inverse Fourier transform of each sides,
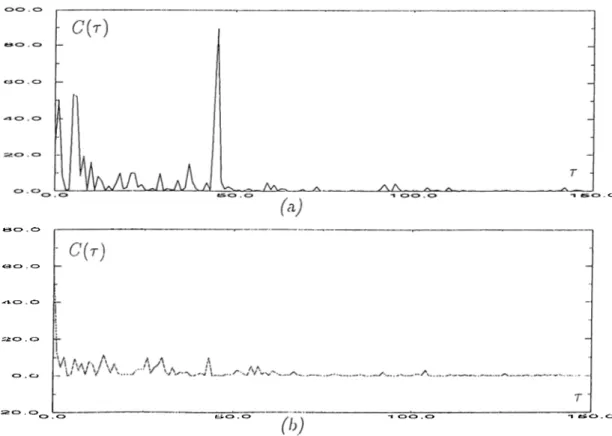
C{t) = |JP -'(ioi,|F (,„)|-^)|^= |J f-i(io s |.S (t» )p )+ 2 ^ -'(L o i,|/i(u ,)n p (2.14) In this case the source and the tract elTects become additive and the vocal tract part consists of low frequency components (in the order of seconds), vocal source part consists of high frequency components. If the speech segment is voiced their a peak corresponding to the source periodicity appears clearly in C{r). An example is shown in Figure 2.3. If the frame is voiced (Figure 2.3.a) then a peak appears in tire position of pitch period. If the frame is unvoiced (Figure 2.3.b) then we can not see a sharp peak, other than r = 0 location.
. o
^0 . 0
20.0
~ szo . o t i O . o 1 0 0 . 0
Figure 2.3: Scimple oiitcome.s of cepstrum function for voiced (a) and unvoiced speech (b), respectively.
11
Another cepstrum method is based on the computation of the cepstrum of the linear prediction error sequence (residual signal). The cepstrum of the residual signal also shows a similar behavior as in Figure 2.3. The outcome of cepstrum lunction provides an eas)' voiced/unvoiced decision and gives a more reliable decision on the pitch value. We can also state that the cepstrum applied on residual signal gives better decisions [23].
2.3
Im p le m e n ta tio n o f L PC V ocod er w ith T M S 3 2 0 C 2 X
M icro -P ro cesso rs
Real time implementation of the LPC vocoder system was realized as a group project in EE 526 DSP Liiboratory course in 1990. The implementation was performed with TMS320C2X microprocessors. The system consists of three main blocks, first one is the A/D, D/A conversion of speech signal at 8 kHz, the second block consists of the analysis and synthesis of the speech signal and the third block consists of the serial communication link between analyzer and synthesizer as shown in Figure 2.4. Our LPC vocoder sj'stem is compatible with NATO standards [9], we use 10-th order linear prediction filter and a frame (180 samples) is represented by 54 bits. This corresponds to a transmission rate of 2.4 kbits/sec.
In our implementation we used TMS320C20 at the synthesizer part and TMS320C25 at the analyzer pcirt. TMS320C20 and C25 micro-processors have 200 and 100 ns instruction cycles, respectively. Both of these processors are lociited on a plug-in PC-card which contains A/D and D/A converters and a serial transmission port.
2.3.1
A n a ly sis
Analog speech signal is sampled at 8 kHz with a precision of 12 bits/sample. The discrete-time speech signal is processed in frames (each frame consists of 180 samples). After first order pre-emphasis (1 — 0.93752“ ') voiced/unvoiced decision is made and then 10 predictor coefficients are determined by linear pre dictive aiicilysis. Covariance formulation is used for linear predictive analysis. Based on H. Padir’s M.Sc. thesis, the average magnitude difference method (AMDF) [7] is used for voiced/unvoiced decision. The AMDF method has a low complexity and its performance is acceptable. The AMDF method forms
12
13
a difference signal between the delayed and the original speech and, at each delay, the absolute magnitude of the difference is evaluated. The difference sig nal is zero, if the delay is zero, and exhibits deep nulls at delays corresponding to the pitch period of voiced speech. The AMDF method is chosen for real time implementation because of its simple nature and it also gives a reason able estimates of the pitch periods. In the cinalysis section the gain (RMS) of the frame is calculated, too. .All of the estimated parameters are passed to a block which sends them through the serial port after a bit shuffling process. In our system the transmi.ssion is not synchronous, it is asynchronous, so that for each frame we have extra two start and stop bits which increase the transmis sion rate above the NATO standard rate, 2.4 kbits/sec. But the synchronous transmission can easily be implemented with a synchronization algorithm.
2.3.2
S y n th e sis
The synthesizer receives the shuffled bit stream and decodes the parameters of each frame from this stream. If the frame is voiced, then the input excitation sequence is a periodic impulse train. The periodicity of the impulse train is the estimated pitch value. Otherwise input excitation sequence is formed by using a pseudo-random number generating stream. Then the LPC filter whose coefficients are extracted from the coded bit stream is excited by either the impulse train or pseudo-white noise. In this way a synthetic speech signal is generated at the receiver. Finally, a de-emphasis ( ;_q 7.5; -i ) RMS normal
ization is performed and an interrupt routine outputs the synthetic speech at a rate of 8 kHz.
2.3.3
Im p le m e n ta tio n o f a L PC V ocod er on S U N -S p a rc
S ta tio n s
We also implemented an LPC vocoder on SUN-Sparc stations by using the soundtool software and the C compiler. In this implementation, we did not care about the computational complexity of the individual sub-algorithms ol the LPC vocoder and selected algorithms to achieve the best performance. We compared some different algorithms for voiced/unvoiced decision and LPC parameters coding. The cepstrum method is performed for voiced/unvoiced decision both on speech signal and residual signal. Synthesized speech qual ity tests showed us that cepstrum method is better than AMDF method in
14
general and also cepstrum applied on residual has a better performance than cepstrum applied on speech signal. LPC parameters coding is performed by us ing Line Spectrum Pairs, which represent the linear predictive filter coefficients in a robust way. (Interframe differential coding of line spectrum pairs is de scribed in Chapter 4). VVe also used a smoothing scheme for LPC parameters cind pitch period. The smoothing removes discontinuities in the synthesized speech. Finally, we achieved a better quality synthesized speech than the real time LPC-10 vocoder implementation described in the previous section. The developed software is available at the Electrical and Electronics Engineering Department Library.
C h a p te r 3
C ode E x c ite d Linear P r ed ictio n o f S p eech
In this chapter we present another speech coding method, Code Excited Linear Prediction (CELP) [2],[10],[11]. CELP coding is based on analysis-by-synthesis search procedures, vector quantization (VQ), and linear prediction (LP). The formant structure of the speech is modelled by a 10-th order LP filter, 'i'he long-term signal periodicity is modelled by an adaptive codebook, and the error from the linear prediction filter excited by codewords from the adaptive codebook is also vector quantized by using a fixed stochastic codebook. The optiiiral excitation vectors from cidaptive and stochastic codebooks are selected by minimizing the error between synthesized and original speech in the M.S.E. sense.
For the 4.8 kbits/sec CELP, the stochastic codebook consists of 512 ternary valued (-1,0,4- 1) codewords, and adaptive codebook consists of 128 codewords which are refreshed by the previous excitation sequence at every subframe. 30 ms frame size is used at 8 kHz sampling rate and therefore eiich frame consists of 240 samples (or 4 subframes where each subframe consists of 60 samples). The transmitted CELP parameters are the stochcistic and adaptive codebook indices and gains, and 10 line spectral pairs (LSP) as the vocal tract parameters.
3.1
S y n th esis
The CELP synthesizer, shown in F'igure 3.1, is both used in the receiver and the transmitter. The excitation is formed by stochastic and adaptive codebook vectors.
16
s(t)
LPC Parameters Figure 3.1: CELP Synthesizer
Stochastic codebook contains sparse overlapping, ternary valued, pseudo randomly generated codewords. In the stochastic codebook, codewords are overlapped by a shilt ot -2. In other words each codeword contains all but two samples of the previous codeword and two new samples. The adaptive codebook is a shifting storage register which is updated at the start of each subframe with the previous 60 element LP filter excitation. In the adaptive codebook, codewords are overlapped by a shift of -1. .Stochastic codebook vector, which is given by index is and scaled by gs adaptive codebook vector, which is given by index and scaled by add up to form the linear prediction filter’s excitation. Furthermore, the cidaptive codebook is updated by this excitation secjuence for use in the following subframe.
3.2
A n a ly sis
The CELP analyzer, shown in Figure 3.2, contains a CELP synthesizer and a feedback loop for minimizing the M.S.E. between the original and the syn thesized speech. The search procedure finds the adaptive and stochastic in dices and gains that minimize the M.S.E.. Codebook search methods for both stochastic and adaptive codebooks are identical. .So a two stage search algo rithm is used for reducing the complexity of the search. In the first stage the adaptive codebook search which forms the periodic nature of the speech signal is carried out. In the second stage, stochastic codebook search is performed in order to model the random nature of the speech.
CELP Synthesizer Error Minimization
+
17 s (original speech)Figure 3.2: CELP Analyzer
3.3
Search A lg o rith m
In this section a brief outline of the codebook search algorithm is presented. Let .s, .3, and e represent the original speech, the synthetic speech and the error .signed respectively. Let v be the excitation vector being searched for in the present stage and u be the excitation vector of the previous stage. For the first stage the vector u is a zero vector. The excitation vector, V{, can be written as:
Vi = (Ji'Xi, (3.1)
where .r,· is the v-th element of the codebook and (/,· is the corresponding gain for .'c,·. Let H be LxL matrix whose j-th row contains the truncated impulse response caused by a unit impulse 6{t — j) of the LP filter. Here L is the size of the codeword which is also equal to the size of a subframe. Then the .synthetic speech can be expressed cis the sum of LP filter’s zero input response and the convolution of the LP filter’s excitation with impulse response.
■h — -^o + * — 1) 2,..., y (3,2)
where u is a zero vector in the first stage search or the scaled adaptive excitation vector in the second stage search. Then the error signal, e,·, is given as follows:
e,· = s- - .3,·
= Co
-
vJL
where eg is the target vector, i.e.,e-o = s — Si — uH. Thus, the error, e,·, can be rewritten as follows.
(3.3) (3.4)
(3.5)
18
where y, represents the filtered codeword, i.e.,
Vi = XiH. (3.7)
Let Ei represents the total squcire error for codeword i, i.e.,
E, = \\ei\\'^ = t iej (3.8)
= eoCo - 2gieoyJ + g hjivl (3.9)
The total square error, E{, is a function of y,· and index i. For optimal gain we set the partial derivative of F,· with respect to y,· to zero, i.e.,
dE,
dgi = -2eoy] + 2giyiyJ = 0. Then optimal gciiii reduces to:
r
T
ViVi
(3.10)
(3.11) alter the gain quantized, gi = Q[gi] the match score can be written as follows, niatchi = gi{2eoyf - giXjiXjJ). (3.12) The search algorithm maximizes this match score for the oj^timal codeword.
3.4
Im p lem e n ta tio n o f CELP V ocoder on S U N -S p arc
S ta tio n s
In this section some details of the implementation of 4.8 kbits/sec CELP vocoder is presented. The computational load of the codebook search modules make the real time implementation of the CELP vocoder harder than LPC vocoder. We implemented the 4.8 kbits/,sec CELP vocoder on ,SUN-Sparc Sta tions. The SUN-Sparc Stations have an input-output (A/D, D/A) channel which uses /¿-law compression and stores the speech signal in 8 bits/sample. The .scumdioo/software helps in A/D and D/A conversion and supplies speech data for processing. The stored discrete-time speech signal is processed by a software which implements the 4.8 kbits/sec CELP vocoder and synthesized speech is stored in a file. The relative performance of 4.8 kbits/sec CELP vocoder is better than the LPC vocoder. 4.8 kbits/sec CELP vocoder trans mits two codebook indices for stochastic and adaptive codebook, and two gain factors for these codebooks, respectively. Also 10 line spectrum pairs are trans mitted as the vocal tract parameters. We examine the properties of line spec trum pairs and develop a new coding scheme for these parameters in Chapter 4. The developed software is available at the Electrical and Electronics Engi neering Department Library.
Interfram e D ifferen tial C od in g o f Line
S p ectru m P airs
C h a p te r 4
This chapter presents a new coding scheme for Line Spectrum Pairs (LSP’s). The vocal tract parameters or the LPC coefficients can be represented by the Line Spectrum Pairs which were first introduced by Itakura [12]. For a mini mum phase m}'^ order LPC polynomial,
= 1 -j- ciiz ^ + · · · + a„iZ (4-1) one can construct two (???, + !)*'* order polynomials, and Q,n+i{z), by setting the (rn + 1)·''^ reflection coefficient to 1 or -1. This is equivalent to setting tlie corresponding acoustic tube model completely closed or completely open at the (?n + 1)·^' stage. The LSP polynomials, F„,+i(r) and ^,,1+1(2), are defined as follows.
P;n+i{z) = /L„(2) + + (4.2)
and
Q,n+i{z) = A„Az) - (4.3)
It is obvious that P,n+i{z) is a symmetric polynomial and Q„,+i(2) is an anti symmetric polynomial. There cire three imjrortant properties of P,n^i{z) and Qni + l ( ~ ) ·
(i) All of the zeros of the LSP polynomials are on the unit circle,
(ii) the zeros of the symmetric and anti-symmetric LSP polynomials are in terlaced, and
(iii) the reconstructed LPC all-pole filter maintains its minimum phase prop erty, if the ]U'operties (i) and (ii) are preserved during the quantiziition procedure.
20
As the roots of P„i+i(z) and Q,n+\{z) are on the unit circle, the zeros of Pm+i{z) and c^ii be represented by their angles which are called the LSP frequencies.
In speech compression, the LPC filter coefficients are known to be inappropriate for quantization because of their relatively large dynamic range and possible filter instability problems. The LSP representation of spectral information has both well-behaved dynamic range and filter stability preserva tion property. Therefore it can be used to encode the LPC spectral information more efficiently than reflection coefficients of the LPC filter [10].
4.1
C o m p u ta tio n of L SP F requencies
In this section, computation of the LSP frequencies is examined, and one metliod is presented for the real time computation of the LSP frequencies.
As described in the previous section the polynomial P{z) (Q{z)) is a sym metric (anti-symmetric) polynomial, i.e.,
P{z) = 1 + piz~^ + · · · + p i2T-”‘ + -(771 + 1) (4.4)
(4.5) cuul
Q{z) = 1 + + ■ ■ —
If the order m is even then the polynomials P{z) and Q{z) have the roots +1 and —1, respectively which can be removed by a polynomial division. We get two new polynomials,
P(z) and G iW = 6 2 ( 0 = 1 + Q U ) 1 - г - '· (06) (4.7)
Let the order of the polynomials 6'i(z) and G-2{z) be 2n, 2?i. = m. Let us
represent the polynomials 6'i(~) and G2{z) as follows.
Gi{z) ^ \ + (ji{l)z ^ -f-· · · + (/i(n)z " + ---V - (2n - l ) _^- 2n (4.8) and
21
Polynomials, G\(^z) and contribute n pairs of conjugate zeros and the linear phase term can be removed to give two zero phase series expansion in cosines, i.e., G,{t-^'^) = t-^'^'^G\{uj) (4.10) cind 6'2(e-^"') = (4.11) where and
G'j(ce) = 2Go.s(niu) + 2^1 (l)Go.s((n — l)u;) + +2f/i(n - l)Go.s(cu) + </i(n)
G^ioj) = 2Co.s{nLo) + 2 g 2{l)C o s{{n — l ) t u ) +
+2</2(n - l)Go6'(cj) + g2{n)
(4.12)
(4.1.3)
The LSP frequencies are defined as the zeros of G'i(a;) and G2(o;). The LSP frequencies (or the zeros) can be found by tracing the frequency to between 0 and 27t. In real-time implementation the cosine functions bring a heavy com putational load. To overcome this problem we can use the frequency mapping X = Cosui. Then Cos{7v.u)) = l'm{x) where Tm{x) i-‘> ‘'-n order Cheby- shev polynomial in z. Now one can represent (4.12) and (4.13) in terms of Chebyshev polynomials [13] as follows.
^
c.,c-T/;(.'i;),
f or ¿ =1,2.
k=o
Using the backward recurrence relationship [14],
bk — 2 x b i^ ^ i — -| - Ci^tci
(4.14)
(4.15)
where {6^,.} is a sequence with initial conditions 6/\r = Gv+i = 0· Then and 1)2 ca.n be calculated with these initial conditions. G'[(;r) can be expressed in terms of bo and 62 as follows,
Gf x ) — ]^[^A,· — 2xhk^i -h 6yt+2]T)(;(;i·) k=0
bo — b2 + Cifi
2 1
.
2.
(4.16)This computation results in a numerically stable evaluation of the Chebysliev polynomial series. The search proceeds backwards from x — 1 to x = —1. The lociition of a zero is detected if a sign change occurs in G](.r). Once a
22
zero of the G\{x) is found then we search the zero of G'-2{x). This is due to
the interlacing property of the zeros of Gi(;r) and G'^i^x) polynomials. The algorithm continues in this way by interchanging the roles of the functions as each zero is found. The increment in this search algorithm should be chosen to be less than O.OOlo for a good precision on the zero loccitions.
4.2
D iffe ren tia l C oding o f LSP F requencies
In this section a new interframe differential coding scheme is presented for the LSP frequencies [15].
Let /l"o('') die LPC filter of the speech frame. Corresponding to 10 LSP frequencies can be uniquely defined. Let us denote the i*'’’ LSP frequency of the frame as / ” , i = 1,2,..., 10. The key idea of our scheme is to estimate the current LSP frequency, from {i — LSP frequency of the n^^'· frame, //Li, and LSP frequency of the {n — 1)‘'‘ frame, and to quantize the error between and the estimate, /¡ \ In this way, we not only exploit the relation between neighboring LSP frequencies but the relation between the LSP frequencies of the consecutive frames as well. The estimate, / ” , of the LSP frequency, / / ‘, is given by
./? = a" A,· + (4.17)
t = 1
«“( / ’Ll + A.) + ¿[.‘/ r ' г = 2,3,...,10
where a“ ’s and 6“ ’s are the adaptive predictor coefficients and A,· is an oilset factor which is the average angular difference between the and [i — LSP frequencies. The parameter. A,·, is experimentally determined. Predictor coef ficients a " ’s and 6“’s are ada])ted by the least mean square (LMS) algorithm.
«;· 6" where and jn — l + 71— 1 / ;i 7 + A, r r " d:'71— 1 ^ 1 Of: = Q U r ^ - i r ' l A, 0 < A.· < 2. A i ) ‘ + { / r ‘ r
The parameters, A/s, ¿ire also experimentally determined.
(4.18)
(4.19)
23
4.3
Q u antizer
The predictor defined in (4.14) is used in an ADPCM structure whose quan tizer is designed in the M.M.S.E. sense. A well-known method to design quan tizers is the generalized-Lloyd algorithm [16]. However, this algorithm usu ally converges to locally optimum quantizers. Recently simulated annealing based quantizer design algorithms were developed [17],[18],[19], and it was ob served that globally optimal solutions can be reached. In this thesis we use the stochastic relaxation algorithm [18]. We observed that stochastic relaxation algorithm produces better results than the generalized-Lloyd algorithm in the M.S.E. sense.
Stochastic rehixation method utilizes a probabilistic technique for finding globally optimal solutions to complex optimization problems. The main idea is to add an element of zero mean noise to each code vector following the centroid computations in each iteration of the generalized Lloyd algorithm. The noise variance (or the temperature) is then reduced monotonously as the iterations progress.
The design cdgorithm is as follows; (a) Code vector initializations:
Ij \ ) · · ·) .!/yV r n — 1 D o = C O
(b) Nearest neighbor repartition (i = 1,...,M ): j — argm in{\\xi — 7/;|| : 1 < / < A^}
Let Xi € B .j : decision region
D m D m + [[•'i-'i· — Vj
(c) Stopping criterion:
If {Dm-\ - Dm)/Dm < e stop else rn = m -b 1
(d) Centroid computation {i = 1,..., A'^): 1
|A I
,,(”0 _ _ i_ Y'
yi ~ |/i,|
(e) Code vector jiggling {i = 1,...,A^): S\(rm)
(rn) {m)
24
goto (b) where 5',· is the perturbation value which is a pseudo-random
number generated from a uniform distribution with zero mean and variance, Tin- There are various cooling schedules for we use the one described in [18],
T =
V^m + l j
(4^21) where al is the input variance.
The M.M.S.E. quantizer, which is designed by stochastic relaxation algo rithm, is also scaled during coding by using a backward adaptation structure. Let the current variance of the frame and LSP frequency be which is derived from quantizer output ¿is follows
71 ‘2 71-1 2
+ (1 - / ? ,) ( " ''.) (4.22) where are experimentally determined constants. In adaptation process each level of the quantizer is multiplied by the factor, where Qi is also an experimentally determined constant for the quantizer.
4.4
S im u la tio n E xam p les
In this section we present simulation examples and compare our results to other LSP freciuency coding schemes, including the scalar (vector) quantizer based method of Soong and .Juang [20] (Farvardin [21], Atal [22]).
The offset factors, A ,’s were estimated from a training set of 1200 speech frames. The M.M S.E quantizer was trained in a set of 1500 speech frames containing three male and three female persons. The performance of the inter frame LSP coding scheme was measured in a set of 3500 speech frames obtained from utterances of three male and three female persons.
VVe call our LSP coding scheme an interframe method because we not only use the current frame but also the previous frame to code the LSP frequencies of the current frame. A recent method by Soong and .Juang which quantize the intraframe differences of the consecutive LSP frequencies and / / i j reached better results thcui other scalar quantizers for LSP frequency coding methods [20]. We compcire our method to Soong and Juang’s method.
25
Table 4.1: Spectra.1 Distortion (SD) Performance of Intraframe and Interframe Coding Schemes TOTAL,BITS / FRAiME iiltraframe dB^ (20j interframe dB^ 24 3.00 1.72 25 2.60 1.45 26 2.30 1.33 27 2.00 1.16 28 1.80 1.02 29 1.60 0.91 . 30 1.40 0.87
d{A{u>), a'[oj]), which is defined in dB~ as follows
1 r
d{A{u),A ( a ;) ) = 7— / [B{u>)]'doj
27T J-ir (423)
where A.{uj) and /l ”(u-') are the original and the reconstructed LPC frequency responses respectively, and B{lo) is given by,
B{oj) = lOlog— ——^ - 10/o(/— ^12 B(i^’) is called the log spectral difference.
(4.24)
In Table 4.1 average log spectral distances for total number of bits used to code a set of LSP frequencies, /¿, i -= 1,2,..., 10, are given. In the second column of Table 1 coding results given in [20] are summarized. In third column, coding results of our method are described.
We also compare our method to vector quantizer based methods. Farvardin [21], and Atal [22] reached 1.0 clB spectral distortion at 24 bit/frame rate with vector ([uantizers. By using Huffman coding of the ciuantizer output, we reached lower bit rates for 1.0 dB spectral distortion in our method.
In these comparisons we consider the following distortion measure
which is used in [21], [22].
26
We used 6, 7, 8, and 9 level quantizers for Huffman coding, and obtained a single Huffman codebook for all 10 LSP frequencies. Table 2-3, give the results of Farvardin [21], Atal [22], and our method with Huffman coding, respectively. In terms of spectral distortion, our method is better than [21] and [22]. However percentage outliers of VQ based methods is lower than our method which is also well within the acceptable range, i.e., our method has < 2% outlier frames in the rcinge 2-4 d.B and has no outlier with spectral distortion > 4 dB [22].
Table 4.2: Spectral Distortion (SD) Performance of the Vector Quantizers [21] and [22]
Farvardin [21] Atal [22]
Rate Average Outliers Average Outliers
bits/fraine SD (dB) > 2dB(%) SD (dB) > 2dB(%) 22 - - 1.17 2.73% 23 - - 1.10 1.60% 24 1.11 1.50% 1.03 1.03% 25 1.02 0.20% 0.96 0.61% 26 0.97 0.05% 0.90 0.44% 27 0.94 0.02% -
-Table 4.3: Spectral Distortion (SD) Performance of the hiterframe Differential Coding with Entropy Coding
Quantizer level
Average Rate( bits / frame)
Average SD (dB) Outliers > 2dB(%) 6 23.45 1.04 2.80% 7 24.25 0.91 1.50% 8 26.55 0.82 0.77% 9 27.66 0.76 0.61%
Although we used different evaluation data sets than [20], [21] and [22] (The sets used in [20], [21] and [22] are also different from each other), we conclude the following points from our simulation examples. We observe that interframe differentiell coding of LSP frequencies is more advantageous than scalar intraframe coding. This improvement is achieved by slightly increasing the computational complexity of the coder. The performance of our coding
27
method is comparable to vector quantizer based methods and the compu tational complexity of our coder is much lower than vector quantizer based methods.
C h a p te r 5
C on clu sion
In this thesis, low bit rate speech coding techniques are examined. LPC vocoder i.s the earliest low bit rate speech coding method [1]. But the performance of the LPC vocoder depends on several important pcirameters such as, vocal tract parameters, pitch period, and gain and a good combination and continuity of these parameters. Simulations of the LPC vocoder showed that smoothing of these parameters in consecutive frames is necessary as well as good estimates ol these parameters. The most importcuit parameter is the pitch period. It is difficult to establish an error measure for pitch period estimation. However we observed that cepstrum method achieves better performance than AMDF method in sirnuhitions.
A recentl}' developed low bit rate speech coder is the CELP vocoder which also uses linear prediction, but the main difference of this method is the analysis-by-synthesis search procedures which form a closed-loop system. .Stochastic and adaptive codebook sizes are the most effective parameters for the performance of the CELP vocoder. Some implementations use 128 inte ger and 128 non-integer delays for adaptive codebook and this increase the performance of vocoder especially for female speech signal. But enlarging tlie codebook size creates a trade off with the increase in computational load of the search procedui'es.
In this thesis we also developed a new coding scheme for vocal tract pa rameters. The new interframe differential coding scheme outperformed the scalar quantizer based methods and reached the performance of vector quan tizer based methods. This improvement is achieved by slightly increasing the complexity of the scalar coders. The new LSP frequency coding method can be used both in LPC and CELP vocoders. This will result lower bit rates than ordinary LSP frequency coding methods.
29
An interframe vector quantization based differential coding scheme for LSP frequencies can be developed as a future work. This will increiise the computa tional complexity of our scheme however we believe that the performance will be better than other vector quantizer based methods.
R e fe r e n c e s
[1] L.R. Rabiner and R.W. Schafer. Digital Processing of Speech Signals. Prentice Hall, 1978.
[2] V.Cuperman B.S. Atal and A. Gensho. Advances in Speech Coding. Kluwer Academic Publishers, 1991.
[3] Halil Padir. /1« LPC Vocoder System. M.Sc. thesis, METU, 1983.
[4] B.S. Atal and S.L. Hanauer “Speech analysis and synthesis by linear prediction of the speech wave,” .}. Acoust. Soc. Am.., pp. 637-655, 1971. [5] J. Makhoul “Linear prediction; A tutorial review,” Proc. IEEE, vol. 63,
pp. 561-580, 1975.
[6] C.K. Un and S.C. Yang “A pitch e.xtrciction algorithm based on Ipc in verse filtering and amdf,” IEEE Trans, on Acoustics, Speech, and Signal Processing, vol. 25, pp. 565-572, December 1977.
[7] A. Cohen, R. Freudberg, M..J. Ross, ILL. Shaffer and H.J. Manley “Av erage magnitude difference function pitch extractor,” IEEE Trans, on Acoustics, Speech, and Signal Processing, vol. 22, pp. 353-362, October 1974.
[8] A.E. Rosenberg, L.R. Rabiner, M..J. Cheng and C.A.McGonegal “A com parative performance study of several pitch detection algorithms,” IEEE
Ti'ans. on Acoustics, Speech, and Signal Processing, vol. 24, pp. 399-418, October 1976.
[9] Military Agency for Standardization. “NATO stiirdardization agreement, Stanag 4196, parameters and coding characteristics that must be common to assure interoperability of 2400 bps linear predictive encoded digital speech,”.
[10] National Communications System Office of Technology and DC Standards, Washington. “Proposed federal standard 1016, analog to digitcd conversion
31
of radio voice by 4800 bit/second code excited linear prediction (CELP),” , September 1989.
[11] V.C. Welch, J.P. Campbell and T.E. Tremain. “The new 4800 bps voice coding standard,” . Military and Government Speech Tech’89 4800 bps Voice Coding Session. Arlington, Virginia, November 1989.
[12] F. Itakura “Line spectrum representation of linear predictive coefficients of speech signals,” Journal of Acoxtst. Soc. Am., p. .535a, 1975.
[13] P. Kcibal and R.P. Ramachaudran “The computation of line spectral Irequencies using chebyshev polynomials,” IEEE Irans. on Acoustics, Speexh, and Signal Processing, vol. 34, pp. 1419-1426, December 1986. [14] Kendall E. Atkinson. An hitroductioxi to Nximerical Anahjsis, chapter 4,
pp. 221-222. Wiley, 1988.
[15] E. Erzin and A. E. Çetin “Interframe differential coding of line spec trum pairs,” presented in 26-th Conference, on Information Sciences and Systems, Px'inceton, McU'ch 1992.
[16] A. Buzo Y. Linde and R.M. Gray “An algorithm for vector quantizer design,” IEEE Trans, on Com.xinicati.ons., vol. 28, pp. 84-95, .January 1980.
[17] A. Enis Çietin and V. Weerackody “Design of vector quantizers using simulated annealing," lEFfE Tnins. on Cix'cuits and Sxjstems, vol. 35, p. 1.550, 1988.
[18] K. Zeger and A. Gersho “Stochastic relaxation algorithm for improved vector quantiser design,” Electx'onics Lettex's, vol. 25, pp. 896-898, .July
1989.
[19] .1. Vaisey, K. Zeger and A. Gersho “Globally optimal vector quantizer de sign by stochastic relaxation.” IEEE Traxis. on Signal Processing, vol. 40, pp. 310-322, February 1992.
[20] F. Soong and B.H. .Juang. “Optimal quantization of Isp parameters,” , accepted for publication in IEEE Trans, on Signal Processing.
[21] N. Pha.mdo, R. Laroia and N. Farvardin “Robust and efficient quantization of Isp parameters using structured vector qucintizers,” Proc. of the Int. Conf. on Acoustics, Speech and Signal Processing 1991 (ICASSP ’91), pp. 641-645, May 1991.
32
[22] K.K. Paliwal and B.S. Atal “Efficient vector quantization of Ipc parameters at 24 bits/fram e,” Proc. of the Int. Conf. on Acoustics, Speech and Signal Processing 1991 (ICASSP ’91), pp. 661-664, May 1991.

![Table 4.2: Spectral Distortion (SD) Performance of the Vector Quantizers [21]](https://thumb-eu.123doks.com/thumbv2/9libnet/5865720.120693/37.959.248.715.483.692/table-spectral-distortion-sd-performance-vector-quantizers.webp)
