DESIGNING NOVEL DENO
XCATALYSTS WITH A WIDE
THERMAL OPERATIONAL WINDOW
A THESIS SUBMITTED TO
THE GRADUATE SCHOOL OF ENGINEERING AND SCIENCE OF BILKENT UNIVERSITY
IN PARTIAL FULFILLMENT OF THE REQUIREMENTS FOR THE DEGREE OF MASTER OF SCIENCE IN CHEMISTRY By Merve Tohumeken June 2016
DESIGNING NOVEL DENOX CATALYSTS WITH A WIDE THERMAL
OPERATIONAL WINDOW By Merve Tohumeken
June 2016
We certify that we have read this thesis and that in our opinion it is fully adequate, in scope and in quality, as a thesis for the degree of Master of Science.
_______________________ Emrah Özensoy (Advisor)
_______________________ Ömer Dağ
_______________________ Nuray Oktar
Approved for the Graduate School of Engineering and Science:
_______________________ Levent Onural
i
ABSTRACT
DESIGNING NOVEL DENO
XCATALYSTS WITH A WIDE
THERMAL OPERATIONAL WINDOW
Merve Tohumeken M.S. in Chemistry Advisor: Emrah Özensoy
June 2016
The main objective of this study is to design novel DeNOx catalyst to widen
the operational temperature range of exhaust emission control systems. For this purpose, single and multi NOx-storage domains (e.g. K2O, BaO) were loaded on an
Al2O3/ZrO2/TiO2 (AZT) ternary mixed oxide support with various compositions
and different catalytic systems were synthesized by utilizing sol-gel and wetness impregnation methods. These materials were characterized by means of XRD, N2
sorption, in-situ FTIR and TPD measurements in comparison to the Pt/20Ba/Al benchmark catalyst. K2O and BaO co-loading on AZT sample reveals better
platinum dispersion than that of the single storage domain materials. Particularly, Pt/5.4K-8Ba/AZT system revealed promising NOx storage capacity (NSC) and high
sulfur removal performance. NOx/SOx adsorption geometries and stabilities of the
generated adsorbates were analyzed using in-situ FTIR and TPD. Although the Pt/20Ba/AZT and Pt/10K/AZT catalysts revealed high NSC, they showed poor sulfur regeneration characteristics. In conclusion, it was demonstrated that K2O and
BaO co-impregnated samples can be utilized to design new catalytic architectures to modify the operational temperature window of exhaust emission control catalysts.
ii
Keywords: NSR/DeNOx catalysts, Al2O3/ZrO2/TiO2, K2O, BaO, Pt, NOx storage
iii
ÖZET
GENİŞ SICAKLIK ARALIĞINDA ÇALIŞABİLEN YENİ NESİL
DENO
XKATALİZÖRLERİNİN TASARIMI
Merve Tohumeken Kimya, Yüksek Lisans Tez Danışmanı: Emrah Özensoy
Haziran 2016
Bu çalışmanın temel amacı, geniş sıcaklık aralığında çalışabilen yeni nesil DeNOx katalizörlerini dizayn etmek ve bu katalizörlerin fonksiyonel ve
karakteristik özelliklerini incelemektir. Bu amaç için, tek yada çoklu (NOx
depolayıcı ) bazik oksitler çeşitli oranlarda Al2O3/ZrO2/TiO2 üçlü metal oksitin
üzerine eklendi ve ıslak emdirme ve sol-gel yöntemleri kullanılarak farklı katalizör sistemleri elde edildi. XRD, N2 tutma, FTIR and TPD deneyleri ile bu katalizör
sistemlerinin fonksiyonel ve karakteristik özellikleri incelendi ve referans katalizör olarak kullanılan Pt/20Ba/Al ile karşılaştırıldı. Bu deneylerin sonuçları ışığında, K2O and BaO oksitlerinin AZT malzemesi üzerine birlikte eklenmesi, tekli
yüklemelere kıyasla katalizörün üzerinde daha iyi platin metali dağılımı sağlamaktadır. Pt/5.4K-8Ba/AZT malzemesi optimum NOx depolama kapasitesine
sahiptir ayrıca bu malzemenin kükürt zehirlenmesine karşı yüksek dirence sahip olduğu gözlenmiştir. NOx/SOx gazlarının yüzeye tutunma geometrileri ve
dayanıklılığı FTIR ve TPD deneyleri ile ölçüldü. Pt/20Ba/AZT ve Pt/10K/AZT katlizörleri yüksek NOx depolama kapasitesine sahiptir ama kükürt
iv
malzemelerini birlikte ekleme metodu geniş aralıklarda çalışabilen yeni nesil katalizörlerini tasarlamada kullanılabileceği saptanmıştır.
Anahtar sözcükler: NSR/DeNOx katalizörleri, Al2O3/ZrO2/TiO2, K2O, BaO, Pt,
v
Acknowledgement
First and foremost, I would like to express the deepest gratitude to my advisor Assoc. Prof. Emrah Özensoy. He enabled me to gain a broad scientific perspective, let me be part of his research group, and patiently followed my maturation and completion of this work. I would like to thank him for his knowledge, encouragement, supervision, patience and guidance throughout my studies.
I also would like to thank especially to Zafer Say for sharing his knowledge, collaboration and the precious time that he has shared with me through my undergraduate and graduate studies. I would like to express my sincere appreciations to Zehra Aybegüm Samast for valuable scientific
discussions and emotional support. I wish to thank to Pelin Paşabeyoğlu for her support and encouragement.
I want to express my thanks to our group members Kerem Emre Ercan, Deniz Erdoğan, Merve Kurt, Merve Balcı, Mustafa Çağlayan, Mustafa Karatok, and Elif Perşembe. We shared lots of memories in the Ozensoy group.
I also wish to acknowledge chemistry department members, Gülbahar Saat, Pınar Alsaç, Ethem Anber, Fadime Balcı, Deniz Gökçeaslan who have provided my memories.
During all the time in Bilkent, I have been very pleased to be with you, Irmak Özferendeci, Betül Turgut, Selge Çatlı and Zeynep Türel.
I also would like to acknowledge TUBITAK for financial support.
I am immeasurably indebted to my two huge families which have constantly supported and encouraged me during my graduate study. ‘The Kunt and Tohumeken Family.’ Especially to my husband, Şehmus Tohumeken for his continuous support and unconditional love.
vi
vii
Contents
Chapter 1 ... 1
Introduction... 1
1.1 Emissions of Air Pollutants from Transport ... 1
1.2 General Information about NOx Storage Reduction Catalysts ... 3
1.3 NSR Reaction Mechanism ... 5
1.4 Components of NSR Catalysts ... 7
1.5 Deactivation Mechanism of NSR Catalysts ... 9
1.6 Aim of the Present Study ... 10
Chapter 2 ... 11
Experimental ... 11
2.1 Sample Preparation ... 11
2.1.1 Synthesis of Ternary Oxides: Pt/Al2O3/ZrO2/TiO2 ... 11
2.1.2 Synthesis of Pt/ K2O/ Al2O3/ZrO2/TiO2 Samples ... 12
2.1.3 Synthesis of Pt/BaO/Al2O3/ZrO2/TiO2 Samples ... 13
2.1.4 Synthesis of Pt/K2O-BaO /Al2O3/ZrO2/TiO2 Samples ... 13
2.2 Instrumentation ... 14
viii
2.2.2 In-situ FTIR Spectroscopy and Temperature Programmed Desorption
Analysis ... 15
2.3 Experimental Procedures ... 17
2.3.1 NOx Adsorption via in-situ FTIR ... 17
2.3.2 NOx Reduction via in-situ FTIR ... 17
2.3.3 SOx Adsorption via in-situ FTIR... 18
2.3.4 SOx Reduction via in-situ FTIR ... 18
2.3.5 NOx Desorption via TPD ... 18
2.3.6 SOx Desorption via TPD ... 19
Chapter 3 ... 20
Results and Discussion ... 20
3.1 Structural Characterization of the Materials ... 20
3.1.1 XRD Analysis ... 20
3.1.2 BET Analysis ... 23
3.2 In situ FTIR Analysis ... 26
3.2.1 NOx Adsorption Analysis ... 26
3.2.1.1 NOx Adsorption Analysis of Single Storage Domain Materials ... 26
3.2.1.2 NOx Adsorption Analysis of Multi Storage Domain Materials ... 28
3.2.2 NOx Reduction Analysis ... 31
ix
3.2.2.2 NOx Reduction Analysis of Multi Storage Domain Materials ... 34
3.2.3 SOx Adsorption Analysis ... 37
3.2.3.1 SOx Adsorption Analysis of Single Storage Domain Materials ... 38
3.2.3.2 SOx Adsorption Analysis of Multi Storage Domain Materials ... 41
3.2.4 SOx Reduction Analysis ... 43
3.2.4.1 SOx Reduction Analysis of Single Storage Domain Materials ... 44
3.2.4.2 SOx Reduction Analysis of Multi Storage Domain Materials ... 46
3.3 TPD Analysis ... 48
3.3.1 NOx TPD Analysis ... 48
3.3.1.1 NOx TPD Analysis Single Storage Domain Materials ... 51
3.3.1.2 NOx TPD Analysis of Multi Storage Domain Materials ... 56
3.3.2 SOx TPD Analysis ... 60
3.3.2.1 SOx TPD Analysis of Single Storage Domain Materials ... 61
3.3.2.2 SOx TPD Analysis of Multi Storage Domain Materials ... 65
Chapter 4 ... 69
Conclusion ... 69
x
List of Figures
Figure 1 : Contribution of the transport sector to the total emissions of main air pollutants (Copyright notice © European Environment Agency, 2014[2].) ... 2 Figure 2 : The mortality rate from air pollution varied among WHO regions and the distribution of deaths attributable to air pollution by disease type (Copyright notice © World Health Organization, 2016[4].) ... 3 Figure 3 : Schematic illustration of the general operation principle of NSR catalysts (Copyright © 2011 Elsevier. Reproduced with permission from ref [21]). ... 5 Figure 4: Schematic diagram of in situ FTIR and TPD analysis system [47]... 16 Figure 5 : XRD patterns of the Pt/AZT, Pt/8Ba/AZT, Pt/20Ba/AZT and Pt/20Ba/Al (benchmark) catalysts calcined at 973 K. ... 21 Figure 6 : XRD patterns of the Pt/AZT, Pt/2.7K/AZT, Pt/5.4K/AZT and Pt/20Ba/Al (benchmark) catalysts calcined at 973 K. ... 22 Figure 7 : XRD patterns of the Pt/2.7K-8BaAZT, Pt/2.7K-20Ba/AZT, Pt/5.4K-8Ba/AZT and Pt/5.4K-20Ba/AZT catalysts calcined at 973 K. ... 23 Figure 8 : BET specific surface area values for the Pt/AZT, Pt/8Ba/AZT, Pt/20Ba/AZT catalysts and Pt/20Ba/Al benchmark catalyst after calcination at 973 K. ... 24 Figure 9 : BET specific surface area values for the Pt/AZT, Pt/2.7K/AZT, Pt/5.4K/AZT catalysts and Pt/20Ba/Al benchmark catalyst after calcination at 973 K. ... 25
xi
Figure 10 : BET specific surface area values for the K2O –BaO co-impregnated
Pt/2.7K-8Ba/AZT, Pt/2.7K-20Ba/AZT, Pt/5.4K-8Ba/AZT and Pt/5.4K-20Ba/AZT catalysts after calcination at 973K. ... 26 Figure 11 : In-situ FTIR spectra of stepwise NO2 (g) adsorption on activated a)
Pt/AZT, b) Pt/8Ba/AZT and c) Pt/20Ba/AZT at 323 K. The topmost spectrum belongs to the saturated surfaces. ... 27 Figure 12 : In-situ FTIR spectra of stepwise NO2 (g) adsorption on activated a)
Pt/AZT, b) Pt/2.7K/AZT and c) Pt/5.4K/AZT at 323 K. The topmost spectrum belongs to saturated surface. ... 28 Figure 13 : In-situ FTIR spectra of stepwise NO2 (g) adsorption on activated a)
Pt/AZT, b) Pt/8Ba/AZT, c) Pt/2.7K-8Ba/AZT and d) Pt/5.4K-8Ba/AZT at 323 K. The topmost spectrum belongs to saturated surface. ... 30 Figure 14 : In-situ FTIR spectra of stepwise NO2 (g) adsorption on activated a)
Pt/AZT, b) Pt/20Ba/AZT, c) Pt/2.7K-20Ba/AZT and d) Pt/5.4K-20Ba/AZT at 323 K. The topmost spectrum belongs to saturated surface... 31 Figure 15 : In-situ FTIR spectra of NO2 (g) reduction via H2(g) on a) Pt/AZT, b)
Pt/8Ba/AZT and c) Pt/20Ba/AZT. ... 32 Figure 16 : Schematic representation of nitrate reduction mechanism. (Copyright © 2014 Elsevier. Reproduced with permission from ref [68]). ... 33 Figure 17 : In-situ FTIR spectra of NO2 (g) reduction via H2 (g) on a) Pt/AZT, b)
Pt/2.7K/AZT and c) Pt/5.4K/AZT. ... 34 Figure 18 : In-situ FTIR spectra of NO2 (g) reduction via H2 (g) on saturated a)
xii
Figure 19 : In-situ FTIR spectra of NO2 (g) reduction via H2 (g) on saturated a)
Pt/AZT, b) Pt/20Ba/AZT, c) Pt/2.7K-20Ba/AZT and d) Pt/5.4.K-20Ba/AZT. .... 37 Figure 20 : In-situ FTIR spectra related to the SOx uptake properties of a) Pt/AZT,
b) Pt/8Ba/AZT, c) Pt/20Ba/AZT and d) Pt/20Ba/Al that are exposed to 2 Torr SOx
at 323 K, followed by annealing at 373, 473, 573 and 673 K in the presence of the SOx gas mixture for 5 min. ... 38
Figure 21 : In-situ FTIR spectra related to the SOx uptake properties of a) Pt/AZT,
b)Pt/2.7K/AZT, c)Pt/5.4K/AZT and d) Pt/10K/AZT exposed to 2 Torr SOx at 323
K, followed by annealing at 373, 473, 573 and 673 K in the presence of SOx gas
mixture for 5 min (Copyright © 2016 Elsevier. Reproduced with permission from ref [49]). ... 39 Figure 22 : In-situ FTIR spectra related to SOx uptake properties of a) Pt/AZT, b)
Pt/8Ba/AZT, c) Pt/2.7K-8Ba/AZT and d) Pt/5.4K-8Ba/AZT exposed to 2 Torr SOx
at 323 K, followed by annealing at 373, 473, 573 and 673 K in the presence of SOx
gas mixture for 5 min. ... 41 Figure 23 : In-situ FTIR spectra related to SOx uptake properties of a) Pt/AZT, b)
Pt/20Ba/AZT, c) Pt/2.7K-20Ba/AZT and d) Pt/5.4K-20Ba/AZT that exposed to 2 Torr SOx at 323 K, followed by annealing at 373, 473, 573 and 673 K in the
presence of SOx gas mixture for 5 min. ... 42
Figure 24 : In-situ FTIR spectra related to SOx reduction properties of a) Pt/AZT,
b) Pt/8Ba/AZT, c) Pt/20Ba/AZT and d) Pt/20Ba/Al samples via H2 (g). The
catalysts were initially poisoned by 2 Torr SOx. After evacuation, poisoned samples
were exposed to 15 Torr H2 (g) at 323, 473, 673 and 773 K for 5 min. All spectra
xiii
Figure 25 : In-situ FTIR spectra related to SOx reduction properties of a) Pt/AZT,
b)Pt/2.7K/AZT, c)Pt/5.4K/AZT and d) Pt/10K/AZT samples via H2 (g). The
poisoned samples were exposed to 15 Torr H2 (g) at 323, 473, 673, 773 and 873 K
for 5 min. All spectra were acquired at 323 K(Copyright © 2016 Elsevier. Reproduced with permission from ref. Copyright 2016 Elsevier B.V. [49]. ... 45 Figure 26 : In-situ FTIR spectra related to SOx reduction properties of a) Pt/AZT,
b) Pt/8Ba/AZT c) Pt/2.7K-8Ba/AZT, d) Pt/5.4K-8Ba/AZT and samples via H2 (g).
The poisoned samples were exposed to 15 Torr H2 (g) at 323, 473, 673, 773 and
873 K for 5 min. All spectra were acquired at 323 K. ... 46 Figure 27 : In-situ FTIR spectra related to SOx reduction properties of a) Pt/AZT,
b) Pt/20Ba/AZT c) Pt/2.7K-20Ba/AZT, d) Pt/5.4K-20Ba/AZT and samples via H2
(g). The poisoned samples were exposed to 15 Torr H2 (g) at 323, 473, 673, 773 and
873 K for 5 min. All spectra were acquired at 323 K. ... 47 Figure 28 : NOx TPD profiles for a) Pt/AZT, b) Pt/8Ba/AZT c) Pt/20Ba/AZT, d)
Pt/20Ba/Al samples after saturation with 5 Torr NO2 (g) at 323 K for 10 min. The
inset spectra in each panel represent in-situ FTIR spectra before (black) and after (red) TPD analysis... 51 Figure 29 : Surface area normalized NSC values of BaO loaded AZT catalysts obtained from integrated NOx TPD signals. ... 53
Figure 30 : NOx TPD profiles for a) Pt/AZT, b) Pt/2.7KAZT c) Pt/5.4K/AZT, d)
Pt/10K/AZT samples after saturation with 5 Torr NO2 (g) at 323 K for 10 min. The
inset spectra in each panel represent in-situ FTIR spectra before (black) and after (red) TPD analysis... 54
xiv
Figure 31 : Surface area normalized NSC values of K2O loaded AZT catalysts
obtained from integrated NOx TPD signals. ... 55
Figure 32 : NOx TPD profiles for a) Pt/AZT, b) Pt/8Ba/AZT c) Pt/2.7K-8Ba/AZT,
d) Pt/5.4K-8Ba/AZT samples after saturation with 5 Torr NO2 (g) at 323 K for 10
min. The inset spectra in each panel represent in-situ FTIR spectra before (black) and after (red) TPD analysis. ... 56 Figure 33 : Surface area normalized NSC values of K2O-BaO co-loaded AZT
catalysts containing 8 wt.% BaO obtained from integrated NOx TPD signals. .... 57
Figure 34 : NOx TPD profiles for a) Pt/AZT, b) Pt/20Ba/AZT c)
Pt/2.7K-20Ba/AZT, d) Pt/5.4K-20Ba/AZT samples after saturation with 5 Torr NO2 (g) at
323 K for 10 min. The inset spectra in each panel represent in-situ FTIR spectra before (black) and after (red) TPD analysis. ... 58 Figure 35 : Surface area normalized NSC values of K2O-BaO co-loaded AZT
catalysts containing 20 wt.% BaO obtained from integrated NOx TPD signals. .. 59
Figure 36 : Surface area normalized relative “NOx-slip” values of K2O-BaO
co-loaded AZT catalysts at T < 573 K, containing 20 wt.% BaO obtained from integrated NOx TPD signals. ... 60
Figure 37 : SOx TPD profiles for a) Pt/AZT, b) Pt/8Ba/AZT c) Pt/20Ba/AZT, d)
Pt/20Ba/Al samples after 2 Torr SOx adsorption at 673 K for 30 min. ... 61
Figure 38 : In-situ FTIR spectra corresponding to residual sulfur content on Pt/AZT, Pt/8Ba/AZT, Pt/20Ba/AZT and Pt/20Ba/Al samples before (black) and after (red) SOx TPD experiments. ... 62
Figure 39 : TPD profiles for a) Pt/AZT, b) Pt/2.7K/AZT c) Pt/5.4K/AZT, d) Pt/10K/AZT samples after 2 Torr SOx adsorption at 673 K for 30 min. ... 63
xv
Figure 40 : In-situ FTIR spectra corresponding to residual sulfur content on Pt/AZT, Pt/2.7K/AZT, Pt/5.4K/AZT and Pt/10K/AZT samples before (black) and after (red) SOx TPD experiment. ... 64
Figure 41 : TPD profiles for a) Pt/AZT, b) Pt/8Ba/AZT c) Pt/2.7K-8Ba/AZT, d) Pt/5.4K-8Ba/AZT samples after 2 Torr SOx adsorption at 673 K for 30 min. ... 65
Figure 42 : FTIR spectra corresponding to residual sulfur content on Pt/AZT, Pt/8Ba/AZT, Pt/2.7K-8Ba/AZT and Pt/5.4K-8Ba/AZT and samples before (black) and after (red) SOx TPD experiments. ... 66
Figure 43 : TPD profiles for a) Pt/AZT, b) Pt/20Ba/AZT c) Pt/2.7K-20Ba/AZT, d) Pt/5.4K-20Ba/AZT samples after 2 Torr SOx adsorption at 673 K for 30 min. ... 67
Figure 44 : In-situ FTIR spectra corresponding to residual sulfur content on Pt/AZT, Pt/20Ba/AZT, Pt/2.7K-20Ba/AZT and Pt/5.4K-20Ba/AZT and samples before (black) and after (red) SOx TPD experiments. ... 68
xvi
List of Table
Table 1 : Vibrational frequencies of NO3− and NO2− in inorganic coordination
compounds (Copyright © 2003 Wiley. Reproduced with permission from ref [34]). ... 7
xvii
List of Abbreviations
BET: Brunauer-Emmett-Teller
EDX: Energy-Dispersive X-ray spectroscopy FTIR: Fourier Transform Infrared Spectroscopy IR: Infrared
JCPDS: Joint Committee on Powder Diffraction Standards NIST: National Institute of Standards and Technology NOx: Nitrogen Oxides (e.g. N2O, NO, NO2)
NSR: NOx Storage and Reduction
NSC: NOx Storage Capacity
PGM: Platinum Group Metal
PID: Proportional Integral Derivative RT: Room Temperature
QMS: Quadruple Mass Spectrometer SCR: Selective Catalytic Reduction SOx: Sulfur Oxides (e.g. SO2, SO3)
SSA: Specific Surface Area
1
Chapter 1
Introduction
1.1 Emissions of Air Pollutants from Transport
Union of Concerned Scientists states that more than half of the carbon monoxide (CO) and nitrogen oxides (NOx), and almost a quarter of the
hydrocarbons are emitted into air by vehicles in 2013[1]. Air pollution causes serious risks for human health and the environment. Some of the major pollutants that are generated by mobile sources are particulate matter (PM), hydrocarbons, carbon monoxide, nitric oxide, sulfur dioxide and non-methane volatile organic compounds (NMVOC) and other greenhouse gases. Diesel exhaust is the major contributor of PM pollution, which threatens the human health the most by penetrating deeply into lung tissue and causing various respiratory diseases[1]. Hydrocarbons irritate the respiratory system and reduce oxygen intake capacity while nitrogen oxide causes lung irritation, pneumonia and influenza, affecting the immune system[1].
2
Figure 1 : Contribution of the transport sector to the total emissions of main air pollutants (Copyright notice © European Environment Agency, 2014[2].)
Figure 1 demonstrates the contribution of transportation to the emission of air pollutants published by European Environment Agency (EEA)[2]. Transportation sector achieved important emission reductions in the 1990-2012 period. These reductions were mostly in CO and NMVOC emissions, which decreased both by 81 % together with NOx (33 %), SOx (26 %) and particulates[2].
However, these emission reductions should be continuously sustained to minimize severe environmental and health implications.
World Health Organization (WHO) committee reported that ambient air pollution (from traffic, industrial sources, and residual of fuel combustion) caused 3.0 million deaths in 2012[3].
Air pollution also causes cardiovascular diseases, stroke, chronic obstructive pulmonary disease and lung cancer, as well as increasing the risks for
3
respiratory infections. Figure 2 shows the distribution of deaths attributable to air pollution by disease type[4].
Figure 2 : The mortality rate from air pollution varied among WHO regions and the distribution of deaths attributable to air pollution by disease type (Copyright notice © World Health Organization, 2016[4].)
1.2 General Information about NO
xStorage Reduction Catalysts
Gasoline engines operate under stoichiometric conditions with an air to fuel ratio (A/F) of 14.7[5]. Three way catalysts (TWC) work efficiently for this A/F to reduce NOx from exhaust gases. Lean-burn gasoline and diesel engines are more
preferable due to their lower fuel consumption and CO2 emission [6-9]. However,
these engines operate with A/F in the range of 20:1 to 65:1[6, 10, 11]. Due to the presence of excess oxygen, TWCs are inefficient to reduce NOx in the diesel
exhaust emission [6, 7, 12].
NOx gases emitted from the mobile sources have devastating effects on
4
ozone smog and eutrophication [13]. Klingstedt et al. reported that half of the total global toxic emissions was generated by mobile vehicles. Thus, stringent limitations were introduced for the regulation of mobile emission sources [14]. Recently, it was reported that some of the existing diesel engine cars in the market exceeded the NOx emission limits by more than 20 times [15].
To control NOx emissions from mobile engines, new technologies were
innovated. Some of the emission control technologies include direct decomposition of NOx, selective catalytic reduction (SCR) of NOx and NOx storage reduction
(NSR) systems [12]. Direct decomposition of NOx is favorable at elevated
temperatures and require very high activation energies, which cannot be attained in mobile applications [16]. SCR technology can be utilized in three different forms: i) hydrocarbon-SCR, ii) plasma assisted-SCR and iii) ammonia (urea)-SCR [17, 18]. Urea-SCR is the most commonly used technology, while it presents various important challenges such as injection problems, continuous control and refilling of the urea tank etc [19]. NOx Storage Reduction (NSR) technology innovated by
Toyota Motor Company is a promising technology as it does not require any external reducing agents [20]. This technology is comprised of two main catalytic cycles, which are the NOx storage and the NOx reduction cycles. In the storage cycle
(i.e. lean cycle), NO is oxidized to NO2 on precious metal active sites (e.g. Pt) and
then NO2 is stored on basic storage sites. In the reduction cycle (i.e. rich cycle),
stored NOx is removed from storage sites and reduced to N2 on precious metal sites.
NSR catalysts operate in a cyclic manner by switching between lean and rich conditions (Figure 3).
5
Figure 3 : Schematic illustration of the general operation principle of NSR catalysts (Copyright © 2011 Elsevier. Reproduced with permission from ref [21]).
1.3 NSR Reaction Mechanism
Despite a vast number of previously published reports, role of each of the catalytic components in NSR systems and the interaction between these components are still under debate[12, 22]. Furthermore, the mechanism of the NSR catalyst (storage and reduction process) is also not entirely clear. There exist a number of formerly proposed NOx storage mechanisms on surface of the catalyst.
One of the proposed mechanisms for the NO oxidation process includes the following steps [23, 24]:
Step 1: NO + Pt→NO–Pt (1)
Step 2: O2 + 2Pt→2O–Pt (2)
Step 3: NO–Pt + O–Pt→NO2–Pt + Pt (3)
6
As shown above, NO is oxidized on Pt metal surface to NO2 and it does not
directly take part in the NOx trapping process. Although this proposed mechanism
is promising for NO oxidation process, an undefined rate determining step is still unclear [25, 26]. Furthermore, Olsson et al. reported that a vacant Pt site (reaction 1 and 4) and oxidation of the metallic Pt sites ( PtO and PtO2 ) decrease the NO
oxidation activity[27, 28].
In order to explain the role of the basic metal oxide (e.g. BaO) sites in the NOx storage process, Olsson et al. suggested a reaction pathway as follows [29, 30]:
BaO + NO2 → BaO-NO2 (5)
BaO-NO2 → BaO2 + NO (6)
BaO2 + NO2 → BaO-(NO3) (7)
BaO-(NO3) + NO2 → Ba(NO3)2 (8)
It is also worth mentioning that BaO can store NO2 more effectively than
NO[31].
Furthermore, nitric oxide reacts with the surface oxygen of oxides to yield nitrite and nitrate compounds[32, 33]. Their spectral identifications can be carried out by analogy with corresponding spectra of inorganic complexes in Table 1. The variations in nitrite/nitrate adsorption geometries reflects the differences in surface properties. Also, corresponding IR spectra reflect the differences in the ionic– covalent properties of the metal–oxygen bonds on the surface[34].
7
Table 1 : Vibrational frequencies of NO3− and NO2− in inorganic coordination
compounds (Copyright © 2003 Wiley. Reproduced with permission from ref [34]).
1.4 Components of NSR Catalysts
Typical NSR catalysts consist of three main components; these are platinum group metals, NOx storage components and support metal oxides. Pt/20Ba/Al
sample containing 1 wt. %Pt and 20wt. % BaO on γ-Al2O3 is known as the
conventional benchmark catalyst. As a platinum group metal (PGM) component, Pt metal is commonly used in both oxidation and reduction processes. As mentioned earlier, on the active platinum surface, NO is oxidized and stored under lean conditions and under rich conditions, NOx is reduced to N2.
8
Basic oxides such as BaO, K2O, SrO and CeO2 can be used as storage
components in NSR catalysts. In the current work, BaO and K2O were exploited to
synthesize complex NSR catalysts. BaO is commonly used as the conventional storage material, but this material is not efficient in NOx storage at T ≥ 673 K
[35-38]. On the other hand, K2O is capable of storing NOx at T ≥ 573 K[39, 40]. In the
current study, both BaO or K2O are utilized simultaneously to expand the thermal
operational window of NSR systems [39].
As a support metal oxide, alumina (Al2O3) is commonly used due to its high
SSA and thermal stability. Furthermore, alumina has also NOx storage capability
and improves NSC of NSR systems[39].
In this work, instead of alumina, a novel Al2O3/ZrO2/TiO2 (AZT) ternary
mixed oxide was used. Since, BaO reacts with Al2O3 to form BaAl2O4 causing a
decreasing the NSC, using AZT is an attempt to prevent the formation of such unwanted phases. TiO2 is used because of its high tolerance against sulfur poisoning
due to its higher surface acidity than alumina [20, 41-43]. The interaction between TiO2 and BaO samples causes the formation of inactive BaTiOx phases. In order to
avoid such phenomena, ZrO2 is used as a solid diffusion barrier between TiO2 and
9
1.5 Deactivation Mechanism of NSR Catalysts
Sulfur poisoning and thermal aging are some of the most prominent deactivation mechanisms that affect the long-term performance of NSR catalysts.
NOx and SOx are both acidic gases, thus they compete with each other for the
adsorption sites on the basic oxide surfaces. It is known that BaSO4 (ΔG(BaSO4 =
56.89 kJ/mol) has a very high thermodynamic stability compared to that of Ba(NO3)2 (ΔG(Ba(NO3)2 = 13.31 kJ/mol) [44] . Hence, BaSO4 formation
suppresses the NOx adsorption and NOx storage capacity (NSC) of the catalyst is
decreased [45-47]. Al2(SO4)3 is also formed upon sulfur poisoning. Al2(SO4)3 can
plug the pores of the catalyst and suppresses the availability of active sites, and decreases the performance of the NSR catalysts[20]. Although sulfur concentration in diesel fuel has been significantly reduced over the recent years (e.g. Ultra Low Sulfur Diesel, ULSD has only 15 ppm of total sulfur content), complete removal of sulfur is still a technological and financial challenge for the petroleum refining industry.
In order to recover the catalyst surface and keep NSR performance stable, the sulfated surface should be regenerated. For this purpose, sample is heated to high temperatures (e.g. > 873 K). While heating the sample, thermal aging of the catalyst can occur. In addition, under rich conditions, oxidation of the reducing agent (i.e. hydrocarbon, CO and H2) generates heat on the surface of the catalyst and causes
thermal aging. Such exothermic processes also results in the agglomeration of Pt particles and significant loss of Pt surface area [12, 48].
10
1.6 Aim of the Present Study
This study will mainly focus on investigating the effect of utilizing multiple basic oxides on the NSC of NSR systems. BaO based catalysts are very sensitive to sulfur species. Sulfur removal performance of the NSR catalysts can also be improved by using K2O (ca. 650 K) as the thermodynamic stability of sulfates on
K2O is lower than that of BaO (ca. 750 K) [20, 49]. Furthermore, the basicity of
the NOx storage component is directly related to the NOx trapping performance.
Different basic oxide NSC performances were investigated at various temperatures and found out to be increasing in the following order: K > Ba > Sr > Na > Ca > Li [12, 50]. Thus in the current work, K2O is selected in attempt to improve the sulfur
removal performance as well as the NSC.
Another important motivation of this work is that conventional benchmark catalyst (Pt/BaO/Al) is efficient in NOx adsorption and storage within 473-673 K,
but gasoline direct injection engines can operate at temperatures above 673 K. At these elevated temperatures, conventional benchmark catalyst cannot perform effectively [51]. Hence, simultaneous utilization of K2O and BaO can be effective
in NSR applications [52]. A noteworthy advantage of K2O based catalysts is also
associated to their stronger basicity and prevention of the formation of the undesired BaAl2O4 species in concomitant with their enhanced NSC at 523-823 K [53].
11
Chapter 2
Experimental
2.1 Sample Preparation
2.1.1 Synthesis of Ternary Oxides: Pt/Al
2O
3/ZrO
2/TiO
2The Pt/Al2O3/ZrO2/TiO2 mixed oxides were synthesized using a sol-gel
method. For this synthesis protocol, aluminum sec-butoxide (Sigma Aldrich, ACS Reagent, 97%) precursor was initially dissolved in 30 mL of 2-propanol (Sigma Aldrich, ACS Reagent >99.5%) and stirred for 10 min under ambient conditions. Then, titanium (IV) isopropoxide (Sigma Aldrich, ACS Reagent, 97%) and 20 mL of 2-propanol were added to the solution and stirred for 10 min. After zirconium (IV) propoxide (Sigma Aldrich, ACS Reagent, 70 wt. % in 1-propanol) and 50 mL of 2-propanol were added, the slurry was stirred for 10 min under ambient conditions. In order to obtain gel formation of ternary oxides, 9 mL of 0.5 M nitric acid solution (Sigma Aldrich, ACS Reagent, 65%) were added in a dropwise fashion. Before calcination in air at 973 K, material was dried under ambient condition for 48 h. The nominal composition of the synthesized material by weight was Al2O3:ZrO2:TiO2 = 50:35:15 and this material will be abbreviated as AZT
throughout the text.
Pt/AZT material was synthesized by incipient wetness impregnation method. Calcined AZT ternary oxide was dispersed in 50 mL deionized water and a solution
12
of Pt (NH3)2(NO2)2 (Aldrich, diamminedinitritoplatinum (II), 3.4 wt. % solution in
dilute NH3 (aq)) was added to the solution. This material was stirred at 340 K for 8
h and followed by calcination at 973 K for 150 min to remove the organic functionalities in the precursors. The nominal Pt loading in the final material by weight was calculated to be 1 wt. %. For the synthesis of 3 g of the Pt/AZT catalyst, 1.43 mL of platinum precursor was utilized.
2.1.2 Synthesis of Pt/ K
2O/ Al
2O
3/ZrO
2/TiO
2Samples
The K2O-based catalysts were prepared by incipient wetness impregnation
method. Calcined AZT support material and potassium nitrate precursor (KNO3•6H2O, >99.0%, Fluka, France) were mixed in 50 mL deionized water. This
mixture was stirred at 340 K for 8 h. Then, material was calcined at 973 K for 150 min. For the synthesis of the 3 g of the catalyst with different K2O loadings, 0.174
g, 0.347 g or 0.644 g potassium precursor were used to obtain K2O loadings of
2.7, 5.4, 10 wt. %, respectively. Finally, these catalysts were functionalized with the platinum precursor to have a nominal Pt loading of 1 wt. %. In the last step of the preparation, platinum loaded catalysts were calcined at 973 K for 150 min. Throughout the current text, K2O-loaded (2.7, 5.4 and 10 wt. % K2O) samples are
13
2.1.3 Synthesis of Pt/BaO/Al
2O
3/ZrO
2/TiO
2Samples
Similar to the K2O-based materials, BaO based catalysts were also prepared
by employing the incipient wetness impregnation method. Pt/BaO/Al2O3/ZrO2/TiO2 catalysts with 8 and 20 wt. % BaO loadings were
prepared via impregnating the calcined AZT support material with an aqueous solution of barium nitrate (Ba(NO3)2, ACS Reagent, ≥99%, Riedel-de Häen,
Germany). For the synthesis of the Pt/8Ba/AZT and Pt/20Ba/AZT samples, initially 0.44 g and 1.28 g Ba(NO3)2 were dissolved in the deionized water and stirred for 10
min followed by the addition of AZT. Next, the solution was stirred at 340 K for 8 h. This step was followed by calcination at 873 K in air for 150 min. After calcination, mixed oxides were functionalized with 1 wt. % Pt as in the case of K2O
based materials. It should be noted that the molar amount of 2.7 and 5.4 wt. % K2O
were comparable to that of 8 and 20 wt. % BaO in AZT supported materials. In other words, the molar loading of the basic oxide used in the single storage domain materials (i.e. either BaO or K2O) were rather similar.
2.1.4 Synthesis of Pt/K
2O-BaO /Al
2O
3/ZrO
2/TiO
2Samples
For the synthesis of Pt/K2O-BaO /Al2O3/ZrO2/TiO2, Ba(NO3)2 and KNO3 were
co-impregnated on AZT using an analogous synthesis method as described above. Pt/2.7K2O-8BaO/AZT and Pt/5.4K2O-8BaO/AZT, as well as Pt/2.7K2
O-20BaO/AZT and Pt/5.4K2O-20BaO/AZT samples were prepared by wetness
impregnation of calcined Al2O3/ZrO2/TiO2 support with the corresponding aqueous
14
Germany) and potassium nitrate precursors (KNO3•6H2O, >99.0%, Fluka, France).
For the synthesis of 3 g of Pt/2.7 K2O-8BaO/AZT and Pt/5.4K2O- 8BaO/AZT,
0.174 g and 0.347 g of KNO3 and 0.44 g Ba(NO3)2 precursors were used,
respectively. Then, 50 mL of deionized water was added and stirred for 8 h at 340 K. This step was followed by calcination at 873 K in air for 150 min to remove nitrate/nitrite content by thermal decomposition. The same procedure was applied for the synthesis of the Pt/K2O-20BaO/AZT catalysts. For the synthesis of 3 g of
Pt/2.7 K2O-20BaO/AZT and Pt/5.4K2O-20BaO/AZT, 0.174 g and 0.347 g of KNO3
and 1.28 g Ba(NO3)2 precursors were used, respectively. Next, these materials were
impregnated with the proper amount of the Pt precursor in order to obtain a Pt loading of 1 wt. %. Finally, obtained samples were calcined in air at 973 K for structural stabilization. In the current text, Pt/2.7K2O-8BaO/Al2O3/ZrO2/TiO2,
Pt/5.4K2O-8BaO/Al2O3/ZrO2/TiO2, Pt/2.7K2O-20BaO/Al2O3/ZrO2/TiO2 and
Pt/5.4K2O-20BaO/Al2O3/ZrO2/TiO2 samples will be abbreviated as
Pt/2.7K-8Ba/AZT, Pt/5.4K-Pt/2.7K-8Ba/AZT, Pt/2.7K-20Ba/AZT and Pt/5.4K-20Ba/AZT; respectively.
2.2 Instrumentation
2.2.1 XRD and Specific Surface Area Analysis
Powder X-Ray Diffraction (XRD) analysis was performed using a Rigaku Miniflex diffractometer, equipped with a Miniflex goniometer and an X-Ray source with Cu Kα radiation, at λ = 1.5418 Å, 30 kV and 15 mA. The powder sample was pressed onto a standard glass holder and scanned between 10-80o 2θ values with a
15
scan rate of 2 deg. min−1. Assignment of the diffraction patterns were performed by using Joint Committee on Powder Diffraction Standards (JCPDS) cards.
Specific Surface Area (SSA) of the synthesized materials were measured by low temperature isothermal adsorption/desorption of N2 via the five point Brunauer,
Emmett, and Teller (BET) method. Before the measurement, the samples were dehydrated at 573 K for 2 h in vacuum. SSA analysis was performed by utilizing a Micromeritics ASAP2000 gas sorption and porosimetry system.
2.2.2 In-situ FTIR Spectroscopy and Temperature Programmed
Desorption Analysis
In-situ Fourier Transform Infrared (FTIR) spectroscopic measurements were carried out in transmission mode in the batch type catalytic reactor [54] combined with an FTIR spectrometer (Bruker Tensor 27) and quadruple mass spectrometer (QMS, Stanford Research System, RGA200). Typically, 18-22 mg of powder samples were pressed onto a high conductance and lithographically-etched tungsten grid (Tech Etch, P/N PW10379- 003). A tantalum foil was also spot welded onto the W-grid to accommodate a K-type thermocouple (chromel and alumel having thickness of 0.015”, Omega Engineering, Inc. ) for temperature measurements. W-grid was connected to the copper legs together with an electrical vacuum feedthrough. Samples placed into the batch-mode reactor were initially baked out at 403 K for 12 h to remove water from the catalyst and the reactor walls. All FTIR spectra were acquired at 323 K by using a MCT (Hg-Cd-Te) MIR detector that was cooled with liquid nitrogen (LN2) cooling. MKS Baratron Pressure Transducer
16
Type 626 gauge and wide range pressure gauge (EDVAC WRG-S-NW35) comprised of Piranyi and cold-cathode gauges were used to control gas pressures. Rotary and turbo pumps were used for removing the gases from the gas manifold and reactor system.
The QMS was used for the temperature programmed desorption (TPD) and Residual Gas Analysis (RGA) experiments. During the TPD experiments, sample was heated within the range of 323-1023 K with a linear temperature ramp rate of 12 K/min. The temperature ramp was controlled by using a computer controlled PID electronics (Gefran 600-DRRR) and an adjustable DC power supply.
Prior to the experiments, the sample surface was activated by flushing the reactor with 0.5 Torr NO2 for 5 min followed by evacuation and annealing to 973K.
Figure 4: Schematic diagram of in situ FTIR and TPD analysis system [47].
TC: Temperature controller DC: Direct current supplier IG: Ion gauge
QMS: Mass-Spectrometer WRG: Wide-range pressure gauge CM: Capacitance based monometer RP: Rotary pump
TP: Turbo pump GB: Gas bulb GT: Gas tank
17
2.3 Experimental Procedures
2.3.1 NO
xAdsorption via in-situ FTIR
To investigate NOx adsorption properties of the synthesized catalysts, stepwise
NO2 (g) dosing experiments were performed by incrementally increasing the
adsorbate exposure. NO2 (g) was prepared by mixing NO (g) (Air Products, 99.9%)
and excess O2 (g) (Linde GmbH, Germany, 99.999%) followed by multiple
freeze-pump-thaw cycles for purification. First, 0.5 Torr of NO2 (g) were dosed into the
manifold and released onto the sample for 1 min. Upon the expansion of the gas into the reactor, 0.05 Torr NO2 (g) pressure were obtained over the sample. Before
acquiring the FTIR spectrum, NO2 (g) was pumped from the system until the
pressure reached ca. 10-3 Torr. This procedure was repeated 10 times for each
sample by using an initial NO2 (g) pressure of 1 Torr in the manifold. As the final
saturation step, 5 Torr NO2 (g) was dosed over the sample for 10 min. All NOx
adsorption experiments were performed at 323 K.
2.3.2 NO
xReduction via in-situ FTIR
NOx reduction experiments were performed by exposing 15 Torr H2 (g) (Linde
GmbH, Germany, >99.9%) onto a NO2-saturated sample surface at 323 K. Next,
the time-dependent FTIR spectra were acquired at various times in the presence of H2 (g) for a duration of 2 h. Then, the sample was heated to various temperatures
up to 573 K in the presence of H2 (g) for the complete reduction of adsorbed NOx.
18
2.3.3 SO
xAdsorption via in-situ FTIR
Sulfation experiments were performed by exposing the surfaces to a 2 Torr SOx mixture for 5 min at 323 K. SO2:O2 (SO2 purity >99%,Air Products,O2 purity
>99.999%, Linde GmbH)partial pressure ratio of the SOx mixture was 1:10. After
introduction of the SOx mixture, the sample was heated to different temperatures
within 323 – 673 K for 5 min. After each annealing step, the sample was cooled down to 323 K to record an FTIR spectrum. Each step was performed in the presence of the SOx gas mixture. After the completion of the SOx adsorption
experiments, SOx gas was evacuated from the system.
2.3.4 SO
xReduction via in-situ FTIR
Prior to SOx reduction experiments, the sample was sulfated as mentioned in
the previous section. Subsequently, the sulfated catalyst was exposed to 15 Torr H2
(g) (Linde GmbH, Germany, >99.9%) at 323 K for 5 min followed by heating under hydrogen atmosphere at 473,673, 773,873 and 973 K for 5 min. FTIR spectra were acquired after each annealing step in the presence of H2 (g) at 323 K.
2.3.5 NO
xDesorption via TPD
For NOx TPD experiments, the catalyst sample was initially exposed to 5 Torr
NO2 (g) at 323 K for 10 min followed by evacuation at <10-3 Torr. Then the sample
was heated under vacuum with a constant rate of 12 K/min to 973 K. FTIR spectra were also acquired before and after TPD experiments. The desorbed NOx species
19
during the TPD analysis were monitored by recording the QMS signals at m/z = 18, 28, 30, 32, 44, 46 corresponding to H2O, N2/CO, NO, O2, N2O/CO2, NO2 species,
respectively.
2.3.6 SO
xDesorption via TPD
In SOx TPD analysis, each sample was initially saturated with a 2 Torr SOx
mixture at 673 K for 30 min. Then the system was evacuated to a pressure lower than 10-3 Torr. After evacuation, the sample was heated in vacuum to 1173 K with a linear heating rate of 12 K/min. Thermally desorbed SOx species were monitored
20
Chapter 3
Results and Discussion
3.1 Structural Characterization of the Materials
3.1.1 XRD Analysis
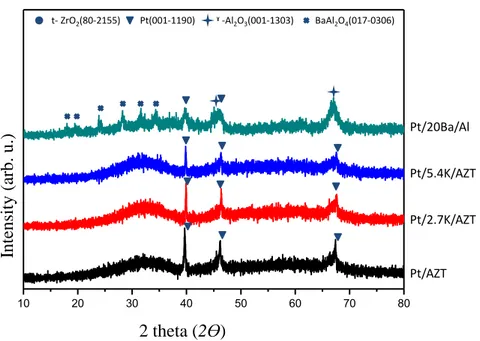
XRD patterns of the Pt/AZT, Pt/8Ba/AZT, Pt/20Ba/AZT as well as the conventional benchmark Pt/20Ba/Al catalyst are given in a comparative fashion in Figure 5. As shown in Figure 5, the Pt/AZT material exhibits a highly amorphous structure with broad diffraction features, revealing sharp platinum diffraction signals (JCPDS 001-1190). Incorporation of baria on the Pt/AZT system does not alter the disordered nature of this surface. Furthermore, addition of baria to the Pt/AZT sample hinders the precious metal agglomeration and facilitates platinum particle dispersion.
In the XRD pattern of the Pt/20Ba/Al benchmark catalyst, there are two more crystalline phases, which can be assigned to γ-Al2O3 (JCPDS 001-1303) and
undesired BaAl2O4 (JCPDS 017-0306). On the surface of the benchmark catalyst,
BaO reacts with Al2O3 to form a BaAl2O4 structure resulting in the loss of the NOx
storage sites. Lack of the BaAl2O4 domains in the AZT-based catalysts could be a
positive attribute suggesting that the NOx storage sites can remain intact without
21
Figure 5 : XRD patterns of the Pt/AZT, Pt/8Ba/AZT, Pt/20Ba/AZT and Pt/20Ba/Al (benchmark) catalysts calcined at 973 K.
Figure 6 illustrates the XRD patterns of Pt/AZT, Pt/2.7K/AZT, Pt/5.4K/AZT and Pt/20Ba/Al recorded after calcination at 973 K. Incorporation of 2.7K/AZT and 5.4K/AZT does not reveal any additional phases except a small increase in the intensities of the Pt diffraction features suggesting that K2O domains
are rather disordered and small in particle size.
10 20 30 40 50 60 70 80 Pt/AZT Pt/8Ba/AZT Pt/20Ba/AZT Pt/20Ba/Al Intensit y (a rb. u.) ˠ -Al2O3(001-1303) t- ZrO2(80-2155) Pt(001-1190) BaAl2O4(017-0306) 2 theta (2ϴ)
22
Figure 6 : XRD patterns of the Pt/AZT, Pt/2.7K/AZT, Pt/5.4K/AZT and Pt/20Ba/Al (benchmark) catalysts calcined at 973 K.
For further analysis, the XRD patterns of multi-storage domain materials in the form of Pt/2.7K-8Ba/AZT, Pt/2.7K-20Ba/AZT, 8Ba/AZT and Pt/5.4K-20Ba/AZT were investigated (Figure 7). Figure 7 clearly indicates that the intensity of the metallic Pt diffraction features decrease and become broader as compared to the single storage domain materials (Figures 5 and 6). This observation suggests that Pt dispersion could be enhanced in the case of multi-storage domain AZT materials. Furthermore, other minority diffraction signals such as t-ZrO2 (JCPDS
80-2155) and γ-Al2O3 (JCPDS 001-1303) are also visible in Figure 7.
10 20 30 40 50 60 70 80 Pt/AZT Pt/20Ba/Al Pt/2.7K/AZT Pt/5.4K/AZT ˠ -Al2O3(001-1303) t- ZrO2(80-2155) Pt(001-1190) BaAl2O4(017-0306) Intensit y (a rb. u.) 2 theta (2ϴ)
23
Figure 7 : XRD patterns of the Pt/2.7K-8BaAZT, Pt/2.7K-20Ba/AZT, Pt/5.4K-8Ba/AZT and Pt/5.4K-20Ba/AZT catalysts calcined at 973 K.
3.1.2 BET Analysis
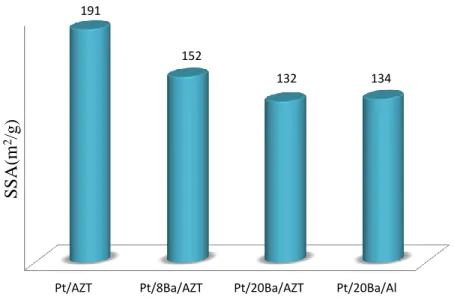
Figure 8 represents SSA values of Pt/AZT, Pt/8Ba/AZT, Pt/20Ba/AZT and Pt/20Ba/Al materials. As compared to the benchmark catalysts, Pt/AZT reveals a slightly higher SSA value. Addition of BaO to the Pt/AZT system decreases the SSA monotonically with increasing BaO loading. It should be noted that Pt/20Ba/AZT and Pt/20Ba/Al materials have comparable SSA.
10 20 30 40 50 60 70 80 t- ZrO2(80-2155) Pt/2.7K-8Ba/AZT Pt/2.7K-20Ba/AZT Pt/5.4K-8Ba/AZT Pt/5.4K-20Ba/AZT Pt(001-1190) Al2O3(001-1303)
Intensit
y
(a
rb.
u.)
2 theta (2ϴ)
24
Figure 8 : BET specific surface area values for the Pt/AZT, Pt/8Ba/AZT, Pt/20Ba/AZT catalysts and Pt/20Ba/Al benchmark catalyst after calcination at 973 K.
In Figure 9, SSA values of Pt/AZT, Pt/2.7K/AZT, Pt/5.4K/AZT and Pt/20Ba/Al are presented. It is apparent in Figure 9 that increasing K2O loading
decreases the SSA values of the material where for loadings ≥5.4 wt. % K2O, SSA
values tend to converge that of the Pt/20Ba/Al benchmark catalyst.
Pt/AZT Pt/8Ba/AZT Pt/20Ba/AZT Pt/20Ba/Al
191 152 132 134 S S A( m 2/g )
25
Figure 9 : BET specific surface area values for the Pt/AZT, Pt/2.7K/AZT, Pt/5.4K/AZT catalysts and Pt/20Ba/Al benchmark catalyst after calcination at 973 K.
After having investigated the SSA of single storage domain materials, similar analysis were also performed on multi-storage domain systems. Figure 10 demonstrates the SSA data for Pt/2.7K-8Ba/AZT, Pt/2.7K-20Ba/AZT, Pt/5.4K-8Ba/AZT and Pt/5.4K-20Ba/AZT. In accordance with the aforementioned observations for the single storage domain materials, increasing the loading of the basic oxides (i.e. BaO or K2O)in the multi-storage domain materials also leads to
an attenuation in the SSA. While this corresponding decline in SSA is relatively less sensitive to the variations in K2O loading, it is significantly more prone to
alterations in BaO loading (Figure 10).
Pt/AZT Pt/2.7K/AZT Pt/5.4K/AZT Pt/20Ba/Al
191 177 155 134 S S A( m 2 /g )
26
3.2 In situ FTIR Analysis
3.2.1 NO
xAdsorption Analysis
3.2.1.1 NO
xAdsorption Analysis of Single Storage Domain
Materials
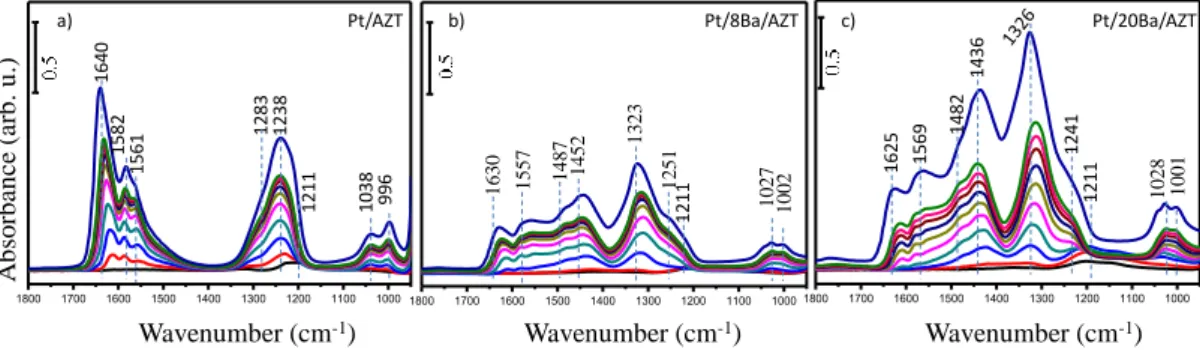
FTIR spectra obtained after NO2 (g) adsorption (successive 0.5 Torr NO2 (g)
exposure steps with a final saturation exposure of 5 Torr for 10 min) on Pt/AZT sample and its BaO functionalized counterparts at 323 K are illustrated in Figure 11. Five vibrational features were detected, which are located at 1238, 1283, 1561, 1582 and 1640 cm-1 as shown in Figure 11. While vibrational frequencies at 1238
S
S
A(
m
2/g
)
160 133 90 59Figure 10 : BET specific surface area values for the K2O –BaO co-impregnated Pt/2.7K-8Ba/AZT,
27
and 1640 cm-1 were assigned to bridging nitrates, features located at 1283 ,1582 and 1561 cm-1 can be attributed to bidentate nitrates [35, 55]. On the other hand, FTIR spectra of BaO and platinum incorporated AZT samples shown in Figure 11b-c have a different spectral line shape as compared to the Pt/AZT support. In addition to the surface nitrate and nitrite species, bulk/ ionic like nitrate features coordinated to BaO domains are present with characteristic IR frequencies at 1323, 1452 and 1487 cm-1[35, 56]. It is also clear that abundance of bulk like nitrate species are relatively more pronounced at higher BaO loadings.
Figure 11 : In-situ FTIR spectra of stepwise NO2 (g) adsorption on activated a)
Pt/AZT, b) Pt/8Ba/AZT and c) Pt/20Ba/AZT at 323 K. The topmost spectrum belongs to the saturated surfaces.
In addition to BaO functionalized materials, we further investigated the effect of K2O loading on the nature of the nitrate coordination chemistry. Thus,
stepwise NO2 (g) adsorption on Pt/AZT, Pt/2.7K/AZT and Pt/5.4K/AZT were
monitored as a function of pressure at 323 K as illustrated in Figures 12a-12c, respectively. It should be noted that the molar amount of 2.7 and 5.4 wt. % K2O
were comparable to that of 8 and 20 wt. % BaO in AZT supported materials [57].
1283 1800 1700 1600 1500 1400 1300 1200 1100 10001800 1700 1600 1500 1400 1300 1200 1100 10001800 1700 1600 1500 1400 1300 1200 1100 1000 A b so rb an ce ( ar b . u .)
Wavenumber (cm-1) Wavenumber (cm-1) Wavenumber (cm-1)
Pt/8Ba/AZT 1630 1557 1452 1323 1251 1027 1002 1487 Pt/20Ba/AZT Pt/AZT 1640 996 1038 1561 1582 1238 1625 1569 1482 1436 1241 1211 1028 1001 1211 1211 a) b) c)
28
IR signals located at 1306 and 1513 cm-1 in Figure 12 can be attributed to monodentate nitrates, while the features at 1607 and 1579 cm-1 can be assigned to bridging and bidentate nitrates, respectively. In addition to surface nitrates, other features located at 1367 and 1393 cm-1 can be assigned to ionic/bulk like potassium nitrates [58, 59]. However, the position of surface and bulk nitrate features are different as compared to that of BaO functionalized counterparts as observed in Figure 11. These complementary results clearly point out to the fact that nitrate coordination is rather sensitive to the metal coordination center.
Figure 12 : In-situ FTIR spectra of stepwise NO2 (g) adsorption on activated a)
Pt/AZT, b) Pt/2.7K/AZT and c) Pt/5.4K/AZT at 323 K. The topmost spectrum belongs to saturated surface.
3.2.1.2 NO
xAdsorption Analysis of Multi Storage Domain
Materials
BaO is the most commonly utilized storage component used in NSR technology [22, 35, 60]. However, its storage ability is well known to be limited at elevated temperatures. Accordingly K2O has been considered as an alternative
storage component and promoter in NSR materials that can boost and widen the
1800 1700 1600 1500 1400 1300 1200 1100 1000 1283 1800 1700 1600 1500 1400 1300 1200 1100 10001800 1700 1600 1500 1400 1300 1200 1100 1000 Wavenumber (cm-1) Wavenumber (cm-1) Pt/2.7K/AZT Pt/5.4K/AZT 1012 1042 1367 1393 1513 1579 1607 1211 1012 1042 1211 1367 1392 1510 1570 1608 A b so rb an ce ( ar b . u .) Wavenumber (cm-1) Pt/AZT 1640 996 1038 1561 1582 1238 1211 a) b) c)
29
operational temperature window towards higher temperatures [39, 61]. In this section, changes in the NOx adsorption properties upon simultaneous incorporation
of BaO and K2O on the Pt/AZT system was investigated.
In Figure 13a and 13b, Pt/AZT and Pt/8Ba/AZT samples were used once again as benchmark catalyst in order to be able to compare them with K2O including
counterparts given in Figures 13c and 13d corresponding to Pt/2.7K-8Ba/AZT and Pt/5.4K-8Ba/AZT; respectively. In Figure 13c, there exist six main vibrational features located at 1311, 1352, 1410, 1510, 1580 and 1610 cm-1 on
Pt/2.7K-8Ba/AZT. Among these stretchings, 1311 and 1510 cm-1 can be assigned to monodentate nitrates. 1610 and 1580 cm-1 features are associated with the bridging and bidentate nitrates, respectively. Another set of features at 1352 and 1410 cm-1 correspond to bulk like potassium nitrate on BaO domains [59]. In Figures 13c and 13d, although types of surface nitrates and bulk nitrates are rather similar to that of Figures 13a and 13b; their relative intensities change as a function of K2O loading.
As the K2O loading increases from 2.7 to 5.4 w.t. %, relative IR intensities of bulk
like nitrate species (i.e. 1393 and 1365 cm -1) on K2O domains significantly
increase. This result points to the fact that K2O domains are more exposed on the
surface of Pt/5.4K-8Ba/AZT while these features are relatively suppressed by BaO domains on the Pt/2.7K-8Ba/AZT catalyst. This observation emphasizes the fact that the surface chemistry of such catalytic systems can be fine-tuned by tailoring surface composition.
30
Figure 13 : In-situ FTIR spectra of stepwise NO2 (g) adsorption on activated a)
Pt/AZT, b) Pt/8Ba/AZT, c) Pt/2.7K-8Ba/AZT and d) Pt/5.4K-8Ba/AZT at 323 K. The topmost spectrum belongs to saturated surface.
An analogous set of experiments were performed by utilizing 20 wt. % BaO loaded AZT samples co-loaded with different K2O amounts. In Figure 14, such
measurements corresponding to Pt/AZT, Pt/20Ba/AZT, Pt/2.7K-20Ba/AZT and Pt/5.4K-20Ba/AZT are presented. As discussed for the Figure 11, excess BaO loaded sample leads to an increase in the formation of bulk nitrate (1329,1436 and 1482 cm-1). This trend is also observed in the co-loaded case of K2O and BaO,
where increase in the bulk potassium nitrate suppresses the formation of surface nitrate features [51, 62]. In Figure 14d, there were seven major vibrational features located at 1241, 1312, 1361, 1397, 1510, 1560 and 1610 cm-1. Among these features, 1241 and 1560 cm-1 correspond to bridging nitrates and 1312-1510 cm-1 can be assigned to monodentate nitrates. The other surface nitrate on
Pt/5.4K-1800 1700 1600 1500 1400 1300 1200 1100 1000 1800 1700 1600 1500 1400 1300 1200 1100 1000 1800 1700 1600 1500 1400 1300 1200 1100 1000 Pt/2.7K-8Ba/AZT 1410 1580 1610 1510 1352 1211 1039 1010 Pt/5.4K-8Ba/AZT 1365 1393 1565 1610 1244 1510 1211 1039 1021 Wavenumber (cm-1) A b so rb an ce ( ar b . u .) Pt/8Ba/AZT 1630 1557 1452 1323 1251 1027 1002 1487 1211 Wavenumber (cm-1) 1283 1800 1700 1600 1500 1400 1300 1200 1100 1000 A b so rb an ce ( ar b . u .) Pt/AZT 1640 996 1038 1561 1582 1238 1211 a) b) c) d)
31
20Ba/AZT sample is assigned as a bidentate nitrate that is located at 1610 cm-1 [51, 62]. Bulk potassium nitrates are located at 1361 and 1397 cm-1[40, 58, 63].
Figure 14 : In-situ FTIR spectra of stepwise NO2 (g) adsorption on activated a)
Pt/AZT, b) Pt/20Ba/AZT, c) Pt/2.7K-20Ba/AZT and d) Pt/5.4K-20Ba/AZT at 323 K. The topmost spectrum belongs to saturated surface.
3.2.2 NO
xReduction Analysis
As well as NOx adsorption analysis, NOx reduction over all of the synthesized
samples were also performed by using H2 (g) as the reducing agent to investigate
the stability of the surface and bulk nitrate species. First part of such experiments illustrate the initial nitrate reduction of the samples as a function of time. For this purpose, NOx saturated surface were treated with 15 Torr H2 (g) at 323K for 40 min
(Figure 15, top section). The second part of these experiments are represented in
1800 1700 1600 1500 1400 1300 1200 1100 1000 1800 1700 1600 1500 1400 1300 1200 1100 1000 1800 1700 1600 1500 1400 1300 1200 1100 1000 1 2 3 4 5 6 7 8 9 10 satu 1241 1800 1700 1600 1500 1400 1300 1200 1100 1000 Pt/2.7K-20Ba/AZT Pt/5.4K-20Ba/AZT Wavenumber (cm-1) A b so rb an ce ( ar b . u .) 1625 1569 1482 1436 1241 1211 1028 1001 Pt/20Ba/AZT Wavenumber (cm-1) 1610 1211 1580 1510 1410 1355 1610 1560 1510 1397 1361 1312 1211 1283 A b so rb an ce ( ar b . u .) Pt/AZT 1640 996 1038 1561 1582 1238 1211 a) b) c) d)
32
the middle section of Figure 15 and corresponds to the reduction of the species within the second time interval (60-120 min). The third part is shown in the bottommost section of Figure 15 and is associated with the reduction of the NOx
-saturated surfaces at 373, 473 and 573 K.
3.2.2.1 NO
xReduction Analysis of Single Storage Domain
Materials
Figure 15 : In-situ FTIR spectra of NO2 (g) reduction via H2(g) on a) Pt/AZT, b)
Pt/8Ba/AZT and c) Pt/20Ba/AZT.
In Figure 15a, the set of spectra collected in the first 40 min reveals bridging nitrate features (1643 and 1232 cm-1) on Pt/AZT whose IR intensities decrease after H2 (g) exposure. This decrease was followed by the formation of monodentate
(1299 cm-1) nitrates on the surface. A direct transformation of bridging to monodentate nitrate can be explained by the presence of an isosbestic point at ca. 1299 cm-1 in Figure 15a. NO significant spectral changes were observed within the
time interval between 60-120 min of H2 (g) exposure. In the bottommost part of
Figure 15a, which is related to the temperature-dependent reduction, surface and bulk nitrates were removed completely at 473 K suggesting full NOx regeneration
1299 1800 1700 1600 1500 1400 1300 1200 1100 1000 1800 1700 1600 1500 1400 1300 1200 1100 1000 A b so rb an ce ( ar b . u .) Wavenumber (cm-1) 1800 1700 1600 1500 1400 1300 1200 1100 1000 Pt/8Ba/AZT Pt/20Ba/AZT Pt/AZT Wavenumber (cm-1) Wavenumber (cm-1) (0-40mins) (60-120 mins) ( 373-573 K) (0-40mins) (60-120 mins) ( 373-573 K) (0-40mins) (60-120 mins) ( 373-573 K) 1643 1561 1582 1232 1630 1557 1452 1251 1322 1630 1557 1251 a) b) c)
33
at 473 K in the presence of H2 (g). A simplified reduction mechanism of
nitrate/nitrite functional groups is given in Figure 16.
Figure 16 : Schematic representation of nitrate reduction mechanism. (Copyright © 2014 Elsevier. Reproduced with permission from ref [68]).
In Figure 15b and 15c, the reduction of nitrate/nitrite functional groups on Pt/8Ba/AZT and Pt/20Ba/AZT are illustrated. At the end of the time dependent reduction process (i.e. after 120 min of H2 exposure), surface nitrates were
relatively decreased, but intensity of the bulk nitrates did not significantly change. On the other hand, during the reduction at elevated temperatures within 373-573 K, intensities of nitrate and nitrite species on Ba loaded samples were gradually decreased. After annealing at 573 K, while Pt/8Ba/AZT sample could be fully regenerated, Pt/20Ba/AZT sample was not completely regenerated. This behavior can be explained by the existence of a large coverage of stable bulk nitrates on the surface of the Pt/20Ba/AZT catalyst which are more resilient towards reduction, as compared to the surface nitrate species that are predominantly present on the Pt/8Ba/AZT surface. O N O O O
H
2(g)
O N O OH
O O N O OH
ONH
xN
2O
(g)+ N
2(g)34
Figure 17 : In-situ FTIR spectra of NO2 (g) reduction via H2 (g) on a) Pt/AZT, b)
Pt/2.7K/AZT and c) Pt/5.4K/AZT.
An identical set of experiments were also performed for the K2O and Pt
incorporated samples. In Figure 17, the reduction behaviors of Pt/AZT, Pt/2.7K/AZT and Pt/5.4K/AZT are shown. In Figure 17b, the absorbance intensity of the surface nitrates slightly decreases in the presence of 15 Torr H2 (g) in the first
40 min of the reduction process at 323 K. After this initial period, further reduction of surface and bulk nitrate features were not observed. During the temperature-dependent reduction experiments, regeneration of the Pt/2.7K/AZT was fully accomplished at 573 K; however, Pt/5.4K/AZT sample could not be completely regenerated at 573 K due to the presence of an extensive amount of bulk nitrates on the latter surface.
3.2.2.2 NO
xReduction Analysis of Multi Storage Domain
Materials
Similar NOx reduction experiments were also performed over multi storage
domain containing AZT-based catalysts. Figure 18 shows the corresponding in-situ FTIR spectra for the Pt/AZT, Pt/8Ba/AZT, Pt/2.7K-8Ba/AZT and
Pt/5.4K-1299 1800 1700 1600 1500 1400 1300 1200 1100 1000 1800 1700 1600 1500 1400 1300 1200 1100 1000 A b so rb an ce ( ar b . u .) Wavenumber (cm-1) Pt/AZT Pt/2.7K/AZT Wavenumber (cm-1) 1800 1700 1600 1500 1400 1300 1200 1100 1000 Pt/5.4K/AZT Wavenumber (cm-1) (0-40mins) (60-120 mins) ( 373-573 K) (0-40mins) (60-120 mins) ( 373-573 K) (0-40mins) (60-120 mins) ( 373-573 K) 1643 1561 1582 1232 1608 1513 1394 1367 1507 1579 1579 a) b) c)
35
8Ba/AZT samples, where the first two samples are shown for comparison. H2 (g)
exposure on the Pt/2.7K-8Ba/AZT and Pt/5.4K-8Ba/AZT sample surfaces at 323 K in the first 40 min (Figure 18c and 18d), leads to the partial removal of monodentate (1311, 1510 cm-1), bridging (1580 cm-1) and bidentate nitrates (1610 cm-1). In the second time interval (i.e. within 60-120 min of H2 (g) exposure), bulk potassium
nitrates (1352 and 1410 cm-1) start to attenuate in a minor fashion. Figures 18c and 18d indicate that at elevated temperature reduction, the surface nitrate functional groups are decomposed first, followed by the reduction of the bulk nitrates. Furthermore, the monodentate surface nitrates were found to be more stable than the other surface nitrate species. Experimental findings, given in Figures 15, 17 and 18 can be analyzed comparatively in order to understand the relative NOx reduction
capabilities of single storage domain AZT catalysts (i.e. Pt/8Ba/AZT and Pt/2.7 or 5.4 K/AZT; respectively) and their multi-storage domain counterparts at low BaO coverages (i.e. Pt/2.7K-8Ba/AZT and Pt/5.4K-8Ba/AZT). It can be seen that NOx
reduction capabilities of Pt/8Ba/AZT (Figure 15b) and Pt/2.7K/AZT (Figure 17b) are rather comparable, where both of these catalysts can be fully regenerated at 573 K. In contrast, increasing the K2O loading to 5.4 wt.% leads to the formation of a
large amount of bulk KNO3 species (see Figure 17c for Pt/5.4K/AZT) where a
relatively larger portion of bulk nitrates stay intact even after reduction at 573 K. On the other hand, comparison of the reduction data given in Figures 17c, 18b and 18 d for Pt/5.4K/AZT, Pt/8Ba/AZT and Pt/5.4K-8Ba/AZT; respectively suggest that, by utilizing multi-storage domains, one can fine-tune the stability of the bulk nitrates generated on the catalyst surface under reducing conditions at 573 K, where Pt/5.4K-8Ba/AZT (Figure 18d) reveals bulk nitrates which are more resilient
36
towards reduction than that of Pt/8Ba/AZT (Figure 18b) but are easier to be reduced than that of Pt/5.4K/AZT (Figure 17c) [12, 64-66].
Figure 18 : In-situ FTIR spectra of NO2 (g) reduction via H2 (g) on saturated a)
Pt/AZT, b) Pt/8Ba/AZT, c) Pt/2.7K-8Ba/AZT and d) Pt/5.4.K-8Ba/AZT.
Figure 19 demonstrates the changes in the surface functional groups on Pt/AZT, Pt/20Ba/AZT, Pt/2.7K-20Ba/AZT and Pt/5.4K-20Ba/AZT samples containing a higher loading of BaO during the NOx reduction process performed
under identical experimental conditions, described above. It is clear that increasing the storage domain loading in single storage domain materials increases the stability of the stored nitrates towards reduction (e.g. compare Figures 15b vs 15c for Pt/8Ba/AZT and Pt/20Ba/AZT or Figures 17b and 17c for Pt/2.7K/AZT and Pt/5.4K/AZT, respectively). On the other hand, comparing this result with that of Figure 19d for the Pt/5.4K-20Ba/AZT sample reveals that even in the co-presence
1322 A b so rb an ce ( ar b . u .) 1800 1700 1600 1500 1400 1300 1200 1100 1000 Pt/8Ba/AZT 1800 1700 1600 1500 1400 1300 1200 1100 1000 Pt/2.7K-8Ba/AZT 1800 1700 1600 1500 1400 1300 1200 1100 1000 Pt/5.4K-8Ba/AZT Wavenumber (cm-1) Wavenumber (cm-1) (0-40mins) (60-120 mins) ( 373-573 K) (0-40mins) (60-120 mins) ( 373-573 K) (0-40mins) (60-120 mins) ( 373-573 K) 1630 1557 1452 1251 1410 1352 1510 1580 1610 1610 1580 1510 1299 1800 1700 1600 1500 1400 1300 1200 1100 1000 A b sor b a n c e (a rb . u .) Pt/AZT (0-40mins) (60-120 mins) ( 373-573 K) 1643 1561 1582 1232 a) b) c) d)
37
of high loadings of BaO and K2O, the reduction resistance of the catalyst lies in
between Pt/20Ba/AZT and Pt/5.4K/AZT. This important finding suggest that as in the case of low BaO loadings, stability of the surface nitrates can also be fine-tuned at higher BaO loadings by using K2O as a complementary storage domain. [67, 68]
.
Figure 19 : In-situ FTIR spectra of NO2 (g) reduction via H2 (g) on saturated a)
Pt/AZT, b) Pt/20Ba/AZT, c) Pt/2.7K-20Ba/AZT and d) Pt/5.4.K-20Ba/AZT.
3.2.3 SO
xAdsorption Analysis
In this section, SOx uptake capacity and adsorption characteristics of the single
and multi-storage domain AZT catalysts are investigated as a function of temperature via in-situ FTIR spectroscopy.
1800 1700 1600 1500 1400 1300 1200 1100 1000 1800 1700 1600 1500 1400 1300 1200 1100 1000 saturation 1min 3mins 10mins 20mins 30mins 40mins 60mins 80mins 100mins 120mins 100c 200c 300c A b so rb an ce ( ar b . u .) 1800 1700 1600 1500 1400 1300 1200 1100 1000 Pt/20Ba/AZT 1800 1700 1600 1500 1400 1300 1200 1100 1000 Wavenumber (cm-1) Wavenumber (cm-1) Pt/2.7K-20Ba/AZT Pt/5.4K-20Ba/AZT (0-40mins) (60-120 mins) ( 373-573 K) (0-40mins) (60-120 mins) ( 373-573 K) (0-40mins) (60-120 mins) ( 373-573 K) 1630 1557 1251 1355 1410 1510 1580 1610 1299 A b so rb an ce ( ar b . u .) Pt/AZT (0-40mins) (60-120 mins) ( 373-573 K) 1643 1561 1582 1232 a) b) c) d)


![Figure 4 : Schematic diagram of in situ FTIR and TPD analysis system [47].](https://thumb-eu.123doks.com/thumbv2/9libnet/5667606.113396/35.892.184.752.628.1026/figure-schematic-diagram-situ-ftir-tpd-analysis-system.webp)