\
AUTOMATED DETECTION AND ENHANCEMENT OF MICROCALCIFICATIONS
IN MAMMOGRAMS USING NONLINEAR SUBBAND DECOMPOSITION
M. Nafi Gurcan' Yasemin Yardamcz' A . Enis Getin' Rashid Ansari2 Bilkent University,
Dept. of Electrical and Electronics Engineering, Bilkent, Ankara TR-06533, Turkey
E-mail: gurcanOee.bi1kent.edu.tr 2Univ. of Illinois at Chicago Department of Electrical Engineering
Chicago, Illinois, 60607-7053 ABSTRACT
In this paper, computer-aided detection and enhancement of microcalcifications in mammogram images are consid- ered. The mammogram image is first decomposed into subimages using a 'subband' decomposition filter bank which uses nonlinear filters. A suitably identified subimage is divided into overlapping square regions in which skewness and kurtosis as measures of the asymmetry and impulsive- ness of the distribution are estimated. All regions with high positive skewness and kurtosis are marked as a regions of interest. Next, an outlier labeling method is used to find the locations of microcalcifications in these regions. An en- hanced mammogram image is also obtained by emphasizing the microcalcification locations. Linear and nonlinear sub- band decomposition structures are compared in terms of their effectiveness in finding microcalcificated regions and their computational complexity. Simulation studies based on real mammogram images are presented.
1. INTRODUCTION
In this paper, computer-aided detection of microcalcifica- tions and enhancement of digital mammogram images are considered. The presence of tiny calcium deposits in breast tissues are an early sign of breast cancer in women. Since microcalcifications can be as small as O.lmm x 0.1" in size, they can be easily overlooked by an examining radi- ologist. Therefore, digitally enhanced mammogram images will help the diagnosis process.
Recently a variety of schemes for the computerized detec- tion of microcalcifications, based on the wavelet transform, have been proposed [1]-[3]. In these schemes, the mammo- gram image is first passed through a subband decomposing filter bank. The subband images are weighted to enhance the microcalcification locations, and a new image is recon- structed from the weighted sub-images. In the detection step, global and local gray-level thresholds are applied to the reconstructed image to extract possible microcalcifica- tion locations. These locations are grouped to identify mi- crocalcification clusters. In [1]-[3] the reconstructed image essentially corresponds to a bandpass filtered version of the original mammogram image.
In our method the mammogram image is first decom- posed into subimages using a nonlinear subband decomposi- tion structure and the microcalcification detection is carried out in the 'subband' domain. The nonlinear decomposition
technique was recently proposed to compress images con- taining sharp edges [5]-[8]. The technique is also suitable for analyzing microcalcification locations which have also sharp edges.
Statistical procedures for detection of the microcalcifica- tions are applicable after the decomposition stage. Since microcalcifications are small isolated regions in mammo- grams they produce outliers in the highband signal (the detail-image). The problem is then reduced to that of de- tecting outliers in the detail-image component, obviating the need for signal reconstruction. The detail-image is first divided into overlapping square regions in which skewness and kurtosis as measures of the asymmetry and impulsive- ness of the distribution are estimated. A region with high positive skewness and kurtosis is marked as a region of in- terest. Then, the boxplot outlier detection method [4, 121 is used to find the locations of the microcalcifications in susceptible regions.
The performance of the nonlinear subband decomposition structure is also compared to that of regular filter banks employing linear filters.
2. NONLINEAR IMAGE DECOMPOSITION
In this section, the nonlinear image analysis structure is briefly reviewed, and it is shown that the choice of the nonlinear image decomposition structure, filters and their region of support should be determined according to the characteristics of microcalcifications.
The block diagram of a nonlinear signal decomposition structure is shown in Figure 1 [8]. In this structure H and
G
are nonlinear operators, and they produce the low-band signal, pa, and the detail-signal, Y d from the input signal 2as follows:
y d [ n ] = z2(n) -k ff(xl[n]) (1) Ya[n] = zl(72.I - G ( Y d [ n ] ) (2) where z1(n) = z(2n
-
l ) , 22(n) = 4 2 n ) andand N I , N z , N3, N4 are positive integers and they determine the support region of the nonlinear filters. The original sig- nal 2 can be perfectly reconstructed from the analysis sig- nals ya and yd, and the decomposition structure can be ex- tended to two dimensions using either rectangular or quin- cunx subsampling methods [9].
The dimensions of microcalcifications vary in different mammogram images according to the scanning resolu- tion. In the database we used, the scanning resolution is lOOpm x 100pm hence, the microcalcifications appear as impulses of size varying from 1 pixel x lpixel to 10 pixelx 10 pixel. Since 1 pixelx lpixel microcalcifications can be re- moved by downsampling operation, the structure in Fig- ure 1 cannot be used in mammogram image analysis with lOOpm x lOOpm scanning resolution (It should be noted that the regular subband decomposition structures such as those in [1]- [3] can be used in image analysis, because the linear filters before the downsampling operation smear out the 1 pixelxlpixel impulse and the information about it is available in all of the subsignals). If the scanning resolution is not sufficient then the downsampling operations should be eliminated and the subimages ya and Yd are obtained as
!hid
= c[241 -k G(gd[n]) (4)where the nonlinear filter H is chosen as a median filter with a 21 x 21 support. Such a filter completely elimi- nates impulsive microcalcification regions while retaining the approximate base level. Therefore, the detailsignal Yd contains mainly microcalcifications as shown in Figures 4-7 and the microcalcification locations can be determined us- ing the statistical detection methods described in Section 3. Other nonlinear filters such as erosion and lower-a trimmed mean type filters can also be used for the H filter. The non- linear filter G, on the other hand, can be selected so that ya[A is an enhanced version of the original image
z[d.
This enhancement method will be introduced in Section 4.Nonlinear filters such as median type filters have been previously used in the detection of microcalcifications by Chang e t a l . [ll]. In [ll] the effects of linear and nonlinear filters and their region of support in the detection and en- hancement of microcalcifications are investigated through ROC studies. In Ill] a median filter with a 9 x 9 support is found to be most effective on mammogram images with simulated microcalcifications. However, such a median filter cannot eliminate all of the microcalcifications in the mam- mogram images of Nijmejgen database’ because the sizes of the microcalcifications may exceed the median filter sup- port region. The nonlinear filter support should be deter- mined according to the image scanning rate and the sizes of microcalcifications.
The median filter with a support region containing N samples requires ‘2N comparisons’ t o produce an output sample. On the other hand, a linear phase FIR filter re- quires N/4 multiplications. Furthermore, the microcalcifi- cation detection process can be carried out over quarter or half size images in regular subband decomposition struc- tures. Therefore, the computational cost of a median filter based system is higher than an ordinary subband filterbank.
3. S T A T I S T I C A L D E T E C T I O N M E T H O D Microcalcifications, tiny isolated regions in the mammo- gram image, manifest themselves as outliers in the detail- image. Hence, outlier detection techniques can be used to
‘A set of mammogram images digitized by Nico Karssemeijer of University Hospital Nijmegen, The Netherlands.
F i g u r e 1. Nonlinear Subband Decomposition Struc- ture
detect the microcalcifications [15]. In this paper, detec- tion is carried out in two steps. First, the detail-image is divided into overlapping square regions. In these regions, skewness and kurtosis, measures of the asymmetry and im- pulsiveness of the distribution are estimated. If a region has high positive skewness and kurtosis then it is marked as a region of interest. In the second stage an outlier labeling method [4, 121 is used to find the locations of microcalcifica- tions in these regions. This two step procedure significantly decreases the computational complexity because instead of searching the whole image for outliers only regions with high susceptibility are processed by the outlier labeling method. 3.1.
Skewness and kurtosis are higher order statistical parame- ters [13]. For a random variable x, the skewness is defined
Skewness and Kurtosis Based Tests
(5)
and is a measure of the symmetry of the distribution. An estimate of the skewness is given by:
where T?L and 3 are the estimates of the mean and standard
deviation over N observations xi (i = 1,.
. . ,
N ) .Similarly, for a random variable x the kurtosis is defined as
(7) and is a measure of the heaviness of the tails in a distribu- tion. An estimate of the kurtosis is given by:
where m and 6 are defined as before. For the Gaussian distribution 7 3 and 7 4 are equal to zero.
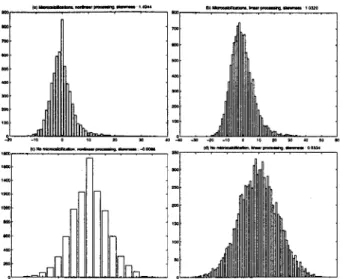
If a region contains microcalcifications then due to the impulsive nature of microcalcifications the symmetry of the distribution of detail-image coefficients is destroyed as shown in Figure 2 (a) and (c). It is also evident that the tails of the distribution are heavier and hence the kurto- sis assumes a high value. Therefore a statistical test based on skewness and kurtosis is effective in finding regions with asymmetrical and heavier tailed distributions. The detec- tion problem is posed as an hypothesis testing problem in which the null hypothesis, H,,, corresponds to the case of no microcalcifications against the alternative H1 :
: Microcalcifications are not present in the region
: Microcalcifications are present in the region.
0 H , 0 H I
Figure 2. S a m p l e value distributions in regions w i t h nonlinear subband decomposition (left column) and w i t h linear subband decomposition (right column) This hypothesis testing problem is reduced to the following decision rule J? based on skewness and kurtosis
100
e
where TI and TZ are experimentally determined thresholds. Once the regions containing microcalcifications are deter- mined by the above test, the locations of the microcalcifica- tions are estimated by the outlier labeling method described in the next subsection.
In [15] a linear subband decomposition filter bank is used instead of the nonlinear subband decomposition structure of Section 2. In Figure 2 (b) and (d) detail-image histograms of two regions obtained with a linear structure are shown. The region containing microcalcifications has high skewness and kurtosis values, too. Basically, the linear and nonlin- ear structures both reveal the same information in terms of their higher order statistical parameters. The computa- tional complexity of the nonlinear subband decomposition structure is high compared to that of the linear structure. 3.2. Boxplot Outlier Labeling Method
In this work, we used the so-called boxplot outlier label- ing method [12]. In this method the data x is first rank ordered, x = { z ( ~ ) , ZQ),
...,
z ( ~ ) } . Next, the median, the lower quartile, Q1 and the upper quartile Q3 values aredetermined [15]. The interquartile range RF is defined to be Q3 - Q1. The boxplot method determines the out- liers to be the part of data which is outside the region
(91
- kRF,Q3+
~ R F ) . The parameter IC is usually taken to be 1.5 or 3.0. Figure 3 illustrates the boxplot outlierlabeling method.
4. M A M M O G R A M I M A G E E N H A N C E M E N T It is desired that the microcalcifications be readily notice- able in an enhanced version of the original mammogram im- age. Expression (4) shows that the image ya[14J is obtained
- 2 0 0 - 3 '
'&
' ' ' --
Q i k R F Q, MEDIAN Q , Q;kRF
*
: OUTLIERSFigure 3. Boxplot outlier labeling m e t h o d defini- tions .
--
ZIOO 20 40 60 80 100 120 140 50 . . -101 I 20 40 60 80 100 120 140h
"0 20 40 60 80 100 120 140Figure 4. ( a ) A horizontal line of the m a m m o g r a m image, (b) detail-image yd, (c) microcalcifications are enhanced (d) output of the outlier detection method.
by superimposing the original with a nonlinear filtered ver- sion of the detail-image G(yd[g]). The image y a [ ~ ] can be considered as an enhanced image for an appropriate selec- tion of the nonlinear function G. A natural choice for G would be based on the outlier detection scheme. In this ap- proach, the microcalcification regions in yd[z] are detected and reinforced. Another approach is predicated on amplify- ing the pixel values of the original at the microcalcification locations.
Figure 4 illustrates the steps of outlier detection and im- age enhancement stages on a horizontal line of a mammo- gram image. In particular, Figure 4 (a) depicts the origi- nal line which is known to contain two microcalcifications. The difference between the original signal and its median filtered version is shown in Figure 4 (b). This difference plot corresponds to the detail-signal, Yd of the nonlinear decomposition structure. The microcalcifications are en-
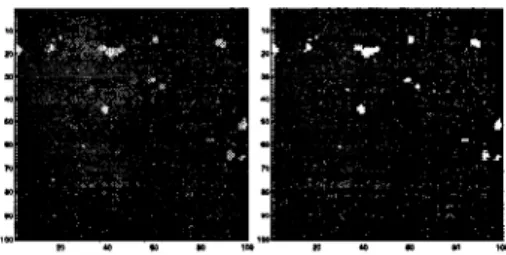
Figure 5. ( a ) A region of a m a m m o g r a m image con- taining microcalcifications, (b) output of the detec- tion scheme
Figure 6. Enhanced Images (a) Microcalcifications are superimposed on the mammogram image, (b) Mammogram image is magnified at the locations of microcalcificat ions
Figure 7. Enhanced and contrast stretched images (a) and (b) as defined in Figure 6.
hanced in Figure 4 (c). Figure 4 (d) illustrates the output of the outlier detection scheme. In the detection, only the detail-signal, Y d , is used. Figure 5 (a) shows a part of a mammogram image with a cluster of microcalcifications. In Figure 5 (b), the output of the microcalcification detection scheme is shown. Figure 6 illustrates the enhanced images for two approaches: superimposition and magnification.
In case enhancement of the tissue around the microcalci- fication regions is also desired, the final image can be dis- played after scaling so that the full dynamic range of the display device is employed. Figure 7 shows the results of such a contrast stretching algorithm.
In these figures the microcalcifications are successfully detected and mammogram images are enhanced. Addition- ally, the processing is simple, and does not require a full decomposition and reconstruction.
5. CONCLUSION
In this paper, automatic detection of microcalcifications in mammogram images is considered. The mammogram im- age is first processed by a nonlinear subband decomposi- tion filter bank. Microcalcifications, tiny, isolated regions, produce outliers in the detail-image. Next, the the detail- image is divided into overlapping square regions in which skewness and kurtosis are estimated. These higher order statistical parameters are measures of the asymmetry and impulsiveness of the distribution. Therefore a region with high positive skewness and kurtosis is marked as a region of interest. Finally, an outlier labeling method is used to find the locations of microcalcifications in these regions.
Subband decomposition structures both using linear and nonlinear filters are also examined. Both structures are suc- cessful in identifying regions with microcalcifications. The computational complexity of the linear subband decompo- sition structure is low compared to the nonlinear subband decomposition structure.
REFERENCES
[l] H. Yoshida, K. Doi, R. M. Nishikawa, “Automated de- tection of clustered microcalcifications in digital mam- mograms using wavelet transform techniques,” Proc. [2] H. Yoshida, W. Zhang, W. Cai, K. Doi, R. M. Nishikawa and M. L. Giger, “Optimizing Wavelet Transform Based On Supervised Learning For Detec- tion of Microcalcifications in Digital Mammograms,” Proceedings of IEEE Internatzonal Conference on Im- age Processzng, pp. 152-155 1995.
[3] R. N. Strickland, H. I. Hahn, “Wavelet Transform Matched Filters For the Detection and Classification of Microcalcifications in Mammography,” Proceedzngs of IEEE Internatzonal Conference on Image Process- ing, pp. 422-425, 1995.
141 Y. Barnett, T. Lewis, Outliers in Statistical Data, 3rd Ed. New York: John Wiley & Sons, 1994.
[5] 0. Egger, M. Kunt, “Embedded Zerotree Based Loss- less Image Coding,” IEEE ICIP’95, vol. I1 pp. 616- 619., June 1995.
[SI D. E. F. Florencio, R. Schafer “Perfect Reconstructing Nonlinear Filter Banks,” in ICASSP’96, 1996. [7] R. L. de Queiroz, D. A. F. Florencio, “A Pyramidal
Coding Using a Nonlinear Filter Bank,” in ICASSP’96, 1996.
[8] F. J. Hampson, J. C. Pesquet, “A Nonlinear Sub- band Decomposition with Perfect Reconstruction,” in ICASSP‘96, 1996.
[9] R. Ansari, A. E. Cetin, S. H. Lee, “Subband Coding of Images Using Nonrectangular Filter Banks,” in SPIE
Vol.974, Applications of Digital Image Processang X I , [lo] I. Pitas, A. N. Venetsanopoulos, Nonlinear Digital Fzlters
-
Prznciples and Applications, Massachusetts: Kluwer Academic Publishers, 1990.[ll] H. Chang, K. Doi, S. Galhotra, C. J. Vyborny, H. MacMahon, P. M. Jokich, “Image feature analysis and computer-aided diagnosis in digital radiography: I. Au- tomated detection of microcalcifications in mammog- raphy,” Medical Physics, Vol. 14, No. 4, Jul/Aug 1987. [12] B. Iglewicz, D. C. Hoaglin, How to Detect and Han- d l e Outliers, ASQC basic references in quality control; v.16, 1993.
[13] C. L. Nikias, A. Petropulu, Higher Order Statistzcal Analysis, Prentice Hall, 1994.
[14] P. J. Bickel, K. A. Doksum, Mathematzcal Statistics, Holden-Day California : 1977.
[15] M. N. Gurcan, Y. Yardimci, A. E. Cetin, Rashid Ansari, “Detection of microcalcifications in mammo- grams using nonlinear subband decomposition and out- lier labeling,” in Proceedings of SPIE Visual Communz- cations and Image Processing Conference, 8-14 Febru- ary, 1997, San Jose, CA.
SPIE, 2167~868-886, 1994.
pp. 315-322, 1988.