www.advmatinterfaces.de
FULL PAPER
Nanomechanical Characterization of Osteogenic
Differentiation of Mesenchymal Stem Cells on Bioactive
Peptide Nanofiber Hydrogels
Ahmet E. Topal, Gulistan Tansik, Alper D. Ozkan, Mustafa O. Guler,* Aykutlu Dana,*
and Ayse B. Tekinay*
DOI: 10.1002/admi.201700090
Mechanical properties such as cell elasticity, cytoskeletal organization, cell shape, and adhesion strength also play important roles in regulating cell fate and differentiation,[3] and it is therefore important to evaluate the impact of the intracellular biophysical processes that are involved in committing MSCs into specific lineages. However, while Young’s moduli of differentiating MSCs are well characterized on polymer and glass surfaces, it is unclear whether these obser-vations are valid for cells situated in their natural niches. Consequently, there is a need to determine the mechanical proper-ties of differentiating cells under conditions that approximate their natural environment.
Bioactive peptide nanofibers are remark-ably similar to the extracellular matrix (ECM) in structure and function, and can be utilized to promote or modulate the differentiation of stem cells into specific cell lineages, allowing their use as model scaffolds for investigating the behavior of differentiating cells in an ECM-like envi-ronment.[4] Mechanical properties of cells on peptide nanofibers have recently been measured using rheology[5]; however, this method is not capable of performing single-cell analysis and, instead, measures a combination of the cells and their sur-rounding matrix. Atomic force microscopy (AFM) is a promi-nent technique for the mechanical investigation of cellular behavior, and can be used to measure the Young’s moduli of single cells on peptide gels during the differentiation process.
Despite the ability of AFM to accurately determine the Young’s moduli of cells and their environments in liquid media, previous reports on the mechanical investigation of Stem cell differentiation is known to be influenced by the mechanical properties
of the surrounding extracellular matrix (ECM); however, little is known about the mechanical phenotypes of differentiating stem cells within the ECM. Here, this study uses osteoinductive, ECM-mimetic peptide nanofibers to investigate the changes in the mechanical properties of rat mesenchymal stem cells (rMSCs) during osteogenic differentiation. In addition, octafluorocyclobutane (C4F8
)-coated atomic force microscopy (AFM) cantilevers are developed to minimize tip–sample adhesion during the nanomechanical characterization of rMSCs, and osteogenic differentiation is monitored through molecular analysis in conjunction with AFM measurements. rMSCs cultured on osteoinductive pep-tide nanofibers differentiate at substantially higher rates, form osteogenic cell clusters, deposit calcium to the surrounding matrix, and strikingly increase their Young’s moduli throughout the osteogenic differentiation process compared to controls. These results show that the elasticity profiles of differentiating rMSCs may change significantly depending on environmental factors and especially the degree of biomineralization, and that the natural elasticity responses of cells cultured on scaffolds may be considerably different from those observed on non-bioactive surfaces. This is important for the identification of cell elasticity as a biophysical marker of osteogenic differentiation of MSCs, and indicates that biomineralization might have a predominant role on cell mechanics.
A. E. Topal, G. Tansik, A. D. Ozkan, Prof. M. O. Guler, Prof. A. Dana, Prof. A. B. Tekinay
Institute of Materials Science and Nanotechnology National Nanotechnology Research Center (UNAM) Bilkent University
Ankara 06800, Turkey
E-mail: [email protected]; [email protected]; [email protected]
Prof. M. O. Guler
Institute for Molecular Engineering University of Chicago
Chicago, IL 60637, USA
The ORCID identification number(s) for the author(s) of this article can be found under https://doi.org/10.1002/admi.201700090.
Osteogenic Differentiation
1. Introduction
Mesenchymal stem cells (MSCs) show great promise for use in regenerative medicine applications because of their potential to regenerate many types of tissues, including bone, cartilage, adi-pose, and muscle.[1] Mechanical characterization of MSCs differ-entiating into these tissue types may yield valuable insight for their therapeutic applications, and MSC treatment has shown consid-erable promise in the recovery of fracture injuries in particular.[2]
differentiating cells are far from unequivocal. Human MSCs were previously shown to get softer during osteogenic differen-tiation on glass substrates according to several AFM studies,[6,7] but MSCs in suspension culture have been reported to get stiffer during the same process.[8] However, optical stretching experiments performed by Maloney et al. neither detected an increase in Young’s modulus nor found a change in the deform-ability of differentiating human MSCs.[9] Consequently, there is no clear consensus on the mechanical changes undergone by MSCs during osteogenic differentiation.
In this work, we demonstrated that the elasticity profiles of differentiating rat mesenchymal stem cells (rMSCs) are greatly influenced by their environment and biomineralization capability, and suggest that the discrepancies reported in the literature may have resulted from variations in culturing conditions and sub-strates. In particular, we showed that rMSCs on gelatin-coated glass surfaces exhibited a gradual decrease in elasticity and a lim-ited capacity for osteogenic differentiation, while cells on bioactive peptide nanofibers differentiated effectively into mature osteo-blasts, extensively deposited minerals, and had higher Young’s moduli following differentiation, showing that biomineralization capacity heavily influences the mechanical characteristics of cells.
2. Results and Discussion
2.1. Synthesis and Characterization of Peptide Amphiphile (PA) Molecules and Self-Assembled Peptide Nanofibers
The 9-fluorenylmethoxycarbonyl (Fmoc) solid phase peptide synthesis method was used to synthesize lauryl-Val–Val–Ala–
Gly–Glu–Glu–Glu (lauryl-VVAGEEE, E3-PA) and lauryl-Val– Val–Ala–Gly–Lys–Lys–Lys–Am (lauryl-VVAGKKK-Am, K3-PA) molecules (Figure 1a), which were characterized by liquid chromatography–mass spectrometry (LC–MS) and purified by preparative high-performance liquid chromotography (HPLC) prior to use (Figures S1–S4, Supporting Information). The structure of E3-PA contains the osteoinductive Glu–Glu–Glu peptide motif and was inspired by noncollagenous matrix proteins,[10,11] while the positively charged K
3-PA was used to induce self-assembly when mixed with negatively charged E3-PA molecules under physiological conditions. The formation of a porous nanofiber network resembling the natural ECM was shown by scanning electron microscopy (SEM) imaging (Figure 1b), and nanofibrous structures formed by oppositely charged PA molecules were imaged by AFM both in aqueous and dried conditions (Figure 1c; Figure S5, Supporting Infor-mation). Circular dichroism (CD) measurements of self-assem-bled peptide nanofibers suggested a predominance of β-sheets with a chiral absorbance at 220 nm in the mixture of E3-PA and K3-PA, while individual PA molecules did not show a β-sheet signal (Figure 1d). Mechanical properties of the hydrogel were characterized by oscillatory rheology with time sweep analysis (Figure S6, Supporting Information), and a scaffold with a bulk storage modulus of ≈150 kPa and a loss modulus of ≈30 kPa was found to be formed by the mixture of E3-PA and K3-PA at 1% w/v concentration. The mixture was assessed to be a hydrogel due to the storage modulus being greater than the loss modulus, which suggests that sol–gel transition had taken place.[12] AFM measurements of peptide nanofiber-coated cov-erslips in osteogenic medium also showed that the nanofibrous hydrogel had an average Young’s modulus of 95, 31, and 39 kPa
Figure 1. Design and self-assembly of PA molecules. a) Chemical structures of lauryl-VVAGEEE (E3-PA) and lauryl-VVAGKKK-Am (K3-PA). b) Network
structure of the hydrogel, as shown by SEM. Scale bar is 2 µm. c) Contact mode AFM deflection image of self-assembled peptide nanofibers, measured in aqueous environment on a mica surface. d) Circular dichroism (CD) spectroscopy characterization of peptide amphiphile molecules (E3-PA and
www.advancedsciencenews.com
www.advmatinterfaces.de
at days 3, 7, and 14 of incubation (Figure S7, Supporting Infor-mation), which is in the 20–100 kPa range that was previously reported to be optimal for osteoblast calcification.[13]
2.2. Cell Viability and Morphology of rMSCs on Peptide Nanofibers
The biocompatibility of peptide nanofibers for rMSCs was tested by calcein-AM/ethidium homodimer staining at 24 h. No significant difference was observed between the viabilities of cells on peptide scaffold-coated, gelatin-coated, and bare tissue culture plate (TCP) surfaces, suggesting that the peptide nanofibers provided a biocompatible environment for cellular survival and proliferation (Figure S8, Supporting Information). Phalloidin staining showed that rMSCs formed actin networks on peptide nanofibers, gelatin, and TCP (Figure S9, Supporting Information). In addition, cells cultured on nanofibers were observed to aggregate from day 3 onward and form bone-nodule-like structures (Figures S9 and S10, Supporting Infor-mation), which is a hallmark of intramembranous ossification and usually precedes the differentiation of MSCs into osteopro-genitor cells and osteoblasts.[14]
2.3. AFM Probe Design and Optimization
For AFM analysis of biological samples, engineering of the actual tip–sample interaction is desirable for stable imaging and characterization. There are several important issues that need to be addressed for this purpose. For example, it is not clear if the cell can be modeled simply as a viscoelastic medium.[15] Moreover, depending on the type of the cell, the surface can be crowded by a cell brush, which makes it difficult to obtain high-resolution images or use simple viscoelastic models.[16] Finally, the cell surface is subject to stiction by the tip, and this causes stability problems and unrepeatability in nanomechanical map-ping or characterization.[17]
To address the issues of repeatability of force–distance measurements and stability of nanomechanical imaging on soft matter, we developed tips with controlled radii and stic-tion properties by coating the tips with a fluoropolymer layer (Figure S11, Supporting Information). The coating was depos-ited using plasma polymerization in an inductively coupled plasma (ICP) system using octafluorocyclobutane (C4F8) as the precursor gas. The coating can be applied on standard AFM cantilevers, and tip radius can be easily controlled by adjusting the deposition thickness. The stress associated with the coating process was seen to induce bending in soft cantilevers (k = 0.03 N m−1), and the coating duration was optimized to reduce the bending (data not shown). The plasma process used here is more versatile than two-photon photopolymerized tips (which were previously demonstrated for adhesion-free scan-ning)[18] and can be readily performed in any ICP system with a deep reactive-ion etching process, on any type of cantilever.
The forces acting on the cantilever were also investigated for different contact models (Figure S12, Supporting Informa-tion). Following fluoropolymer coating, the blunted AFM tip is best described as a spherical indenter, in which case the Hertz
model can be used to describe the force versus indentation. The uncoated cantilevers have sharp tips (7 nm tip radius) and the Sneddon model is suitable for their modeling. Between the two types of tips, the coated tip was found to experience a greater reaction force from the sample at smaller indentations (1 nN at 200 nm indentation depth) compared to the sharp tip (1 nN at 750 nm indentation depth).
In addition, the peak pressures for similar interaction forces were much smaller for the coated tip (or “fluorotip”), which could be used for tapping mode imaging of live cells (Figure 2a). Rapid scans could be achieved without disturbing the vitality of the cell, as evidenced by the observation of the subsurface motion of cellular structures during imaging (Figure 2b, also see Movie S1, Supporting Information). Indeed, even at high scan frequencies (4 Hz, 80 µm s−1 in water) the trace and retrace images closely followed the same topography (Figure 2c). Figure S13 (Supporting Information) shows the amplitude, phase, and topography channels for the trace and retrace images of an rMSC at 1 Hz line speed. The repeatability of the force–distance measurements was also investigated using fluorotips, and conventional force–distance maps at 1 Hz frequency could be acquired on cells in a repeatable manner (Figure S14, Supporting Information). Using fluorotips of 170 nm tip radius and 30 pN nm−1 spring constant, it was pos-sible to measure 1D and 2D force distance maps with highly repeatable curves, even with large indentation values spanning several micrometers.
2.4. Analysis of Mechanical Properties of Stem Cells Cultured on Scaffolds
Cell elasticity is one of the most important mechanical proper-ties of cells and can change considerably during the differentia-tion process.[6] However, despite the extensive characterization of cellular differentiation in response to externally provided mechanical signals, there is little work regarding the mechan-ical effects exhibited by differentiating cells themselves. Here, we used AFM to investigate the changes in the mechan-ical properties of rMSCs during osteogenic differentiation (Scheme 1). Force mapping measurements were performed on rMSCs on peptide nanofibers, gelatin, and bare glass by using C4F8-coated AFM fluorotips (Figures S10, S11, and S15, Supporting Information). Young’s modulus values were calcu-lated by fitting approach curves using the conical Hertz model (Figure S15, Supporting Information). Twelve force curves per cell were used in data analysis and are presented as histo-grams (Figure 3). The results showed that rMSCs in osteogenic medium significantly increased their Young’s moduli on peptide nanofibers, from an average value of 1.10 ± 0.06 kPa on day 3 to 1.86 ± 0.09 kPa on day 7 and to 2.89 ± 0.10 kPa on day 14 (Figure 3). In contrast, the elasticity of rMSCs on glass did not change significantly between day 3 (3.09 ± 0.10 kPa) and day 7 (3.03 ± 0.08 kPa). However, there was a significant increase between days 7 and 14 (3.64 ± 0.14 kPa), and Young’s modulus values of cells on glass were consistently higher than those on peptide nanofibers. This might be a substrate effect associated with glass, as rigid surfaces can yield higher values of AFM Young’s modulus measurement results compared to softer
surfaces.[19] In contrast to both glass and peptide nanofibers, rMSCs differentiating on gelatin exhibited a decreasing trend across all days tested.
No clear consensus exists on the mechanical changes asso-ciated with the osteogenic differentiation of MSCs. In the lit-erature, some research groups have shown that MSCs decrease their Young’s modulus values during osteogenic differentiation on flat surfaces.[6,7] In contrast, Chen et al. have reported that osteogenesis increased both elastic and viscous moduli of dif-ferentiating human MSCs[20]; while Yu et al. demonstrated that human MSCs in suspension culture likewise exhibit increased elastic moduli at later stages of differentiation.[8] Although our results on gelatin-coated substrates agree with those of Titushkin and Cho and Bongiorno et al., the effective increase in the Young’s modulus of rMSCs on peptide nanofibers sug-gests that the microenvironment of cells heavily influences their mechanical characteristics during osteogenic differentiation.[6,7] It is also notable that the elastic modulus of cells on peptide nanofibers at day 3 is comparable to previously reported values of osteoblast elastic moduli (1–2 kPa),[21] and cells on gelatin were only within the elasticity range of osteoblasts (≈1.56 kPa)
at day 14. This effect might result from the limited progres-sion of osteogenic differentiation of cells on gelatin-coated samples, while cells on peptide nanofibers differentiate rapidly, exhibiting an osteoblast-like Young’s modulus at day 3 and an increase in stiffness afterward due to the deposition of a min-eral matrix.
The increase in Young’s moduli, in conjunction with the formation of bone-nodule-like clusters, also suggests that the differentiation of rMSCs into mature osteoblasts is enhanced on osteoinductive nanofibers. The formation of such clusters is ordinarily seen at later stages of differentiation, and previous studies on the AFM of osteodifferentiating MSCs (which have used non-bioactive substrates instead of peptide nanofibers) report no aggregate formation during the early days of cul-ture. In addition, bone-nodule formation is associated with calcium deposition by the maturing osteoprogenitors, which may, in turn, contribute to the increased Young’s modulus values observed in rMSCs on peptide nanofibers. Conse-quently, we investigated the osteogenic differentiation ability of cells by gene expression analysis, alkaline phosphatase (ALP) activity assay, and Alizarin red staining to determine whether
Figure 2. Imaging of live cells using fluorotips. a) Composite image of rMSCs captured in buffer at 1 Hz (second harmonic tapping mode; height,
amplitude, and phase are color-coded; scale bar is 20 µm; see also Figure S13, Supporting Information). b) Rapid scans (4 Hz line frequency, 80 µm s−1)
can capture 30 s per frame images which show cellular dynamics without disturbing cell vitality (scale bar is 2 µm; also see Movie S1, Supporting Information). c) Overlapping trace and retrace profiles acquired during 4 Hz scan (part (b)) show minimal cell loading and mechanical distortion.
www.advancedsciencenews.com
www.advmatinterfaces.de
the observed differences between the mechanical properties of cells on peptide nanofiber-coated and gelatin-coated glass were attributable to the scaffold-induced maturation of osteoblasts and deposition of a calcium matrix.
2.5. Molecular Analysis of Osteogenic Differentiation Markers
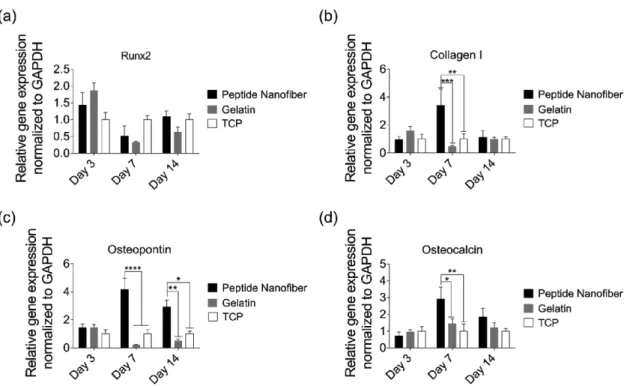
The osteogenic differentiation of MSCs is accompanied by the sequential expression of a series of genetic markers.[22] To understand whether rMSCs commit to the osteogenic lineage on the peptide nanofiber system, gene expression profiles of cells cultured on peptide nanofiber-coated, gelatin-coated, and noncoated (bare TCP) surfaces were analyzed and quantified. Expressions of the osteogenic markers Runt-related transcrip-tion factor 2 (Runx2), type I collagen (collagen I), osteopontin, and osteocalcin were evaluated on days 3, 7, and 14 (Figure 4). Runx2 is often referred to as the key regulator of osteogenic dif-ferentiation,[23] and its expression is usually analyzed during the early phases of this process. The expression of Runx2 was upregulated when rMSCs were cultured on peptide nanofibers and gelatin-coated wells compared to cells on bare TCP sur-faces on day 3 (Figure 4a). Also observed at an early stage is the deposition of a collagen matrix, which acts as a template for mineralization.[24] Collagen I expression was significantly upregulated in cells cultured on synthetic peptide nanofibers compared to gelatin-coated wells and bare TCP, exhibiting an enhancement of ≈3.4 folds on day 7 (Figure 4b).
In addition to collagen I, several noncollagenous proteins have crucial roles in the formation and maturation of mineral-ized tissues. Osteopontin is one of the most notable noncolla-genous proteins and is expressed at high levels during the late
stages of osteogenic differentiation. Here, osteopontin expression of cells on peptide nanofibers was also significantly higher as compared to gelatin-coated wells on days 7 and 14 by ≈18.8 and ≈5.8 folds, respectively (Figure 4c). The expression of osteopontin was also enhanced by ≈4.1 and ≈2.9 folds on days 7 and 14, respectively, on peptide nanofibers compared to TCP (Figure 4c). Osteocalcin is another noncollagenous pro-tein that is crucial for the mineralization of bone, and its upregulation is a characteristic of mature osteoblast formation. In this study, cells on peptide nanofibers showed signifi-cantly higher osteocalcin expression on day 7 compared to gelatin and TCP groups by ≈2 and ≈2.9 folds, respectively (Figure 4d). On day 14, osteocalcin expression was also enhanced by ≈1.5 and ≈1.8 folds on peptide nanofibers compared to gelatin and TCP groups, respectively (Figure 4d).
Overall, gene expression profiles show that, although MSCs differentiate into the osteogenic lineage on both gelatin and pep-tide nanofibers, osteogenic differentiation is enhanced to a greater degree on peptide nanofiber surfaces. The promotion of cell– substrate interactions has previously been demonstrated to be crucial for osteogenic differentiation, and the similarity of the E3/K3-PA system to noncollagenous proteins of the bone extracellular matrix (e.g., polyglutamate stretches of bone sialoprotein) may allow the peptide nanofibers to stim-ulate osteogenesis by binding to cell surface receptors and enhancing contact-dependent mechanotransduction path-ways.[25] In addition, osteogenic differentiation itself is known to alter cellular morphology, cytoskeletal organization, and matrix deposition, which may also contribute to the effect of E3/K3-PA nanofibers on the Young’s moduli of rMSCs.[20,26] Since MSCs appeared to go into osteogenic differentiation both on peptide nanofiber and gelatin-coated wells, next, we examined the biomineralization of these cells to determine the reason behind the differences in their mechanical proper-ties observed by AFM.
2.6. Biomineralization Characteristics Define the Mechanical Properties of Osteogenic Differentiation
Biomineralization is an important component of osteogenic differentiation, and osteoblasts are the major cells that carry out the synthesis and mineralization of the extracellular matrix of bone.[27] A vital phase of biomineralization involves the dep-osition of calcium and phosphate, which is a long-term pro-cess that is initiated during early osteogenesis by the release of inorganic phosphate units from pyrophosphate through alka-line phosphatase activity.[22,28,29] Consequently, we tested the ALP activity of rMSCs cultured on peptide nanofiber, gelatin, and TCP surfaces after 3, 7 and 14 d of incubation in osteo-genic medium. rMSCs cultured on peptide nanofibers showed
Scheme 1. Schematic representation of AFM nanomechanical analysis on hierarchically
significantly higher ALP activity compared to gelatin and TCP groups (Figure 5a). Maximum ALP activity was observed on day 3 for peptide nanofiber and gelatin groups, decreasing afterward at days 7 and 14 (Figure 5a). In contrast, ALP activity of cells on TCP was minimal on day 3 and reached its max-imum level on day 7 (Figure 5a). These results suggest that the nanofiber structures can effectively stimulate ALP activity in rMSCs, which is crucial for their subsequent differentiation and mineralization.
Calcium deposits can also be visualized directly using Alizarin red S, which che-lates Ca2+ and is a commonly used dye for the evaluation of bone mineralization.[29,30] In this study, the visible mineralization of cells on peptide nanofibers in the presence of osteogenic supplements started at day 7 (Figure 5b), and quantitative analysis of rela-tive calcium deposition showed a significant increase (p < 0.0001) compared to gelatin and TCP groups at this point (Figure 5c). Cells cultured on peptide nanofibers showed early matrix mineralization with extensive Alizarin red staining on days 7 and 14, in contrast to gelatin and TCP groups which exhibited sig-nificantly less staining (Figure 5b–d). The difference in the rates of biomineralization is a likely reason for the changes in elastic moduli observed between cells cultured on gelatin-coated and peptide nanofiber-coated surfaces.
Although MSCs do not deposit extra-cellular calcium, osteoblasts are known to secrete considerable amounts of extracellular calcium deposits.[24] In this study, cells cul-tured on peptide nanofibers showed higher matrix mineralization upon differentiation, suggesting that they were rapidly and effec-tively committed to the osteogenic lineage. rMSCs on peptide nanofibers also showed early calcium deposition on day 7, which may be due to the effect of E3-PA on the early maturation of osteoblasts; this PA molecule incorporates negatively charged glutamic acid residues in its sequence, which allows it to strongly bind calcium ions that induce the biomineralization process.[10] As such, our results suggest that differences in min-eralization patterns may contribute strongly to the increase in the Young’s modulus of rMSCs cultured on peptide nanofibers com-pared to gelatin-cultured cells.
3. Conclusions
We show that enhanced biomineraliza-tion and osteogenic differentiabiomineraliza-tion can significantly alter the mechanical proper-ties of MSCs, and suggest that Teflon-like thin-film-coated fluorotips are effective tools for measuring the elasticity of differentiating cells. Biomineralization and the formation of cell clusters are associated with increases in the Young’s moduli of differentiating MSCs on osteoinductive peptide nanofibers, while cells on gelatin-coated glass surfaces displayed a decreasing pattern of Young’s moduli. Nevertheless, further investigation into the mechanical aspects of osteogenic differentiation is required to identify the individual contribu-tions made by cellular and extracellular elements to Young’s
Figure 3. Effect of matrix properties on the Young’s moduli of rMSCs during osteogenic
differ-entiation. Young’s modulus distribution of rMSCs on days 3, 7, and 14 of osteogenic differen-tiation on peptide nanofiber-coated glass, on bare glass, and on gelatin-coated glass (****p < 0.0001, ***p < 0.001, **p < 0.01, and *p < 0.05). Each data point indicates a single force–dis-tance curve, n indicates the number of cells analyzed for each day. Twelve curves per cell were selected from force maps and grouped for each substrate group.
www.advancedsciencenews.com
www.advmatinterfaces.de
Figure 4. Molecular analysis of osteogenic differentiation. Gene expression analysis of a) Runx2, b) collagen I, c) osteopontin, and d) osteocalcin on
days 3, 7, and 14 of osteogenic differentiation. The expression level of each gene was normalized against TCP; GAPDH was used as internal control. Values represent mean ± standard error of mean (****p < 0.0001, ***p < 0.001, **p < 0.01, and *p < 0.05).
Figure 5. Biomineralization profile of rMSCs during osteogenic differentiation. a) ALP activity of rMSCs on days 3, 7, and 14 of osteogenic
differentia-tion. b) Alizarin red staining of rMSCs on peptide nanofibers, gelatin, and bare TCP on days 3, 7, and 14. Scale bar is 100 µm. c,d) Quantification of Ca2+ deposition on peptide nanofibers, gelatin, and bare TCP on days 7 and 14. Values represent mean ± standard error of mean (****p < 0.0001,
modulus measurements under a broader range of material and scaffold configurations. For example, different peptide sequences can be used to determine the effect of specific motifs on the elastic moduli of differentiating MSCs, while 3D scaf-folds can be used to provide a more tissue-like environment to encapsulated cells. Such efforts may lead to greater insight into the roles played by the cytoskeleton and the surrounding biomineralized matrix in maintaining or altering the stiffness of differentiating rMSCs, and would be of considerable value for the development of tissue engineering scaffolds that better approximate the mechanical aspects of cell–ECM interactions, which are critical for facilitating the osteogenic commitment of MSCs for therapeutic applications.
4. Experimental Section
Materials: 4-(2 ′,4′-dimethoxyphenyl-Fmoc-aminomethyl)-phenoxy-ace ta mido-norleucyl-MBHA resin (Rink amide MBHA resin), Fmoc-Asp(OtBu)-Wang resin, all protected amino acids, lauric acid, 2-(1H-benzotriazol-1-yl)-1,1,3,3-tetramethyluroniumhexafluorophosp hate (HBTU), and diisopropylethylamine (DIEA) were purchased from Nova-Biochem, ABCR, or Sigma-Aldrich. Calcein-AM and other cell culture materials were purchased from Invitrogen. All other chemicals and materials used in this study were purchased from Thermo Scientific or Sigma-Aldrich.
Synthesis of PA Molecules: The Fmoc solid phase peptide synthesis
method was used to synthesize K3-PA and E3-PA. Rink amide MBHA
resin (Novabiochem) was used as the solid support for K3-PA, while
Fmoc-Glu(OtBu)-Wang resin (100–200 mesh) served as solid support for E3-PA. Amino acid couplings were carried out with 2 molar equivalents
of Fmoc-protected amino acid, 1.95 molar equivalents of HBTU, and 3 molar equivalents of DIEA for 2 h. Fmoc-protecting groups were removed from Nα-amino moieties through exposure to 20% piperidine
in dimethylformamide (DMF) solution for 20 min. About 10% of acetic anhydride in DMF solution was used to block the remaining free amine groups after amino acid coupling. The resin was washed using DMF and dichloromethane after each step. The cleavage of PAs and protecting groups from the resin was carried out with a mixture of trifluoroacetic acid (TFA):triisopropylsilane:H2O at a ratio of 95:2.5:2.5 for 2.5 h. Excess
TFA was removed by rotary evaporation, and PAs were precipitated using ice-cold diethyl ether at −20 °C overnight. The precipitate was then collected by centrifugation, dissolved in ultrapure water, and frozen at −80 °C overnight. The frozen samples were lyophilized for 4 d. The identity and purity of peptide amphiphile molecules were determined by LC–MS (Agilent 6530−1200 Q-TOF) analysis. Mass spectra were obtained with an Agilent LC–MS equipped with Agilent 6530 Q-TOF with an Electrospray ionization (ESI) source and a Zorbax Extend-C18 2.1 mm × 50 mm column for basic conditions, while a Zorbax SB-C8 4.6 mm × 100 mm column was used for acidic conditions. A gradient of water (0.1% formic acid or 0.1% NH4OH) and acetonitrile (0.1% formic acid
or 0.1% NH4OH) was used as the mobile phase. To purify the peptides,
an Agilent preparative reverse-phase HPLC system equipped with a Zorbax Extend-C18 21.2 mm × 150 mm column was used for basic conditions, and a Zorbax SB-C8 21.2 mm × 150 mm column was used for acidic conditions. A gradient of water (0.1% TFA or 0.1% NH4OH)
and acetonitrile (0.1% TFA or 0.1% NH4OH) was used as the mobile
phase. Positively charged PAs were treated with 0.1 m HCl solution and
lyophilized to remove residual TFA.
Formation of Self-Assembled PA Nanofibers: Stock solutions of PAs
were prepared in distilled water. For nanofiber formation, E3-PA (0.75 ×
10−3m) was mixed with K3-PA (1 × 10⁻³m) at a 1:1 (v/v) ratio to stabilize
all net charges. Tissue culture plate surfaces were coated with the PA mixture and placed under laminar flow hood overnight for drying. After drying, plates were sterilized with UV light for an hour before cell culture
studies. After the addition of cell culture medium, these nanofibers formed a hydrogel layer that was several millimeters thick.
Oscillatory Rheology: Bulk mechanical properties of the peptide
amphiphile hydrogel (1% w/v) were characterized by rheology analysis. A total volume of 250 µL was used from a mixture of 108 µL E3-PA (11 ×
10−3m) and 144 µL K3-PA (11 × 10−3m). A PP25-SN17979 measuring
device with a 25 mm diameter was used with an Anton Paar MCR-301 rheometer for the analysis. The measuring distance was determined as 0.5 mm. Time sweep tests were carried out for 30 min with three repeats, with a measurement point duration of 0.5 min. Angular frequency and strain magnitude were kept constant as ω = 10 rad s−1 and γ = 0.1%,
respectively.
Circular Dichroism: CD samples were prepared by mixing oppositely
charged PA solutions (1 × 10⁻³m) at a 3:4 volume ratio to stabilize all net
charges. This mixture was then diluted to a final peptide concentration of 0.33 × 10⁻³m in a final volume of 300 µL. A JASCO J815 CD spectrometer
was used at room temperature for the acquisition of CD spectra, which were measured in the range of 300–190 nm with a data pitch of 0.1 nm, a scanning speed of 100 nm min−1, and all measurements representing
three accumulations. Digital Integration Time was selected as 1 s, bandwidth as 1 nm, and the sensitivity as standard.
SEM Imaging: About 1 wt % solution of E3-PA was mixed with 1 wt %
solution of K3-PA at a 3:4 volume ratio on a silicon wafer cleaned
previously in acetone, ethanol, and water. The peptide nanofiber hydrogel formed on the silicon wafer was incubated at room temperature for 30 min, dehydrated in 20%, 40%, 60%, and 80% ethanol solutions for 10 min in each solution, and finally incubated in absolute ethanol for 3–4 h. Then, the hydrogel was critical point dried with an Autosamdri-815B Tousimis Critical Point Drying (CPD) and coated with 5 nm Au/Pd by sputtering before SEM imaging. An FEI Quanta 200 FEG SEM with an Everhart-Thornley detector (ETD) in high vacuum mode and with 5 kV electron beam energy was used for the imaging of peptide nanofibers at 30 000× magnification.
AFM Imaging of Peptide Nanofibers: For AFM imaging of peptides
in water, E3-PA (0.75 × 10⁻³m) was mixed with K3-PA (1 × 10⁻³m) at
1:1 (v/v) ratio in double-distilled water and transferred to a freshly cleaved mica surface. Silicon nitride Bio-Lever (Olympus, BL-RC150VB-C1) AFM probes were used for contact mode imaging of the self-assembled peptide nanofibers in solution. For AFM imaging of air-dried peptide nanofibers, E3-PA (0.75 × 10⁻³m) was mixed with K3-PA (1 × 10⁻³m)
at a 1:1 (v/v) ratio in double-distilled water. The mixed solution was incubated overnight. Glass coverslips were used as substrates and cleaned by sonication in ethanol for 15 min and subsequent immersion in water prior to use. Cleaned substrates were dried with nitrogen gas, and 10 µL of overnight-incubated peptide mixture was added onto the cleaned substrates. Silicon TAP150Al tapping mode AFM probes (Budget Sensors) were used for the tapping mode imaging of peptide nanofibers.
Cell Culture and Maintenance: rMSCs (Invitrogen) were used at
passage number 7 in all cell culture experiments. Cells were cultured in 75 cm2 flasks at a density of 3 × 10³ cells cm−2 at 37 °C in a humidified
incubator and supplied with 5% CO2. The rMSCs were maintained
in low-glucose Dulbecco’s Modified Eagle Medium (DMEM) with
l-glutamine, supplemented with 10% fetal bovine serum (FBS) and 1%
penicillin/streptomycin. All cell experiments were carried out after the cells reached 90% confluency. The culture medium was changed every 3–4 d. Cells were seeded under the same conditions used for their maintenance. For the gelatin group, tissue culture plates were coated with 0.1% porcine gelatin (Millipore). For mineralization experiments, gene expression analyses and AFM studies, the seeded cell medium was replaced with osteogenic medium (DMEM with 10% FBS supplemented with 10 × 10−3m β-glycerophosphate, 50 µg mL−1 ascorbic acid, and 10 ×
10−9m dexamethasone) after reaching confluency.
Viability Assay: The viability of rMSCs incubated on peptide
nanofiber-coated, gelatin-nanofiber-coated, and uncoated TCP was studied by Live/Dead Assay (Invitrogen). Briefly, cells were seeded on peptide nanofiber-coated, gelatin-nanofiber-coated, and uncoated 96-well tissue culture plates at a density of 5 × 10³ cells per well. After 24 h of incubation, cell medium
www.advancedsciencenews.com
www.advmatinterfaces.de
(PBS) and incubated with 2 × 10⁻⁶m calcein-AM and 2 × 10⁻⁶m EthD-1
in PBS for 30 min at room temperature. After incubation, images were taken at three random points per well with a fluorescent microscope (Zeiss, Axio Scope A1) at 100× magnification. All samples were analyzed in triplicate. Live and dead cells were counted by using Image J.
Actin Staining of rMSCs on Peptide Nanofiber-Coated Surfaces: Cells
were seeded on top of the peptide nanofiber-coated, gelatin-coated, and uncoated surfaces at a density of 4 × 10⁴ cells per coverslip. After
7 and 14 d of culture in osteogenic medium, phalloidin/TO-PRO-3 staining was performed for peptide nanofiber-coated and bare surfaces. Before staining, cells were fixed with 4% formaldehyde for 15 min and permeabilized with 0.1% Triton-X for 10 min at room temperature. Samples were incubated with 3% (w/v) bovine serum albumin (BSA)/ PBS for blocking for 30 min. Actin filaments of the cells were initially stained with 1:500 diluted Fluorescein isothiocyanate(FITC)-conjugated phalloidin (Thermo Fisher) in 3% (w/v) BSA/PBS for 20 min. After serial washing steps, samples were stained with 1:1000 diluted TO-PRO-3 (Thermo Fisher) or 1:3000 diluted 4’,-6-diamidino-2-phenylindole (DAPI) (Thermo Fisher) for 20 min for the visualization of nuclei. Coverslips were mounted with Prolong Gold Antifade Reagent (Invitrogen). Cytoskeletal organizations of cells on peptide nanofibers, gelatin, and bare glass were observed using a Zeiss LSM 510 confocal microscope at 630× magnification.
AFM Force Mapping Measurements of Stem Cells Cultured on Scaffolds:
Pyramidal silicon nitride (SiNi) AFM probes (Budget Sensors, Bulgaria) were coated with octafluorocyclobutane (C4F8) plasma for 10 min
at a rate of 80 sccm using an ICP device. Force measurements were performed with probes (fluorotips) that were coated with ≈200 nm of a Teflon-like thin film, with a diameter of ≈350 nm at the tip apex. An Asylum Research MFP-3D AFM was used to perform force mapping in contact mode. Force maps were taken at a resolution of 16 × 16 or 32 × 32 from a 50 µm × 50 µm area. A trigger point of 0.5 V was applied for force–distance curve measurements. Force distances were set at either 10 or 5 µm. Vertical deflection correction was performed before starting force map measurements. Cells were grown on bare, gelatin-coated, and peptide-coated glass coverslips (13 mm diameter) at a density of 4 × 10⁴
cells per coverslip. Coverslips were glued onto glass slides using nail polish before AFM measurements. Each coverslip sample was measured within 1.5 h at room temperature in DMEM. Used AFM probes were cleaned either through successive washing in double-distilled water, acetone and double-distilled water, or with only double-distilled water. AFM mechanical measurements of cell-free peptide nanofiber networks were also performed for comparison (Figure S7, Supporting Information).
AFM Data Analysis: A total of 12 force curves were selected per cell
for AFM analysis. The number of cells analyzed (n) were n = 45 on day 3,
n = 58 on day 7, and n = 44 on day 14 for rMSCs on bare glass; n = 29 on day 3, n = 35 on day 7, and n = 32 on day 14 for rMSCs on peptide nanofibers; n = 65 on day 3, n = 90 on day 7, and n = 42 on day 14 for rMSCs on gelatin-coated glass. Force curves were selected randomly from each cell area. The conical Hertz model was applied to calculate Young’s moduli from approach curves using the Igor Pro AFM analysis software.[31] Half-cone angle was assumed to be 36°, and the Poisson
ratio of the cells was assumed to be 0.33. Outlier removal was done via GraphPad’s online QuickCalcs tool.
ALP Activity Assay: To measure the ALP activity of rMSCs, degradation
of p-nitrophenol due to endogenous ALP activity was quantified after 3, 7, and 14 d of culture in osteogenic medium. Briefly, cells were seeded on peptide nanofiber-coated, gelatin-coated, and uncoated surfaces of 48-well plates at a density of 2 × 10⁴ cells per well, and the cell medium
was replaced with osteogenic medium after the cells reached confluency. Cells were rinsed with PBS at predetermined time points. M-PER protein extraction kit (Thermo Scientific) with 5% protease inhibitor solution was used to extract proteins. Pierce BCA protein assay (Thermo) was performed to quantify the amount of proteins obtained from the cells according to the manufacturer’s protocol. To measure ALP activity, 50 µL of the protein sample was incubated with 150 µL of p-nitrophenol phosphate substrate in 96-well plates for 30 min on a shaker. Serial
dilutions of p-nitrophenol in 0.25 m NaOH solution were used as
standards. Finally, the optical density of the samples was determined at 405 nm using a Spectramax M5 microplate reader, and ALP results were normalized to the amount of total proteins at each time point tested.
Gene Expression Analysis: For gene expression studies, rMSCs were
seeded on peptide nanofiber-coated, gelatin-coated, and uncoated wells of 6-well plates at a density of 2.5 × 10⁵ cells cm−2. After cells reached
confluency, their media were replaced with osteogenic medium. Gene expression profiles of Runx2, collagen I, osteopontin, and osteocalcin were evaluated by quantitative Reverse transcription polymerase chain reaction (RT-PCR) analysis for investigating the osteogenic differentiation process. RNA isolation from rMSCs seeded on peptide nanofiber-coated, gelatin-coated, and bare surfaces was performed after 3, 7, and 14 d of incubation by using TRIzol (Invitrogen) according to the manufacturer’s instructions. Yield and purity of extracted RNAs were assessed by Nanodrop 2000 (Thermo Scientific). Samples were diluted to a concentration of 100 ng µL−1 prior to their use. Primers
for PCR amplification of Runx2, collagen I, osteopontin, osteocalcin, and glyceraldehyde 3-phosphate dehydrogenase (GAPDH) are shown in Table S1 (Supporting Information). cDNA synthesis from RNA and qRT-PCR were performed using SuperScript III Platinum SYBR Green One-Step qRT-PCR Kit according to the manufacturer’s instructions. mRNA levels were calculated and normalized to GAPDH according to the comparative Ct method for each target gene.[32]
Detection of Mineralization by Alizarin Red Staining: Calcium deposition
on the surface of peptide nanofibers was measured on days 3, 7, and 14 using Alizarin red staining. Briefly, rMSCs were seeded on peptide nanofiber-coated, gelatin-coated, and uncoated surfaces of 96-well plates at a density of 1 × 10⁴ cells per well in DMEM containing 10% FBS and
1% penicillin–streptomycin. Cells were cultured in this medium until they reached confluency, and the medium was then replaced with fresh osteogenic medium. Osteogenic medium was replenished every 3–4 d over the course of the experiments. At predetermined time intervals, cells were fixed with ice-cold ethanol for 1 h and stained with 40 × 10−3m
Alizarin red S for 30 min on a shaker. Then, samples were washed four to five times with double-distilled water to remove nonspecific Alizarin red binding. Calcium nodules were imaged in PBS under light microscope (no staining was observed on scaffolds without cells; Figure S16, Supporting Information). In order to quantify the deposited calcium, PBS was discarded and the samples were incubated in 10% cetylpyridinium chloride for 30 min at room temperature. At the end of the incubation period, the solution was transferred to 96-well plates, and absorbance measurements were performed at 562 nm.
Statistical Analysis: All quantitative values were presented as mean ± standard error of mean, and all experiments were performed with at least three replicates. One-way analysis of variance (ANOVA) and two-way ANOVA were used for the statistical analysis of the viability test, ALP activity assay, gene expression studies, AFM measurements and quantification of mineral deposition. A p-value of less than 0.05 was considered statistically significant. All statistical tests were performed using GraphPad Prism v7.00.
Supporting Information
Supporting Information is available from the Wiley Online Library or from the author.
Acknowledgements
A.E.T. and G.T. contributed equally to this work. The authors thank Aygul Zengin for her kind technical help during the solid phase peptide synthesis of peptide amphiphile molecules. The authors acknowledge Fatma Begum Dikecoglu for her kind assistance in the rheology measurements of peptide nanofiber hydrogels. This work was supported by TUBITAK grant 214M011.
Conflict of Interest
The authors declare no conflict of interest.
Keywords
atomic force microscopy, mesenchymal stem cells, osteogenic differentiation, peptide amphiphile, stem cell biomechanics
Received: January 22, 2017 Revised: July 10, 2017 Published online: August 4, 2017
[1] P. S. Mathieu, E. G. Loboa, Tissue Eng., Part B 2012, 18, 436. [2] a) W. C. Lee, H. Shi, Z. Poon, L. M. Nyan, T. Kaushik,
G. Shivashankar, J. K. Chan, C. T. Lim, J. Han, K. J. Van Vliet,
Proc. Natl. Acad. Sci. USA 2014, 111, E4409; b) M. N. Knight,
K. D. Hankenson, Adv. Wound Care 2013, 2, 306.
[3] R. McBeath, D. M. Pirone, C. M. Nelson, K. Bhadriraju, C. S. Chen,
Dev. Cell 2004, 6, 483.
[4] a) G. Tansik, E. Kilic, M. Beter, B. Demiralp, G. K. Sendur, N. Can, H. Ozkan, E. Ergul, M. O. Guler, A. B. Tekinay, Biomater. Sci.
2016, 4, 1328; b) E. Arslan, I. C. Garip, G. Gulseren, A. B. Tekinay,
M. O. Guler, Adv. Healthcare Mater. 2014, 3, 1357; c) S. U. Yaylaci, M. Sen, O. Bulut, E. Arslan, M. O. Guler, A. B. Tekinay, ACS
Bio-mater. Sci. Eng. 2016, 2, 871.
[5] C. M. Scott, C. L. Forster, E. Kokkoli, Langmuir 2015, 31, 6122. [6] I. Titushkin, M. Cho, Biophys. J. 2007, 93, 3693.
[7] T. Bongiorno, J. Kazlow, R. Mezencev, S. Griffiths, R. Olivares-Navarrete, J. F. McDonald, Z. Schwartz, B. D. Boyan, T. C. McDevitt, T. Sulchek, J. Biomech. 2014, 47, 2197.
[8] H. Yu, C. Y. Tay, W. S. Leong, S. C. W. Tan, K. Liao, L. P. Tan,
Bio-chem. Biophys. Res. Commun. 2010, 393, 150.
[9] J. M. Maloney, D. Nikova, F. Lautenschläger, E. Clarke, R. Langer, J. Guck, K. J. Van Vliet, Biophys. J. 2010, 99, 2479.
[10] H. Ceylan, S. Kocabey, H. Unal Gulsuner, O. S. Balcik, M. O. Guler, A. B. Tekinay, Biomacromolecules 2014, 15, 2407.
[11] S. I. Stupp, E. Beniash, J. D. Hartgerink, Google Patents (US8124583
B2) 2012.
[12] B. Choi, X. J. Loh, A. Tan, C. K. Loh, E. Ye, M. K. Joo, B. Jeong, in
In-Situ Gelling Polymers, X. J. Loh, Springer, Singapore, 2015, p. 5.
[13] J. Irianto, C. R. Pfeifer, Y. Xia, D. E. Discher, Cell 2016, 165, 1820. [14] S. Kocabey, H. Ceylan, A. B. Tekinay, M. O. Guler, Acta Biomater.
2013, 9, 9075.
[15] N. Guz, M. Dokukin, V. Kalaparthi, I. Sokolov, Biophys. J. 2014, 107, 564.
[16] a) M. Dokukin, N. Guz, R. Gaikwad, C. Woodworth, I. Sokolov, Phys.
Rev. Lett. 2011, 107, 028101; b) I. Sokolov, S. Iyer, V. Subba-Rao,
R. M. Gaikwad, C. D. Woodworth, Appl. Phys. Lett. 2007, 91, 023902. [17] C. c. Formosa-Dague, C. Feuillie, A. Beaussart, S. Derclaye,
S. a. Kucharíková, I. i. Lasa, P. Van Dijck, Y. F. Dufrêne, ACS Nano
2016, 10, 3443.
[18] J. Kim, H. Muramatsu, Nano Lett. 2005, 5, 309.
[19] E. K. Yim, E. M. Darling, K. Kulangara, F. Guilak, K. W. Leong,
Bio-materials 2010, 31, 1299.
[20] Y.-Q. Chen, Y.-S. Liu, Y.-A. Liu, Y.-C. Wu, J. C. Del Álamo, A. Chiou, O. K. Lee, Sci. Rep. 2016, 6, 31547.
[21] E. Takai, K. D. Costa, A. Shaheen, C. T. Hung, X. E. Guo, Ann.
Biomed. Eng. 2005, 33, 963.
[22] Z. Huang, E. R. Nelson, R. L. Smith, S. B. Goodman, Tissue Eng.
2007, 13, 2311.
[23] a) C. Ge, W. P. Cawthorn, Y. Li, G. Zhao, O. A. MacDougald, R. T. Franceschi, J. Cell. Physiol. 2016, 231, 587; b) F. Otto, A. P. Thornell, T. Crompton, A. Denzel, K. C. Gilmour, I. R. Rosewell, G. W. Stamp, R. S. Beddington, S. Mundlos, B. R. Olsen, Cell 1997,
89, 765.
[24] E. Birmingham, G. Niebur, P. McHugh, G. Shaw, F. Barry, L. McNamara, Eur. Cells Mater. 2012, 23, 13.
[25] a) M. Goktas, G. Cinar, I. Orujalipoor, S. Ide, A. B. Tekinay, M. O. Guler, Biomacromolecules 2015, 16, 1247; b) L. Przybyla, J. N. Lakins, V. M. Weaver, Cell Stem Cell 2016, 19, 462; c) A. S. Mao, J.-W. Shin, D. J. Mooney, Biomaterials 2016, 98, 184.
[26] D. W. Weisgerber, S. R. Caliari, B. A. Harley, Biomater. Sci. 2015, 3, 533.
[27] J. E. Aubin, Biochem. Cell Biol. 1998, 76, 899.
[28] a) A. Koroleva, A. Deiwick, A. Nguyen, S. Schlie-Wolter, R. Narayan, P. Timashev, V. Popov, V. Bagratashvili, B. Chichkov, PloS One 2015,
10, e0118164; b) Y. Kang, S. Kim, A. Khademhosseini, Y. Yang, Bio-materials 2011, 32, 6119.
[29] C. Hoemann, H. El-Gabalawy, M. McKee, Pathol. Biol. 2009, 57, 318.
[30] C. A. Gregory, W. G. Gunn, A. Peister, D. J. Prockop, Anal. Biochem.
2004, 329, 77.
[31] J. Domke, M. Radmacher, Langmuir 1998, 14, 3320. [32] T. D. Schmittgen, K. J. Livak, Nat. Protoc. 2008, 3, 1101.