INFLATION DIFFERENCE BETWEEN RICH AND POOR IS INCREASING
Seyfettin Gürsel* and Melike Kökkızıl**Executive Summary
Inflation calculated by Turkish Statistical Institute (TurkStat) captures inflation faced by a representative household since it covers all income and expenditure groups in Turkey. However, inflation faced by households of different income and expenditure groups may differ since different groups consume different baskets of goods and services. In this research brief, different price indices are calculated for each income quintile from the poorest to richest by using consumption data from the Household Budget Surveys (HBS) released by TurkStat for the period 2003-2013. The results indicate that poorer households considerably face higher inflation rates than richer ones in the last six years. The poorest households (the lowest income quintile) face higher inflation levels since price increases in food are above average increase in prices during this period. While the inflation
difference between the top income quintile and the lowest evolved in favor of the poor
householdsfrom 2003 to 2006, inflation difference between the poor and the rich has reached 13 percent pointsagainst the poor households by the end of 2013 due to the global food price shocks. Inflation faced by the poor and the rich is different
Divergence in inflation rates across different socioeconomic groups may be driven by different consumption patterns or by changes in relative prices. Consumption patterns are clearly related to income levels. However, out of necessity, Turkish Statistical Institute (TurkStat) calculates the inflation faced by a representative household for the Consumer Price Index. TurkStat uses a basket of goods and services for the representative household and calculates Consumer Price Index (CPI) by weighting the products in the basket. Consequently, the index captures the inflation of the representative household. On the other hand, price increases in each good and service change considerably over time depending on its relative demand and its cost. Hence, inflation varies across households by their income due to differing consumption baskets of those households.
Starting from mid-2007, energy and food price shocks have changed the relative price structures.1
Inevitably, there have been reflections of these shocks to the relative price structure in Turkey. The effects of the changes in relative price structure on the inflation rates faced by the rich and the poor households in Turkey are important both socially and the politically.
**Prof. Dr. SeyfettinGürsel, Betam, Director, [email protected]
****Melike Kökkızıl, Betam, Research Assistant, [email protected]
1 Box 2 presents detailed information regarding the effects of good and energy price shock on basic consumption products in Turkey.
4th February 2014
Betam has been following inflation rates for different income groups. We published the latest research brief on this issue on the 4th of June 2012. In this research brief, we calculate inflation rates
by different quintiles for the period 2003- 2013 (December) focusing on the last one and half years2.
As households get poorer, inflation rates they face rise
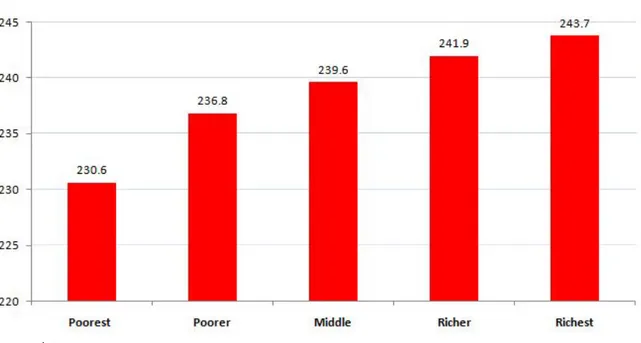
Figure 1 presents inflation indices for each quintile calculated by using the prices indices of each main expenditure item category and the weights of these categories in the consumption baskets of
different income quintiles for December 2013. Findings indicate that price indices increase
considerably from the rich to the poor in Turkey. While the inflation index for the richest 20% (fifth income quintile) is 230.6, the same index is 243.7 for the poorest (first) 20%. In other words, while the average increase in prices for the representative household in the richest 20% is 131 percent in the last decade, it is 144 percent for the representative household in the poorest 20%.
Figure 1 Inflation rates by different income groups (2003=100)
Source: TurkStat; Betam
The inflation rate difference of approximately 13.1 points between the richest and the poorest income quintiles is caused by differences in consumption baskets of the rich and the poor as well differing price increases of these goods and services. While poor households are more likely to spend a much higher proportion of their income on basic needs like food and housing, these items
constitute a smaller proportion of household income for the richest households. On the other hand, households in the richest 20% are more likely to spend more on transportation, clothing and
footwear, entertainment and culture, education, furniture. Hence, higher inflation of expenditures on basic needs implies larger effects of this price increase on the poor.
Dwelling energy and food inflation rates hurt the poor, transportation inflation rate hurt the rich Expenditures on 12 basic goods and services items provided by TurkStat may be examined in order to understand the causes of the inflation differences between the rich and the poor. One can
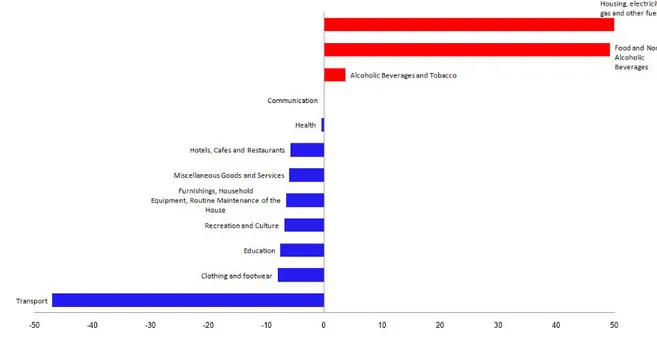
decompose the inflation difference by using weights of goods and services in consumption bundles and the price indices of items. Figure 2 provides the contribution of item category to the total difference of 13.1 percent points between rich and poor.3
2Methodology for the calculation of inflation by different expenditure groups is presented in Box 3.
According to ourresearch brief4, the difference in inflation rates that the rich and the poor face was
11.2 percentage points. In the last one and half years, the difference has evolved further by 1.9 percentage points against poor. In the period from January 2003 to December 2013, housing, water and energy expenditures constitute 38.8 percent of the poor households’ budget and 19.2 percent of the rich households’. The increase in prices of these items has caused a 92.5 point increase in the inflation rate of the households in the lowest income quintile while it has caused a 43.3 point increase in that of the richest group. The difference is 49.3percentage points against the poor.
5Secondly, while food and non-alcoholic beverages correspond to 31.3 percent of the budget of the
poor, it is only 13.5 percent of that of the rich. Thus, inflation difference faced by these two income groupsis 46.4 percentage points against the poor (See Box 1). On the other hand, transport makes up 25.9 percent of the budget of the rich and only 5.7 percent of budget of the poor. Transport had a decreasing effect on the inflation difference between the rich and the poor by working against rich (46.8 points). Note that high price increases in alcoholic beverages and tobacco led to an increase in inflation faced by the poor (5.5 points).
Figure 2 Decomposition of inflation difference by expenditure groups*
Source: TurkStat; Betam
* While red bars show that contributions of expenditure groups working against the poor in the total inflation difference, blue bars show those working against the rich.
4Gürsel, S. and Acar,A. (2012) Inflation is higher for the poor than the rich (Research Brief 12-134).Retrieved from http://betam.bahcesehir.edu.tr/en/archives/1762 .
5Given that the rich and the poor do not consume the same food items, the food inflation will also differ by income levels. However, we think that this inflation difference is more likely to work against the poor. Global food price shock in 2007 had larger effects on basic food items. Needless to say, basic food items constitute a higher proportion in the bundle of the poor compared to the rich. On the other hand, we also expect the rich to consume organic products more and hence would be affected more by their price increases. However, we do not have price data on these products.
Inflation has been working against the poor since 2007
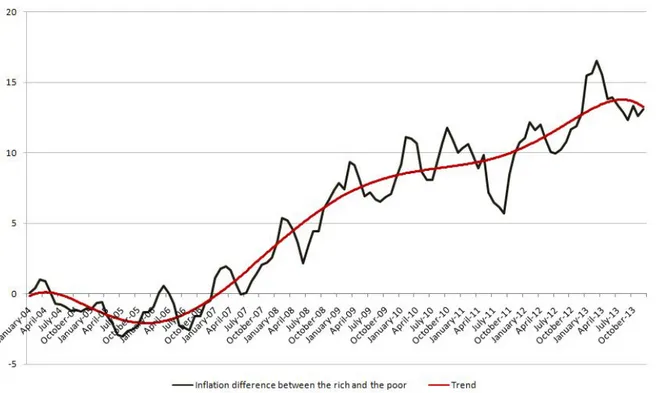
As discussed above, while inflation faced by the poor is more likely to rise with price increases in basic needs (food, housing, energy), inflation faced by the rich is more likely to rise with luxury consumption items (transport, clothing and foot wear, education). One cannot ignore the detrimental effects of the global price increases in food and energy beginning in the second quarter of 2007, on the inflation difference between the rich and the poor. The time trend of this inflation difference between the rich and the poor justify this intuition. Figure 3 present the change of the inflation difference over time. As seen, the inflation difference between the rich and the poor stays relatively small from 2003 to 2006 and is in favor of the lowest income quintile for almost two years. However, the inflation difference has risen consistently since the third quarter of 2005 and the increase has been against the poor. Increase in inflation difference remained stagnant and may have even decreased during the crisis in 2009 due to declining food and energy prices. However, the inflation difference has started to rise again due to price increases in food and especially energy. In May 2012, the inflation difference between the rich and the poor was11.2 points, butit reached its highest levelin March (16.5 points) due to high price increase in food. After March of 2013, relative price changes have partially progressed in favor of the poor and it led to a decrease in inflation difference to 13.1 points for December 2013.
Figure 3 Inflation difference between the rich and the poor
Box 1 Decomposition of Inflation difference between the rich and the poor
We only need the contributions of 12 items to general index in order to understand inflation difference between the rich and poor. Table below shows how we calculate their contributions to inflation difference presented in Figure 2.
Contributions to the inflation faced by the poor Contributions to the inflation faced by the rich Contributions to the inflation difference (1) – (2)
(01) Food and Non-Alcoholic Beverages 78.3 31.9 46.4
(02) Alcoholic Beverages and Tobacco 12.4 6.9 5.5
(03) Clothing and Footwear 7.6 13.6 -6.0
(04) Housing, electricity, gas and other fuels 92.5 43.3 49.3
(05) Furnishings, Household Equipment, Routine Maintenance of the House
10.2 17.0 -6.8
(06) Health 4.0 4.4 -0.5
(07) Transport 14.3 61.1 -46.8
(08) Communication 7.7 7.8 0.0
(09) Recreation and Culture 2.2 10.1 -8.0
(10) Education 1.1 8.7 -7.6
(11) Hotels, Cafes and Restaurants 8.3 14.1 -5.8
(12)Miscellaneous Goods and Services 5.2 11.7 -6.6
Box 2 The evolution of food and energy prices
Since the second quarter of 2007, relative price differences have been increasing rapidly due to food and energy price shocks at the global level.
Choosing 2007 as a base year, we follow the CPI and the price indices of basic needs to shed light on the effects of relative price increases on the divergence of inflation rates between the rich and the poor. As can be seen in the figure below, price increases in dwelling energy (electricity, gas and other fuels) and in food are considerably above average inflation in the years between 2007 and 2013. However, dwelling energy price index has recently moved in parallel with the CPI. Since the price of dwelling energy is closely related to prices of oil and natural gas, and these prices are crucial for the price of transport because oftheir considerable contribution to calculate inflation for rich, it compensates for the inflation difference between poor and rich. Therefore, the increase in food inflation over and above CPI turns out to be the most important factor which determines the inflation difference between the poor and the rich.
Price indexes pertaining to CPI and subgroups of basic needs expenditures (2007=100, 3 month moving average)
Box 3 Methodology for the Calculation of Price Index
We follow TurkStat’s methodology in calculating the price indices for different expenditure groups. Choosing 2003 as a base year and weighting indices of sub-groups by expenditure quintiles, we find a price index for each group. We use weights of expenditure groups released by TurkStat for years between 2003 and 2012. Weights pertaining to 2013 are used for the last 12 months since weights of 2013 have not been released yet. Note that using weights pertaining to 2010 lead to only
marginal bias since the items of bundles barely change over time.
Laspeyres formula used for calculating the price index is presented below: It / IDecember(t-1) =
∑
i =1 12 Iit / Ii December (t-1) x wit It: Index at time tIDecember (t-1):Index at previous December
Iit: Indices for each item. For example i=01, denotes index pertaining to food and non-alcoholic beverages
Wit: Weights
Table below presents general index released by TurkStat, indices of sub-groups and weights used for computation CPI. For instance, using CPI 2012, the computation of CPI for December2013 is as follows:
CPI 01 02 03 04 05 06 07 08 09 10 11 12 2012 December 213.2 220.5 347.4 153.9 257.1 170.0 130.4 206.2 121.0 156.7 211.5 281.1 252.5 2013 December 241.9 383.9 161.4 269.6 180.1 136.8 226. 4 122.4 164.9 232.8 308.8 258.2 Wit 24% 5% 7% 17% 7% 2% 18% 5% 3% 2% 6% 4% Iit / Ii December (t-1) 1.10 1.11 1.05 1.05 1.06 1.05 1.10 1.01 1.05 1.10 1.10 1.02 Iit / Ii December (t-1) x Wit 1.07 0.26 0.06 0.07 0.17 0.08 0.02 0.20 0.05 0.03 0.02 0.07 0.04 CPI (December2013) =
∑
i =1 12 Iit / Ii Aralık (t-1) x Wit(1.07) xIDecember(t-1) (213.2) = 229.0We multiply the sum of the rates (Ii December (t-1) x wit ) with CPI pertaining to December to obtain CPI pertaining to
December 2013.
CPI (December 2013) =