TO 01
A THESIS
Si3foriiitt©d To Tha 0®p®rtm^sit Of Oomm^ti&ir
E n e m e e r s i i g f e d ' ·iB fo r r r s a t
ion S cien cs
id The Instityt©
O f £.ilgil
A, r; .
-i ··. iJ BoiBnmm
tI
fii-f
i· -u*^ 1
w,<>·«
.W V * i .v i <i,.r 2 5«l^ii·•
fi ^
m
In
Partial pylf
O fThe B#c^yir?!^m0r^t·® ■
%
- ·»
For Th^ 0®'C?if^'B O f
IVIastar Of S cisn es
A' ^ ^ -.„-«I S /V'i, /1 t? -««h V ‘ :^ * :· ; v,. ^ ».'f /jj'-i .v^.< ]P\ '.¿ ‘· M sm/ « O *i » 4<r ’w- t >DESIGN AND IMPLEMENTATION OF A TOOL
FOR TEACHING PROGRAMMING
A THESIS
SUBMITTED TO THE DEPARTMENT OF COMPUTER ENGINEERING AND
INFORMATION SCIENCES
AND THE INSTITUTE OF ENGINEERING AND SCIENCES OF BILKENT UNIVERSITY
IN PARTIAL FULFILLMENT OF THE REQUIREMENTS FOR THE DEGREE OF
MASTER OF SCIENCE
By
Mesut Goktepe September 1988
q a
'=К^.6
- τ η
I certify that I have read this thesis and that in my opinion it is fully adequate, in scope and in quality, as a thesis for the degree of Master of Science.
Assoc. Prof. Dr. Bülent Ozgüç (Principal Advisor)
I certify that I have read this thesis and that in my opinion it is fully adequate, in scope and in quality, as a thesis for the degree of Master of Science.
Prof. Dr. Mehmet Baray
I certify that I have read this thesis and that in my opinion it is fully adequate, in scope and in quality, as a thesis for the degree of Master of Science.
Approved for the Institute of Engineering and Sciences:
ABSTRACT
D E S IG N A N D IM P L E M E N T A T IO N O F A T O O L F O R T E A C H IN G P R O G R A M M IN G
M esut Göktepe
M .S . in Computer Engineering and Information Sciences
Supervisor: Assoc. Prof. Dr. Bülent Özgüç September 1988
In this thesis, a survey on computer applications for teaching program ming and some graphical programming tools together with their underlying environments has been carried out and a graphical Pascal teaching tool is designed and implemented.
Graphical programming tools provide the user the ability to solve the problems through the use of icons and symbols allowing very little text. Here, a Pascal teaching tool is presented in a very user friendly environment to teach programming through the use of flowcharts in a visual manner.
Keywords: graphical programming, user interface, window manager
ÖZET
b i l g i s a y a r p r o g r a m l a m a E Ğ İT İM İ İÇ İN B İR
Y A Z IL IM
Mesut Göktepe
Bilgisayar Mühendisliği ve Enformatik Bilimleri Yüksek Lisans Tez Yöneticisi: Assoc. Prof. Dr. Bülent Özgüç
Eylül 1988
Bu tezde bilgisayar programlama öğretimi için uygulamalar, bazı grafiksel programlama sistemleri ve uygulandığı ortamlar araştırılmış, ve grafiksel bir Pascal programlama öğretim sistemi tasarlanıp uygulaması yapılmıştır.
Grafiksel programlama sistemleri kullanıcıya imge ve semboller yoluyla çok az yazı kullanarak problem çözme olasılığı sağlar. Burada, bir Pascal programlama sistemi dost bir etkileşim ortamı içinde akış diagramları kulla narak görsel olarak programlamayı öğretmek amacıyla sunulmuştur.
Anahtar kelimeler: grafiksel programlama, etkileşim sistemleri, pencere yönetim sistemi
ACKNOWLEDGEMENT
I would like to acknowledge first the help and cooperation of my supervi sors Assoc. Prof. Dr. Bülent Özgüç and Prof. Dr. Mehmet Baray without whom this work could not have been completed. I would like to thank Ahmet Coşar, Aydın Kaya, and Murat Karaorman for their patient suggestions and comments. I also wish to thank Emine Oskargil for her moral support during the preparation of this thesis. Attila Gürsoy and Özgür Ulusoy have also been very helpful by their remarks and suggestions.
TABLE OF C O N TEN TS
1 IN T R O D U C T IO N 1
1.1 Computer Based Teaching For P rog ra m m in g... 2
1.2 Graphical Programming vs. Textual P rogram m ing... 3
1.3 Survey of Graphical P rog ra m m in g... 5
1.3.1 Systems that are Based on Conventional Programming Languages... 5
1.3.2 Systems Implementing Programming Languages which axe Completely New and Based Completely on Graph ics (with very little t e x t)... 8
1.4 Some Graphical Programming Systems... 9
1.4.1 P E C A N ... 9
1.4.2 Icon L isp... 10
1.4.3 P I C T ... 11
1.4.4 Hi V isu a l... 13
1.4.5 ’ A Tool for Teaching Programming’ ... 14
2 U N D E R L Y IN G ELEM ENTS A N D E N V IR O N M E N T FOR T H E D ESIG N A N D IM P LE M E N TA TIO N OF A TOOL FOR T E A C H IN G P R O G R A M M IN G 17 2.1 User Interface... 17
2.2 Object Oriented A pproach... 19
2.3 E n v iron m en t... 21
2.4 Tools For User In terfa ce... 22
2.5 A Notification Based S y s t e m ... 24
2.5.1 The Notifier... 24
2.5.2 Relationships Between the Notifier, Objects, and the A pp lica tion ... 27
3 D ESIG N OF A TOOL FOR T E A C H IN G P R O G R A M M IN G 28 3.1 Naming Conventions... 28
3.2 Screen Design of the T o o l ... 28
3.3 Other Screen Layout Elements Displayed by Flowchart Han dling O p era tion s... 31
3.4 Items of the Flowchart M e n u ... 34
3.4.1 Flowchart s y m b o ls ... 34
3.4.2 Flowchart Handling O perations... 35
3.5 Flowchart Design M eth od olog ies... 37
4 IM P L E M E N T A T IO N OF A TOOL FOR T E A C H IN G PRO G R A M M IN G 42 4.1 Data Structures... 42
4.2 Basic Routines Used for Implementation... 46
4.3 Low Level Operation Of The Tool ... 52
4.3.1 Code Generation in Low L e v e l ... 53
4.3.2 Code Execution in Low L e v e l... 53
5 C O N C L U SIO N 57
A U S E R ’S M A N U A L 59
A .l Generation of a Flow chart... 59
A. 1.1 Creating a New Flowchart... 59
A. 1.2 Editing a F lo w ch a rt... 63
A. 1.3 Redisplaying a F lo w ch a rt... 66
A. 1.4 Saving a Flowchart to a File on the D isk... 66
A .1.5 Loading a Flowchart from a File on the D i s k ... 66
A. 1.6 Erasing a Flowchart from the S creen ... 67
A.2 Code G en era tion ... 67
A.2.1 Creating the Flowchart for Main Body of a Program . 67 A .2.2 Creating Flowcharts for Subprograms of a Program . 67 A.2.3 Generating the Pascal Code Corresponding to a Flowchart 71 A.3 Execution of the Pascal Code for a Flow chart... 77
A.3.1 Stepwise Execution of the C o d e ... 79
A .3.2 At Each Step Highlighting the Corresponding Flowchart B o x ... 81
A.3.3 At Each Step Displaying the Values of Simple Vari ables of the Currently Executing R o u t in e ... 85
A.4 Leaving the T o o l ... 85
LIST OF FIGURES
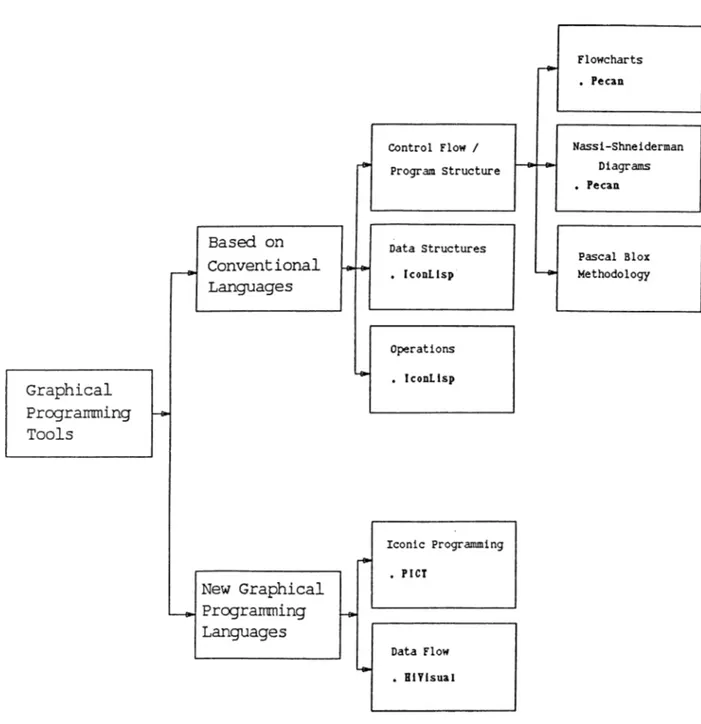
1.1 Hierarchical classification of graphical programming tools. . . 6
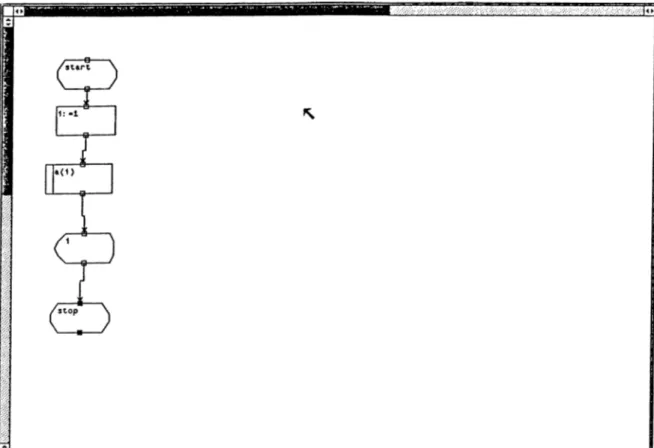
1.2 A snapshot of the screen... 14
2.1 Class hierarchy of a window manager system... 23
2.2 Control structure of a notifier based system... 26
3.1 Screen layout of the tool... 29
3.2 Flowchart drawing area... 30
3.3 Flowchart menu... 30
3.4 Panels... 31
3.5 Text edit window... 32
3.6 File name window... 32
3.7 Scale window... 32
3.8 Declaration window... 33
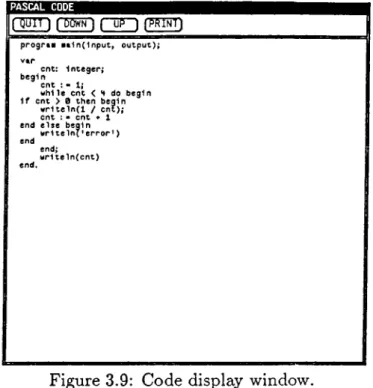
3.9 Code display window... 33
3.10 Step window... 34
3.11 Connection of arcs... 38
3.12 if-then-else... 38
3.13 while-do...■... 38
3.14 repeat-until... 39 3.15 for... 39 3.16 staxt/stop/procedure-staxt/return... 40 3.17 subroutine call... 40 3.18 ou tp u t/d isp la y... 40 3.19 process... 40 3.20 disk i / o ... 40
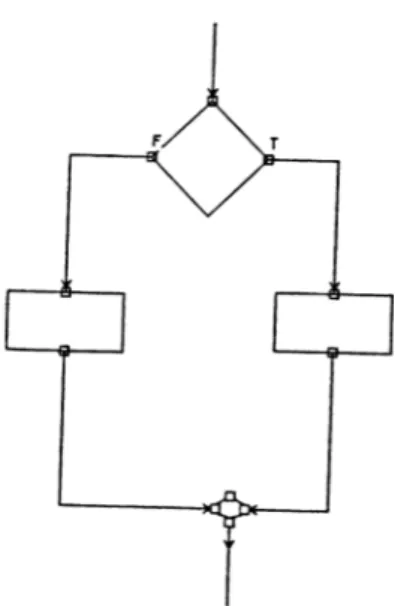
3.21 Only one entry and one exit point... 41
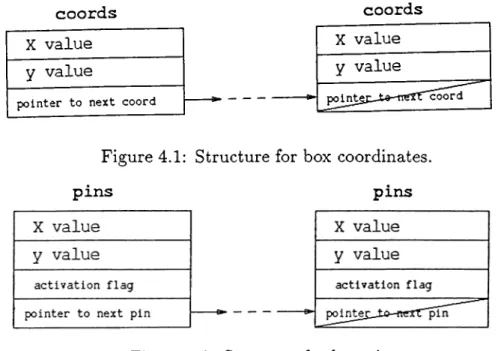
4.1 Structure for box coordinates... 43
4.2 Structure for box pins... 43
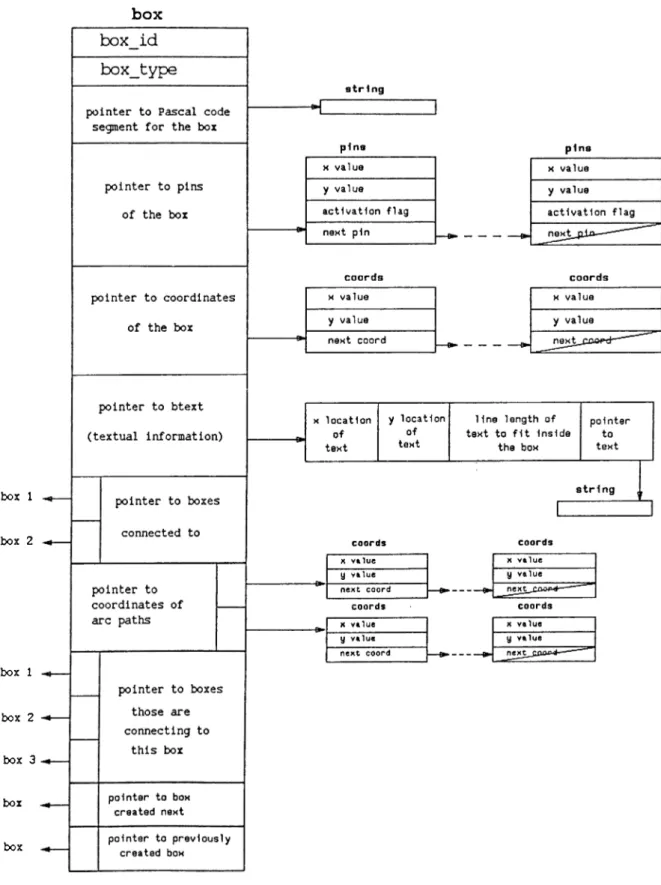
4.3 Box structure... 44
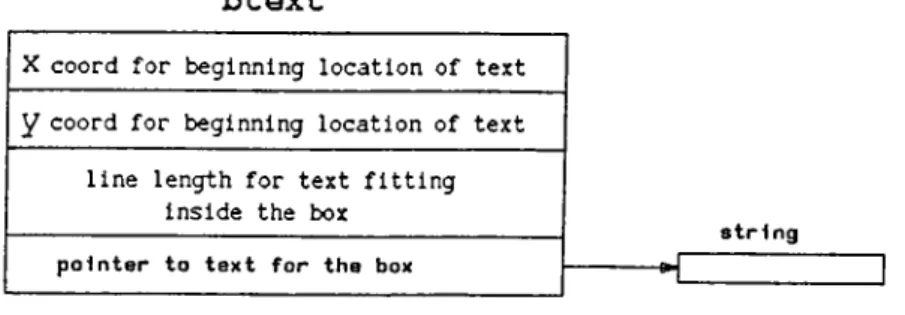
4.4 Text structure... 45
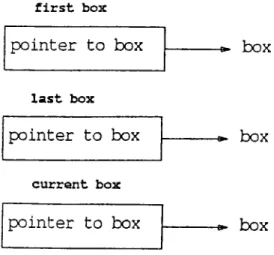
4.5 Box pointers... 46
4.6 Array of sub-flowcharts ... 47
4.7 Flowchart stack... 47
4.8 Low Level Operation of the Tool... 54
A .l Picking and placing boxes... 60
A.2 Filling in the boxes... 61
A.3 Connection of boxes... 62
A.4 Moving a box... 64
A.5 Scaling a box... 65
A.6 Main flowchart... 68
A.8 Generating the Pascal code... 72
A .9 A file name for the Pascal source code... 73
A .10 Declaring data types in the main b o d y ... 74
A. 11 Declaring data types in the main b o d y ... 75
A. 12 Declaring data types of the sub-flowchart of the previous figure. 76 A .13 Displaying the Pascal source code... 78
A. 14 Execution of the code... 79
A .15 Erroneous code and error messages... 80
A.16 ’ STEP’ping... 81
A. 17 End of ’STEP’ping while printing values of simple variables. . 82
A .18 ’STEP’ping in a main flowchart... 83
1. IN T R O D U C T IO N
Since the beginning of Computer Science, the main trend on the development of systems has been in the direction of how computer systems can be designed to accommodate the user needs in an easy, fast, and the most natural fashion. The most common approach concerning the human-computer interaction has been in the field of programming languages. Many programming languages are developed to build better user interfaces to simplify the computer use, teach computer programming and increase the programmer productivity.
As the problem domain to be solved on the computer increases, inade quacies of common sequential, procedural, text based programming languages arise. A radical departure from current programming styles becomes a ne cessity. In order to make the programming more accessible, new, improved programming languages have been created with the capabilities of handling specific types of problems. For example, object oriented languages deal with the problem with objects and various actions that can be performed on that object. Generally common programming languages and environments are quite difficult to use because they are not friendly and very adaptable to users, especially for ones new in computer programming. This lack of adap tation exists both at the representation level -in the graphical layout seen by the user- and at the conceptual level -in the computational model-. Graphi cal programming systems based on interactive computer graphics have been working on the former problem. Research in the functional programming (Lisp) and logic progreimming (Prolog) environments have been attempting to find remedies for the latter problem. Artificial Intelligence research has been doing extreme work on techniques for communicating with computer in a natural language. Currently, a great deal of work on expert systems has been attempting to simplify the humein-computer interaction by making deductions within the given application domains. Graphical programming systems are the most user friendly tools for programming environments, es pecially ones used for teaching progreunming.
In the following sections, topics related to computer based teaching for ’programming’ and major systems which support programming with graphics are surveyed to exemplify the various approaches of graphical programming. Then follows the discussion of our ’Pascal teaching tool’ in comparison with the related systems to explain the matter in detail. Finally, a particular at tention is paid to ’Design and Implementation of a tool for teaching program ming’ describing its usage, components, user interface, higher programming constructs applied, implementation environment, and low level implementa tion details. A list of its unimplemented features are given at the end.
1.1
Computer Based Teaching For Programming
The way one is to follow for programming with a classical textual language goes through a number of steps. Once the problem to be solved by a computer is ancilyzed in detail, the most important step, selection of an algorithm and derivation of the flowchart for the algorithm comes next. These steps may lead to an efficient and correct program for solving the problem. An algorithm gives the logical steps of a program in textual form so that a program can be generated from it. The flowchart presents the same information graphically. The structure of a program is derived by dividing the problem into logically complete blocks - subproblems- and analyzing each separately. After defining the structure, the code for the program can be written easily, ideally through a structured language. Now comes the time for running the program and weiiting for the results. If the results seem incorrect, it is required to figure out where the ’bugs’ are , then modify the program and rerun again.
Pascal facilitates writing structured programs, programs that are rela tively easy to read, understand, manipulate, and maintain. It is currently one of the most widely used language for teaching programming. Its popu larity is due to the fact that the syntax is relatively easy to learn.
The goal of structured programming is to organize and discipline the program design and coding process in order to prevent most logic errors and to detect ones that remain. Structured programming concentrates on one of the most error-prone factors of programming, the logic. It has three major characteristics: top-down design, modular programming, structured coding.
In top-down design, first the program is specified in the broadest outline and then, the structure is gradually refined to fill in the details. In each step
a given task is broken down into a number of subtasks until the subtasks are simple enough to be coded with a highly reliable process of programming. Modular progrzimming is the process of dividing a program into logical parts called modules and then successively programming each part. Here, size of the modules must not be too large and each module must be independent from others. Structured coding is a method of writing programs with a high degree of structure providing for understandable programs for testing, maintenance and manipulation. Any proper program -a program with one entry and one exit point and no infinite loops or unreachable code- can be accomplished only by the logic structures of sequence of two or more operations, selection of one or two operations, and iteration of an operation while a condition is true.
Pascal is a structured language facilitating the mentioned characteristics of structured programming. It has BEGIN-END blocks, PROCEDURES, and FUNCTIONS providing constructs for modular programming. Pascal executes the code from top to bottom in sequence, enabling the sequential processing. REPEAT-UNTIL, WHILE-DO, and FOR statements allow iter ation over a number of operations. IF-THEN-ELSE, and CASE statements facilitate a selection mechanism for structured programming [9].
This is the way how one commonly programs the computer through a tex tual language. The use of pictures in programming is also another method ology for programming which differs from the classical textual programming.
A sketch of the graphical approach for programming can be outlined as follows: First, selection of images that visually represent the data structures and variables needed. Next, drawing the desired algorithm as a logically structured, multidimensional picture. Last, watching the program run and the results being generated. If the program is not doing what is expected, identifying where and when the error(s) occur, visually.
1.2
Graphical Programming vs. Textual Programming
In general, programming environments can be classified as textual -Pascal, Cobol, Lisp etc.- and graphical, graphiccil environments can further being divided as visual or iconic, according to the degree to which they employ text cis opposed to graphics. These categories are not disjoint, however.
useful tools in the computational environment are :
• First, images provide a natural supplement to other means of commu nication. People gather information at a higher rate by discovering graphical relationships in pictures than by reading ordinary text.
• Images are often easily learned, retcuned, and recalled as single units of information, since the human mind is strongly visually oriented.
• Images may possess a universality that natural languages and their associated programming languages do not. For example, standardized signs in many applications can be understood by people who speak many languages, such as traffic signs.
• The rapidly falling cost of graphics-related hardware with their increas ing performance show that images are becoming more and more suitable for human-machine communication.
• When one programs in a textual language, one is forced to learn its syntax. On the other hand in programming with graphics, pictures keep associated syntax and semantic rules allowing them to represent language elements.
• Text can be thought of as a one dimensional stream of characters [14]. Indentation and bold-facing of keywords are often applied in text to help making text multi-dimensional. Pictures, on the other hand, in herently provide two or three dimensions. In addition, other properties of pictures such as shape, size, color, texture, direction, etc. provide further information.
• Pictures are used to illustrate abstract ideas and make them simple to think about. All well-drawn pictures provide good metaphors, using text alone forces the reader to come up with his own mental image.
While all of the above are certainly advantages of graphical programming, there axe some disadvantages. One can eu'gue, for example, that eis a pro gramming language becomes more friendly and easy to use, it also becomes more specialized and its domain decreases [15]. As the level of program ming increases, the domain for which programs can be written decreases. For example, in a menu based system, the user has very few options (limited domain) but it is certainly very easy to use.
1.3
Survey of Graphical Programming
Graphical progreimming can be defined as any kind of visual interaction be tween a computer and a human in order to complete some programming tcisk. This interaction, however, does not only involve manipulation of text or programs written in a linear string of characters, but rather, of pictures or symbols of two- dimensional objects such as graphs, maps, flowcharts, etc. Thus, two-dimensional picture or pictures are used to represent the program.
Recently, many graphical tools have been developed to provide the pro grammer and the user the ability to solve the problems through the use of icons and symbols allowing a little text.
In reality, the divisions among the various tools are not as discrete as Fig ure 1.1 indicates. In general, the various systems that implement a graphical programming environment can be divided into two major groups:
1.3.1
Systems that are Based on Conventional Pro
gramming Languages
These tools implement a graphical programming ’layer’ on top of conven tional programming languages like Pascal or Lisp. So, underlying graphics environment is a textual programming language. The visibility of this textual language to the user depends on the particular tool. Some tools merely offer graphics as another way to view a fundamentally textual program. Other tools give more flexibility to the user by allowing him/her to completely cre ate and debug a program graphically. The tools which are based on conven tional programming languages can be further subdivided into the following categories:
Tools which Show Control Flow/Program Structure Graphically
• ’Flowcharts’
The most common method of showing control flow of a program is by a flowchart. Flowcharts were originally developed as a tool for assembly language programming, which allows completely unstructured control transfers. While flowcharts do allow a graphical representation of the control mechanism, the disciplined control constructs, scoping, and data
structures of present-day programming languages render them obsolete aa a graphical programming tool. Even with such features though, flowchcurts cannot be used to display data structures of programs. They also need to be modified to allow common control constructs such as for loops, while loops, repeat/until loops, etc. Also the diagr<mis still axe mostly text.
• ’Nassi-Shneiderman diagrams’
Nassi-Shneiderman diagrams allow the structure of a program to be displayed graphically. These types of diagrams when combined with syntax-directed editors provide a systematic (top-down) method for building programs. While these types of programs are useful for show ing program structure, they do not show expressions, procedure calls, types, and data graphically. The diagrams still are mostly text.
• ’Pascal Blox Methodology’
The Pascal Blox Methodology [16] developed by Glinert represents pro gram structure by using ’jigsaw’-like blocks in an interconnected fash ion. Each jigsaw piece represents a particular construct in the language. The pieces axe designed in such a way that the only way to combine the various types of structures is according to the syntax rules of the language. Thus, the user creates entire program in a manner analogous to constructing jigsaw puzzles.
Systems which Show the Data Structures in the Language Graph ically
Surprisingly, there has been very little work on ways to display data struc tures graphically. One of the reasons for this is that data is usually very complex compared to control flow. Another reason for this is that data is often represented at many different levels of abstraction. Thus, it is difficult for the computer to determine what exactly a given data structure repre sents. For example, a graph may be represented by an adjacency matrix. But, unless told explicitly, the computer has no idea that the adjacency ma trix represents a graph. For this reason, it can not represent this information graphicedly.
Tools which Show the Actual Operations in the Language Graphi cally
IconLisp, in addition to representing data structures graphically, allows the actual operations to be performed graphically. So, the user uses a mouse attached to the computer to ’drag’ an icon of an input list on top of an icon of a function. The computer computes the output list and represents the list by creating a new icon for the output list. Thus, the actual operation of applying a function to some input is done graphically. Again, this is simple in the case of Lisp because of the functional nature of the language. Such a technique would be difficult with Pascal since the language is procedural.
All of the tools described above are based on conventional programming languages like Pascal and Lisp.
1.3.2
Systems Implementing Programming Languages
which are Completely New and Based Completely
on Graphics (with very little text)
’Iconic Programming’
Some tools allow complete programs to be written by symbols called Icons. By putting these icons together, a runnable program is created. Once the program is created, it can be run directly without being converted to another textual language. The method of creating programs is so free of text that according to the creators the keyboard is never used! However, even though this may seem nice at first, one can imagine how cumbersome the process of creating programs may get if the mouse is used for everything.
’Data Flow Languages’
In a dataflow graph, the flow of data and control coincide. These languages allow the user to create dataflow graphs on the screen and then specify inputs which are fed to this graph to produce a set of outputs. An advantage of these types of languages is that they are well suited for program animation. The user can watch the ’dataflow’ from one module to another. The simple structure of dataflow graphs encourages modular design and can be used at
all levels of system description. Such diagrams are also useful in identifying potentieJ units which can be executed in parallel. However, one problem this scheme shares with flowcharts is that the lack of high level control constructs usually lead to messy diagrams.
1.4
Some Graphical Programming Systems
1.4.1
P E C A N
The PECAN [17] family of programs are program development systems devel oped at Brown University. PECAN provides users with a rich programming and run-time environment that allows graphical views of the user program, its semantics, and its execution. In PECAN, for example, users for the most part indicate the sequence of actions they wish to perform by pointing with a mouse to entries in fixed or pop-up menus. The built-in editor recognizes Pascal syntaoc and thus can immediately highlight erroneous statements. At run-time, users can follow the computer’s progress through the program with each statement being highlighted as it is executed. The system was devel oped to run on APOLLO workstations. The main objective of the system is to provide a graphical programming environment for the novice and expe rienced programmers. PECAN contains many of the best features of other similar systems. These include:
• immediate feedback of syntax and semantic errors while the user is editing the source program (syntax-directed editor), •
• an undo facility whereby the user can undo and redo any action back to the beginning of the session,
• structured templates for building the program,
• the flexibility to type text at any time instead of using templates,
• the use of on-screen and pop-up menus as an alternative to typing most commands,
• a multiple window display to make effective use of the screen,
• incremental semantics that allows the program to be compiled eis it is edited,
• a framework that handles a variety of (algebraic) programming lan guages with the same commemds.
The PECAN system differs from other program development systems in its use of multiple views of user programs. One such view is a syntax-directed editor. This view displays the user program with a format for automatic indentation and boldfacing of Pascal keywords. Another view displays the program as a Nassi- Shneiderman diagram. A third view shows a module inter-connection diagram showing how the program is organized. Others are control flow diagram, expression tree etc. Those several views may be displayed simultaneously, each in its own window.
In addition to the different program views, PECAN allows the user pro gram to be compiled incrementally. The user can also view the symbol tables, data types, expression trees, and the control-flow graph of the program in separate windows.
According to the classification discussed earlier, PECAN fits into the cat egory of programming environments which are based on conventional pro gramming languages. This is due to the fact that the entire system is bcised on Pascal. In general, PECAN is a complete development system for Pascal programs. Actually, the system is modular enough to allow other languages to be supported. One of the drawbacks of the system, though, is that the actual data structures cannot be rendered graphically. Also, the user can not create the program graphically; he/she must create the textual Pascal program first, and then may choose to view it in different ways.
1.4.2
IconLisp
IconLisp [18] is a system designed to offer an iconic extension to the standard programming in Lisp. The system consists of a row of pull-down menus, a palette of tools on the lefthand side of the screen, and a working space which occupies the rest of the screen. The user with an input device such £is a mouse can then use the menus and palette of tools to create lists and thus create programs (lists and programs are the same thing in Lisp). The IconLisp system was still in the design phase and thus had not been actually implemented on a computer. Nevertheless, the designed version of the system will be used to talk about its capabilities.
The user clicks on and drags objects on the screen to create and modify lists. For example, once an initial list is created, the user selects the list and clicks on the CDR icon in the palette area to produce the CDR (all except the first part) of the list. This action produces a new icon on the screen which contains the CDR of the list and which can be used in a further computation.
In order to implement iconic programming, the IconLisp system, for each list (function), keeps track of three components: the physical component, the logical component, and the name. The physical component is the actual picture/icon to represent the list. The logical component is the actual text of the list. The name component is used to label the icon and is normally the same as the function neune. By using these three components, users can create arbitrary functions and assign icons to them. With these icons, the user can execute programs by creating the data lists and then dragging them on top of the appropriate function icons in the user workspace. Also different buttons on the mouse represent different actions. The first mouse button selects a function/list and opens a window which contains its textual definition. The second mouse button evaluates (calls the EVAL function in Lisp) the selected list.
The IconLisp system can be classified among those systems which are based on conventional programming languages, in this case Lisp. The system not only allows programs to be displayed graphically, but the data structures are also displayed graphically. Even the operations are done by graphical manipulation. Of course, this is very simple to do because of the functional nature of Lisp. Also, since programs and data
axe
in the same format (lists) in Lisp, graphic representation is very easy. The IconLisp system is nice in that programs, data structures, and operations are all represented graphically. However, underlying this graphic layer, the user still needs to deal with the text of the Lisp functions and data. Also the system is nice in design but has not been actually implemented to demonstrate the practicality of such an approach.1.4.3
P IC T
PICT [19] is a system developed by Glinert and Tanimoto at the University of Washington. The system was primarily designed to aid in program imple mentation rather than algorithm design and selection. The system, however, does not allow general programming, it serves as an experimental prototype
capable of supporting small, but nontrivial programs.
Each of the systems previously described provide many of the features which axe important to graphical programming. However, all of them suffer from the following two problems:
• users have to use one of the standard programming languages to code their programs, and
• the display is monochrome; color graphics is not used. PICT solves these two problems.
The PICT system provides a new type of algorithmic programming envi ronment in which computer graphics plays a centred role. With PICT, users do not write computer programs using letters, digits, and punctuation marks; in fact, users never use the keyboard. The user uses the mouse and a color display terminal to create his/her program. The program creation is not free form, but rather like constructing jigsaw puzzles. Graphics, color, sound, and animation are used to make the program appear as multidimensional and concrete as possible. With the PICT system, programs, subprograms, peirameters, data structures, variables and program operations are all repre sented by icons of various sorts. The control structure is represented by paths that are followed by the system to show the current execution stage. Also, the syntax of the user’s program is checked continuously during program con struction, thus eliminating the need for syntax checking before executing the program.
PICT provides all tools users need to compose, edit, and run their pro grams integrated within a simple, consistent command structure. Users com municate with the PICT system by pointing to icons in a menu tree; PICT responds by altering its display in an appropriate manner or, if the user has made an error, by displaying a help message.
Unlike PECAN, PICT is not based on a textual language. The language is completely iconic and needs no text information at all. Thus, in the classifica tion scheme, PICT falls in the category of tools which implement completely new and graphical programming languages. Specifically, PICT is em example of an iconic programming language.
PICT has the advantage over other systems in that it is completely graph ical. In fact, one can even claim it is too graphical. According to a survey
conducted by the developers, many experienced programmers thought that such a system would be too cumbersome to work with. On the other hand, most beginners rezdly appreciated using the system and actually enjoyed us ing the system to create programs.
1.4.4
HiVisual
Hi Visual (Hiroshima Visual) [20] is a graphical programming system devel oped at the Hiroshima University in Japan. In HiVisual, programming is carried out by simply arranging icons on the screen. The system features icon-based programming, visualization of data flow, interactive programming capability, and animation of program execution.
HiVisual, like PICT, supports iconic programming. In PICT, however, the control of program flow is visually specified on the basis of its flowchart like representation. In contrast, the representation of programs in HiVisual is based essentially on the flow of data. Icons are regarded as functional modules which have inputs and outputs, and the program is constructed by specifying the connection between the inputs and outputs of the various function icons. In order to display different levels of abstraction, the actual definition of a module may be hidden from the user.
In addition, HiVisual provides an interactive programming environment in the following way: When the user selects an icon and puts it at a suitable place on the display, the system activates the icon to execute the associated function and returns an iconic representation of the resultant data. This icon is displayed next to the activated icon. After this, programming proceeds by referring to the output and connecting another icon to it. Once a program is completed, the progreim itself can be defined as a new icon and be used later to make a higher level program.
HiVisual also allows simple data types such as records to be displayed graphically. Although text is used to display the individual fields, the fact that the structure of the data is displayed graphically can be helpful. HiVi sual, like PICT, is not based on any conventional textual language. So, in the classification scheme, it falls in the category of tools that implement com pletely new graphiccil programming languages. Unlike PICT, it uses the data flow model to display programs graphically. Because it uses the data flow diagrams, HiVisual shares the advantages and disadvantages of this diagram ming method: although data can be represented graphically, control flow is
not obvious from the diagram.
1.4.5
’A Tool for Teaching Programming’
Our programming teaching system implements a graphical programming layer on top of the Pascal programming language. The tool is primarily meant to be used as a learning aid to students new to the Pascal language, but can also be used as an aid to write PASCAL programs in a top-down, graphical fashion using flowchart symbols.
The tool provides the user with a means to draw a program’s flowchart in a window through a menu of icons and commands, then displays the cor responding Pascal code of the flowchart through the directives from the user with the help of a pointing device, a mouse. A snapshot of the screen while the tool is running is shown in Figure 1.2.
Flowchart elements are picked from a menu containing flowchart symbols eis icons and axe drawn on the graphic screen. The text information of each symbol is filled in by selection of a text entry command from the menu.
A text window can display the Pciscal code corresponding to a flowchart in a graphics window. A single menu contains both the flowchart symbols and commands to operate on a flowchcirt as well as to accomplish the task of Pascal code generation and execution. Although explicit editing of the Pascal code that is generated from a flowchart is not permitted, editing of the flowchart itself is possible by means of appropriate commands. Therefore, each flowchart symbol on the screen can be identified for further operations. Once a flowchart is edited, the corresponding Pascal code also changes ac cordingly.
Both the graphic portion of the screen (which is the window containing the flowchart) and the text portion (which is the window containing the Pascal code) are scrollable. Therefore, the whole Pascal code corresponding to the flowchart can be displayed part by part by scrolling. This is true for the flowchart itself as well. Exit from the tool is provided by means of a button on the panel of the window in which the flowchart resides.
Once the code is generated, it can be executed step by step, as if using a debugger. During stepwise execution, values of the simple variables concerned are displayed and related flowchart elements of the code are highlighted.
Our teaching tool for programming fits into the category of programming environments which are based on conventional programming languages. This is because, the tool is based on a strategy for teaching Paiscal programming through flowcharts [21]. A general comparison of the tool with the existing systems can be listed as:
• The tool is a flowchart based system for teaching Peiscal programming.
• Both graphics and text involve in the tool. That is, in spite of graphical representation of programs through flowcharts, the user still needs to deal with the text of the flowchart boxes.
• Graphiczd part of the tool represents only the control flow of programs, since it applies flowcharts. •
• The actual data structures can not be rendered graphically. They are entered to the program by the user through a declaration window by
typing in the identifiers of listed data types of Pascal, during the code generation.
• The tool applies a restricted domain of Pascal language, e.g., it does not support ’go to’ statement, and Pascal ’Functions’ .
• During the execution of the tool multiple windows and on-screen/pop_up selection mechanisms are applied for effective use of screen and simplic ity for users.
In order to satisfy user needs in a simple way, we have to present the application in such a friendly manner that the user need not spend too much time in learning the system itself, but instead play with it while learning programming in Pascal. This is accomplished best by means of user-friendly tools.
2.
U N D E R L Y IN G ELEM ENTS A N D
E N V IR O N M E N T FOR THE D ESIG N A N D
IM PLE M EN TA TIO N OF A TOOL FOR
T E A C H IN G P R O G R A M M IN G
2.1
User Interface
As sophistication of computer systems increase with technology, the require ment for computers to remain friendly, comprehensible, and effective to con tinue to appeal to users also increases. A crucial factor in all three of these attributes is the quality of communication between the user and the machine.
User interface is the part of a program that determines how the user and the computer communicate. The design of interactive user interfaces is very important for the performance of the application. Not only are bad user interfaces difficult to learn, but they make programs difficult to use even in the hands of experienced users. For the naive user, graphical interfaces have been introduced that represent a significant improvement over traditional command languages as a means of realizing the full potential of a computer. As ein example, iconic interfaces present command and system information in a nonverbal manner i.e., in the form of icons by which the learning curve can be reduced in both time and effort. Thus, it improves user performance while reducing errors. The reason for upgrading the user interface and thus per formance in this manner follows the argument that communicating through images is the most natureJ way of communication. Furthermore, images Ccin be easily recognized and learned, and thus may be better than their lexical equivalents [1].
Generally, any graphical user interface is composed of two parts, the pre sentation part and the interaction part. The presentation or layout part
defines what pictures are on the screen i.e., placing graphics and images on various parts of the screen. The interactions or behaviour part determines how these pictures change with user actions i.e., transforming an object on the screen. Models of user interface can be considered to fall into two broad categories : linguistic models, and spatial models. Linguistic models view the interface as a dialogue between user and computer, and focus on issues that occur within the syntax, semantic, and lexical levels of the dialogue. Spatial models include interactive graphics or direct manipulation models. A well designed user interface normally incorporates both linguistic and spatial components [2].
User interface components [3] naturally can be grouped into four :
• User’s Model
This is a conceptual model acting as a framework for the development of strategies for operating the program. It enables the user to have a broad understanding of what the program is doing. The use of familiar concepts makes the user’s model more intuitive and easier to learn. It is difficult to gain acceptance for a program that presents the user with unfamiliar objects that behave in highly unexpected ways.
• Command Language
Once the model is understood by the user, user needs commands to manipulate it, a system of which forms a command language. Principal issues of command languages are command modes, selection sequence, a command abort mechanism and error handling. Command modes are the states in which a given operation by the user is interpreted differently by the program. Selection sequence is the order to manip ulate a command. Command abort mechanism is necessaxy to disable a currently working command. An error handling mechanism is how a program must respond to incorrect input.
• Feedback
Feedback is a component of the user interface through which the com puter assists the user in operating the program. Some forms of feedback are provided only for naive users, and ignored by experienced users. Ac knowledgement of reception of commands, explanatory messages, indi cation of selected objects, echoing of typed cheuracters axe some forms of feedback that help the user to be informed about the correct receipt of his commands.
• Information Display
This component shows the user the state of the information he is ma nipulating. By means of well chosen symbols and graphics, the user can be given confirmation that his model is correct. For a more effective utilization of the screen for information display, the way menus, win dows, informative icons or graphics Eire handled, together with selection mechanisms, must be taken care of properly. A device independent user interface that functions with a wide variety of devices is the most fea sible design issue for a user interface, since it provides for applications to be portable from one hardware configuration to another. On the other hand, such a design is quite difficult and the results might not be equally satisfactory for all classes of devices.
2.2
Object Oriented Approach
During the implementation phase of our Pascal teaching tool the object ori ented programming paradigm is made use of.
The object paradigm provides a natural mechemism for representing a system at several levels of abstractions from a very low level concept, such as a number, to a very high level concept, such as an office information system. Graphical applications, data base applications, and user interface designs are the main areas where object oriented programming techniques have been widely used recently. The innovative work of Kay and Goldberg at Xerox corporation in developing objects for the Smalltalk language obviously contributed much towards the advancement of these techniques [11,12,13]. A few other languages have such capabilities. Objects in C are a recent addition that this project makes use of mostly as an extension to the toolkit on which the code is built [5].
Object oriented programming differs from the traditional control oriented programming in that all conceptual entities are modelled with a single con cept, an object. An object is an entity with attributes and having relation ships with other objects.
Temperature range, size, danger level, color can be the attributes of an object representing a temperature gauge. The identity of an alarm object could be the value of a relationship. Methods are a kind of procedure in which the behaviour of zm object is embodied. The method for a temperature
gauge could be the display of a temperature dial by graphics routines.
A message is the specification of an operation to be performed on an object, similzu: to a procedure call. Messages provide for objects to commu nicate with other objects to request information or some form of behaviour from them, for exaimple a temperature gauge can be requested to display itself by messages from other objects. A method for an object is a function that implements the response when a message is sent to that object. An object reacts to a message by executing its corresponding method, which is a piece of code manipulating or returning the state of the object.
Objects can be represented in a class hierarchy inheriting properties down the hierarchy. Therefore different classes of objects can be defined, each ob ject being an instance of a class. A class describes the form of its insteinces and operations applicable to its instances. Objects of the similar type axe grouped into the same class. An object differs from other instances of the same class by the values of its attributes and relationships, but all the instances do have the same methods of the class. Lower down the class hierarchy, a class can also have subclasses as well as objects (instances of the class). All subclasses of a class inherit the properties of its superclass and additionally have its local properties [6,7].
An object oriented system for the construction of a window based user interface consists of a set of objects and actions for the interface. Objects present a functional interface and are manipulated by passing their unique identifier to their гıssociated functions.
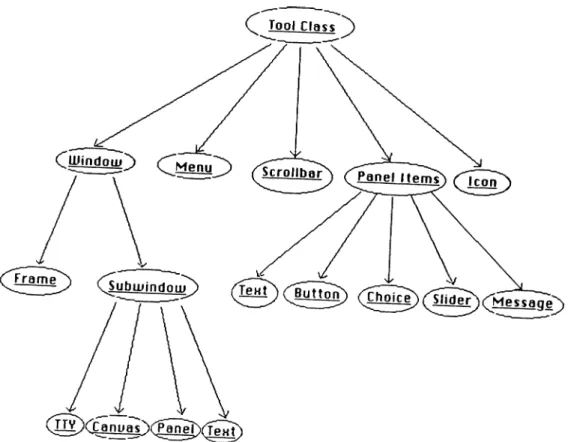
In an object oriented window manager system each element of the window manager belongs to a basic class
object. Window
is a subclass of object class havingframe
as an object andsubwindow
as a subclciss.TTY, canvas, panel
andtext
are the objects of subwindow. Additionally,text, button, message,
choice
andslider
are the objects ofpanel items
subclass belonging to object class. Also,menu, scrollbar,
andicon
are objects of object class [5].While developing our object oriented education tool, we have used the window memager’s own objects in addition to the objects designed specifically for our application.
Each entity in the application is designed as an object. At the top every object belongs to a basic class, OBJECT, that has subclasses GRAPHIC-
has subclasses, say, DECISION-BOX, PROCESS-BOX, START-STOP-RETURN- BOX, DUMMY-BOX, etc.
Instances of TEXT-OBJECT-CLASS that are the Pascal code segments corresponding to each graphic object, axe created during the code genera tion for each graphic object. For example, each DECISION-BOX created at different times and places, while running the tool generates one instance for that class, that is an object for DECISION-BOX, and so do all the other graphic symbols. The following sections discuss the environment on which these objects act and how they act.
2.3
Environment
The Pascal Teaching Tool is designed on SUN 3_50 Workstations running under 4.2 BSD UNIX^ Operating System and using SunView^ (SUN Vi- sual/Integrated Environment for Windows) window manager system in C language. Sun Workstations are fast devices with a high resolution screen for graphical applications. A mouse is used as a pointing device and a key board for text entry. A matrix printer is used as the output device [8].
Graphics architecture for the application is based on raster graphics. In raster graphics every visible picture element on the screen is called a
pixel
and has a corresponding storage location in memory. In workstations, dis play rasters are stored in dedicated regions of memory calledframe buffers
or video memory. A high speed frame buffer offers flexibility for the display of arbitrary objects, including variable width characters, foreign alphabets, mathematical symbols, lines, curves, shaded regions, and photographic im ages.A frame buffer is generally organized by plane used for monochorome ap plications, mapping one bit of memory to one pixel. Also a frame buffer may feature additional raster operation hardware to speed up raster operations [
8
].A window manager system such as Sun View is used in implementation be cause of its interactive user interface constructs. SunView defines the relation ships among the many possibilities of a workstation with multiple windows, running multiple processes. SunView manages and controls the interaction
^UNIX is the trademark o f AT&T Bell Laboratories. ^SunView is the trademark of SUN Microsystems Inc.
of the varied processes within the appropriate window [5].
From the system’s point of view, the tool is an interactive application running according to user directives from many input sources. It waits for input from mouse, keyboard, or disk. The output goes to any one of the out put devices such as graphics screen, disk, or matrix printer according to the selection of user. The environment in which the editor runs is a notification based window manager system. In a notification based system the notifier acts as the controlling entity within a user process, reading UNIX input from the kernel and formatting it into higher level events, that it distributes to the different SunView objects. The tool uses the objects of SunView which provide a means for easy development of advanced user interfaces.
2.4
Tools For User Interface
In current user friendly systems, the hardware environment for applications generally consists of a high resolution bit addressable screen, a small point ing device called a mouse, and multitasking capabilities. On a single screen, multiple overlapped windows can be concurrently active and each window can contain multiple specieil purpose subwindows, each of which can have an active process. A wide vciriety of subwindow types provides for easy devel opment of user interfaces. In such a system, management of the common interface functions is provided by a notifier/selection service, a window man ager, and a broadcast service. The notifier and selection service are the runtime systems distributing input to the appropriate windows. The window manager manages the overlapping windows. The broadcast service makes it possible to activate task and exchange data between applications running in separate windows in the same or in different processes [4].
Such a notifier based system running in a multiple window environment contains various objects -tools- and actions for the user interface. An ob ject is a software entitj^ providing a functional interface and is manipulated by passing its unique identifier, called a handle, to its associated functions. Classes of these objects cire defined in a hierarchy and can contain subclasses that may inherit common behaviour from their superclass. For a window manager system [5] this class hierarchy can be represented as in Figure 2.1.
Figure 2.1: Class hierarchy of a window manager system.
Windows refer to a visible component of the display that the user per ceives as a single entity -tool- and manipulates as a unit.
— Frames
Frames are windows containing nonoverlapping subwindows within their borders with the purpose of bringing different types of sub windows together into a common framework, providing them to be operated on as a single unit.
— Subwindows
Subwindows axe windows never existing independently and always owned by a frame.
♦ Panel
A panel is a subwindow containing panel items of buttons, message items, choice items, text items, or sliders. Buttons are simple activation confirmation items, message items provide an output eirea, choice items are to select among a number of items, text items present a type-in area, and sliders are to provide a continuous range of values.
* Text
* Canvas
A canvas is a subwindow into which programs csin draw.
♦ T T Y
A T T Y is a system subwindow in which programs cem be run and commands can be given.
• PANEL ITEMS
Panel items are panel components facilitating a particular interaction between the user and the application by button, message, slider, and choice items.
• SCROLLBARS
Scrollbars are lower class objects and dependent elements that may be attached to a subwindow to control the display of the specified portion of the window by sending appropriate locational messages. Another name used for scrollbars is the
elevator.
•
MENUSMenus axe special purpose subwindows allowing the user to choose from a list of actions.
• ICONS
Icons are small images symbolizing an application or its state.
These tools support the design of the style of user interfaces where the user typically uses a mouse to select and manipulate objects on the screen [5,10].
A window is activated when a user points to it say for input, and the window generates an event. Therefore events and their notification becomes a significant part of such a system.
2.5 A Notification Based System
2.5.1
The Notifier
Having a multiplicity of independent input sources, control of flow has to be taken away from the application, i.e.,' without performing input and output
explicitly, the application must register interest, describing the routines it wishes to be called when certain input/output events occur. A
notifier is
an example of this approach. Thus, notification based systems have some characteristics rather opposite to those of conventional sequential program ming systems. In a notification based system, the main control loop of the application does not reside in the application itself but it is managed by the concurrent notifier that is the controlling entity for user processes.In the conventional style of interactive programming, the main control loop resides in the application. An editor, for example, will read a character, take some action based on the character, then read the next character, and so on. When a character is received that represents the user’s request to quit, the program exits. Notification based systems invert this ’straight line’ control structure. The notifier reads events and ’notifies’ or ’calls out’ to a procedure that the application has previously registered with the notifier for those events.
Thus, the duty of the notifier is to sense the events and activate the proce dures of the applications -described as
callback procedures-
already specified for the events. An event is almost anything that is prescribed. The functions to be activated by the occurrence of an event for an application are registered with the notifier. This registration process is provided through specification of callback procedures for events [5,10].The control structure of a notifier based program is given in Figure 2.2.
Without a centralized notifier, the application itself would have to carry the duty of detection and dispatching of events to its components as in the case of conventional interactive programming. For programmers who are not used to a notification based system, this callback style of programming takes some getting used to. Its big advantage is that it takes over the burden of managing a complex,
event-driven
environment. In SunView, an application typically has many objects. In the absence of a centralized notifier, each application must be responsible for detecting and dispatching events to all the objects in the process. With a centralized notifier, each component of an application receives only the events the user has directed towards it and each function receives only the events related to itself.Therefore, in a notification based system, the programmer creates the required functions and object definitions for the application, then registers such definitions with the notifier, based on the occurrence of a class of events.
The control is then passed to the notifier/selection mechanism and if an event from the prescribed class should occur, the selection service activates the necessary tools [4,5].
2.5.2
Relationships Between the Notifier, Objects, and
the Application
It is not necessary for the user (programmer here) to interact with the notifier directly in the application. SunView has a two-tiered scheme in which the packages that support the various objects -panels, canvases, scrollbars, etc.- interact with the notifier directly, registering their own callback procedures. The application, in turn, registers its own callback procedures with the ob ject. Typically, when writing a SunView application the programmer first
creates the various windows and other objects needed for his/her interface, and registers his/her callback procedures with the objects. Then he/she pass control to the notifier. The work is done in the various callback procedures. There is one distinction between the ’event procedures’ for the canvases and the ’notify procedures’ for the panel items. They are all callback procedures, but they have different purposes. The canvas’s event procedure does not do much work -basically it calls out to the application’s event procedure each time an event is received. The application sees every event and is free to interpret the events however it likes.
The notify procedure for panels, on the other hand, does quite a bit of processing. It determines which item should receive the event, and places its own interpretation on events such as, the middle mouse button is ignored, or left mouse button down over an item is interpreted as a ’tentative’ selection of the item, etc. It does not call back to the notify procedure for the item until it receives a left mouse button up over the item. So panel item notify procedures are not so much concerned with the event which caused them to be called, but with the fact that the button was selected, or a new choice made, etc.
Within the context of the issues related to user interface and its tools, the design and implementation of ’a tool for teaching programming’ is discussed in the following sections.
3. D E SIG N OF A TOOL FOR T E A C H IN G
P R O G R A M M IN G
3.1
Naming Conventions
In the following sections, when describing our Pascal teaching tool, it will be mentioned as ’the tool’ in short.
Flowchart symbols consist of two main types of elements; box and arc. A box is a flowchart symbol representing an action or process in the chart and may contain textual information inside. Some examples of boxes are start/stop box, decision box, input box, output box, etc. An arc is the flowchart element providing a path for connecting the boxes of a flowchart with an arrow tip indicating the flow direction.
Pins are the connection points of boxes to connect them to other boxes via arcs. The pin at which an arc path begins is called the
beginning
pin of the arc and the pin where the arc path ends indicated by an arrow tip is namedending pin
of the arc. Arcs can be connected to other arcs through the use of dummy boxes.If a flowchart has some sub-routines to reference by a ’call subroutine box’ , flowcharts of those sub-routines are named as sub-flowcharts and generated by means of ’proc body On’ menu item. The owner flowchart -calling one- is named as main flowchart, on the other hand.
3.2
Screen Design of the Tool
As Figure 3.1 shows, there are three main areas on the screen layout of the tool : A drawing area, a flowchart menu, and information panels. Design
of all these areas are supported by the user interface tools of the window manager on which the tool is written. In the following section main parts of the tool’s screen layout with window manager’s constructs used for their implementation is presented.
• Flowchart drawing area
This area is a ’canvas’ used for drawing flowchart elements on and writing text in during flowchart generation. Its size is larger than the frame surrounding it and it can be scrolled by means of ’scrollbars’ attached to left and upper sides of the frame around (Figure 3.2).
Drawing symbols on the screen as well as text entry from keyboard are controlled by the selections from flowchart menu through mouse buttons. Activation of scrollbars are also provided by mouse buttons for scrolling the drawing area. •
Flowchart menu is implemented using ’menu’ element of the window manager to present a selection mechanism for flowchart symbols and operations to handle the tool. Menu items to select among are com posed of ’icons’ depicting the flowchart symbols and operations. The menu is displayed by pressing right mouse button inside the drawing area or left mouse button on the frame covering the drawing area and panels (Figure 3.3).
Releasing the button on one of the items -which becomes dark- chooses that item to operate. Some menu items are ’pull right menu items’
delete box load Mowcharl < >
o
delete arc d1splay code o I I o scale O clear all re d1splay all c b text edit save Flowcharl S E L E C TI
[ Qui t ] [ [jurip ] ProcedureHint : Draw the flowchart for PROCEDURE body.
Figure 3.4: Panels.
displaying another menu, when mouse is pulled right over them. For example ’display code On/OfF’ and ’procedure body On/OfF’ items are pull right menu items indicated by a right arrow nearby, and present a deeper selection mechanism.
InFormation panels
— Panel 1
First information panel is used for displaying the name of the cur rently working flowchaxt/sub-flowchart appearing on the drawing area. Since a flowchart symbolically represents a routine and can contain sub-flowcharts for sub-routines of the routine, a message giving the name of the working routine/flowchart is displayed to user near the ’Procedure name :’ message. Name of the initial flowchart is ’main’ by default, and its sub- flowcharts which are named by the user can be displayed by choosing ’procedure body On’ menu item. Returning back to the main flowchart is possible by activation of ’procedure body Off’ item.
The panel also contains two buttons, one for exiting from the tool, and other for dumping the screen image to disk for hard copy from the laser printer (Figure 3.4).
— Panel 2
This panel guides the user about what to do next after selection of a menu item. The action to be taken is announced for the user near the word ’Hint :’ (Figure 3.4).
3.3
o th er Screen Layout Elements Displayed by Flowchart
Handling Operations
• Text edit window
This is a ’text subwindow’ appearing each time a new symbol is drawn or by selection of the ’text edit’ menu item. It is used for editing textual informations of flowchart boxes (Figure 3.5).