published as:
Measurement of e^{+}e^{-}→π^{+}π^{-}ψ(3686) from
4.008 to 4.600 GeV and observation of a charged structure
in the π^{±}ψ(3686) mass spectrum
M. Ablikim et al. (BESIII Collaboration)
Phys. Rev. D 96, 032004 — Published 31 August 2017
DOI:
10.1103/PhysRevD.96.032004
charged structure in the π
±ψ(3686) mass spectrum
M. Ablikim1, M. N. Achasov9,d, S. Ahmed14, X. C. Ai1, O. Albayrak5, M. Albrecht4, D. J. Ambrose45,
A. Amoroso50A,50C, F. F. An1, Q. An47,38, J. Z. Bai1, O. Bakina23, R. Baldini Ferroli20A, Y. Ban31,
D. W. Bennett19, J. V. Bennett5, N. Berger22, M. Bertani20A, D. Bettoni21A, J. M. Bian44, F. Bianchi50A,50C,
E. Boger23,b, I. Boyko23, R. A. Briere5, H. Cai52, X. Cai1,38, O. Cakir41A, A. Calcaterra20A, G. F. Cao1,42,
S. A. Cetin41B, J. Chai50C, J. F. Chang1,38, G. Chelkov23,b,c, G. Chen1, H. S. Chen1,42, J. C. Chen1, M. L. Chen1,38,
S. Chen42, S. J. Chen29, X. Chen1,38, X. R. Chen26, Y. B. Chen1,38, X. K. Chu31, G. Cibinetto21A, H. L. Dai1,38,
J. P. Dai34,h, A. Dbeyssi14, D. Dedovich23, Z. Y. Deng1, A. Denig22, I. Denysenko23, M. Destefanis50A,50C,
F. De Mori50A,50C, Y. Ding27, C. Dong30, J. Dong1,38, L. Y. Dong1,42, M. Y. Dong1,38,42, Z. L. Dou29, S. X. Du54,
P. F. Duan1, J. Z. Fan40, J. Fang1,38, S. S. Fang1,42, X. Fang47,38, Y. Fang1, R. Farinelli21A,21B, L. Fava50B,50C,
F. Feldbauer22, G. Felici20A, C. Q. Feng47,38, E. Fioravanti21A, M. Fritsch22,14, C. D. Fu1, Q. Gao1, X. L. Gao47,38,
Y. Gao40, Z. Gao47,38, I. Garzia21A, K. Goetzen10, L. Gong30, W. X. Gong1,38, W. Gradl22, M. Greco50A,50C,
M. H. Gu1,38, Y. T. Gu12, Y. H. Guan1, A. Q. Guo1, L. B. Guo28, R. P. Guo1, Y. Guo1, Y. P. Guo22, Z. Haddadi25,
A. Hafner22, S. Han52, X. Q. Hao15, F. A. Harris43, K. L. He1,42, F. H. Heinsius4, T. Held4, Y. K. Heng1,38,42,
T. Holtmann4, Z. L. Hou1, C. Hu28, H. M. Hu1,42, T. Hu1,38,42, Y. Hu1, G. S. Huang47,38, J. S. Huang15,
X. T. Huang33, X. Z. Huang29, Z. L. Huang27, T. Hussain49, W. Ikegami Andersson51, Q. Ji1, Q. P. Ji15,
X. B. Ji1,42, X. L. Ji1,38, L. W. Jiang52, X. S. Jiang1,38,42, X. Y. Jiang30, J. B. Jiao33, Z. Jiao17, D. P. Jin1,38,42,
S. Jin1,42, T. Johansson51, A. Julin44, N. Kalantar-Nayestanaki25, X. L. Kang1, X. S. Kang30, M. Kavatsyuk25,
B. C. Ke5, P. Kiese22, R. Kliemt10, B. Kloss22, O. B. Kolcu41B,f, B. Kopf4, M. Kornicer43, A. Kupsc51, W. K¨uhn24,
J. S. Lange24, M. Lara19, P. Larin14, H. Leithoff22, C. Leng50C, C. Li51, Cheng Li47,38, D. M. Li54, F. Li1,38,
F. Y. Li31, G. Li1, H. B. Li1,42, H. J. Li1, J. C. Li1, Jin Li32, Kang Li13, Ke Li33, Lei Li3, P. R. Li42,7, Q. Y. Li33,
T. Li33, W. D. Li1,42, W. G. Li1, X. L. Li33, X. N. Li1,38, X. Q. Li30, Y. B. Li2, Z. B. Li39, H. Liang47,38,
Y. F. Liang36, Y. T. Liang24, G. R. Liao11, D. X. Lin14, B. Liu34,h, B. J. Liu1, C. X. Liu1, D. Liu47,38, F. H. Liu35,
Fang Liu1, Feng Liu6, H. B. Liu12, H. M. Liu1,42, Huanhuan Liu1, Huihui Liu16, J. Liu1, J. B. Liu47,38,
J. P. Liu52, J. Y. Liu1, K. Liu40, K. Y. Liu27, L. D. Liu31, P. L. Liu1,38, Q. Liu42, S. B. Liu47,38, X. Liu26,
Y. B. Liu30, Y. Y. Liu30, Z. A. Liu1,38,42, Zhiqing Liu22, H. Loehner25, Y. F. Long31, X. C. Lou1,38,42, H. J. Lu17,
J. G. Lu1,38, Y. Lu1, Y. P. Lu1,38, C. L. Luo28, M. X. Luo53, T. Luo43, X. L. Luo1,38, X. R. Lyu42, F. C. Ma27,
H. L. Ma1, L. L. Ma33, M. M. Ma1, Q. M. Ma1, T. Ma1, X. N. Ma30, X. Y. Ma1,38, Y. M. Ma33, F. E. Maas14,
M. Maggiora50A,50C, Q. A. Malik49, Y. J. Mao31, Z. P. Mao1, S. Marcello50A,50C, J. G. Messchendorp25,
G. Mezzadri21B, J. Min1,38, T. J. Min1, R. E. Mitchell19, X. H. Mo1,38,42, Y. J. Mo6, C. Morales Morales14,
N. Yu. Muchnoi9,d, H. Muramatsu44, P. Musiol4, Y. Nefedov23, F. Nerling10, I. B. Nikolaev9,d, Z. Ning1,38,
S. Nisar8, S. L. Niu1,38, X. Y. Niu1, S. L. Olsen32, Q. Ouyang1,38,42, S. Pacetti20B, Y. Pan47,38, M. Papenbrock51,
P. Patteri20A, M. Pelizaeus4, H. P. Peng47,38, K. Peters10,g, J. Pettersson51, J. L. Ping28, R. G. Ping1,42,
R. Poling44, V. Prasad1, H. R. Qi2, M. Qi29, S. Qian1,38, C. F. Qiao42, L. Q. Qin33, N. Qin52, X. S. Qin1,
Z. H. Qin1,38, J. F. Qiu1, K. H. Rashid49,i, C. F. Redmer22, M. Ripka22, G. Rong1,42, Ch. Rosner14, X. D. Ruan12,
A. Sarantsev23,e, M. Savri´e21B, C. Schnier4, K. Schoenning51, W. Shan31, M. Shao47,38, C. P. Shen2, P. X. Shen30,
X. Y. Shen1,42, H. Y. Sheng1, W. M. Song1, X. Y. Song1, S. Sosio50A,50C, S. Spataro50A,50C, G. X. Sun1,
J. F. Sun15, S. S. Sun1,42, X. H. Sun1, Y. J. Sun47,38, Y. Z. Sun1, Z. J. Sun1,38, Z. T. Sun19, C. J. Tang36, X. Tang1,
I. Tapan41C, E. H. Thorndike45, M. Tiemens25, I. Uman41D, G. S. Varner43, B. Wang30, B. L. Wang42, D. Wang31,
D. Y. Wang31, K. Wang1,38, L. L. Wang1, L. S. Wang1, M. Wang33, P. Wang1, P. L. Wang1, W. Wang1,38,
W. P. Wang47,38, X. F. Wang40, Y. Wang37, Y. D. Wang14, Y. F. Wang1,38,42, Y. Q. Wang22, Z. Wang1,38,
Z. G. Wang1,38, Z. H. Wang47,38, Z. Y. Wang1, Zongyuan Wang1, T. Weber22, D. H. Wei11, P. Weidenkaff22,
S. P. Wen1, U. Wiedner4, M. Wolke51, L. H. Wu1, L. J. Wu1, Z. Wu1,38, L. Xia47,38, L. G. Xia40, Y. Xia18,
D. Xiao1, H. Xiao48, Z. J. Xiao28, Y. G. Xie1,38, Y. H. Xie6, Q. L. Xiu1,38, G. F. Xu1, J. J. Xu1, L. Xu1,
Q. J. Xu13, Q. N. Xu42, X. P. Xu37, L. Yan50A,50C, W. B. Yan47,38, W. C. Yan47,38, Y. H. Yan18, H. J. Yang34,h,
H. X. Yang1, L. Yang52, Y. X. Yang11, M. Ye1,38, M. H. Ye7, J. H. Yin1, Z. Y. You39, B. X. Yu1,38,42, C. X. Yu30,
J. S. Yu26, C. Z. Yuan1,42, Y. Yuan1, A. Yuncu41B,a, A. A. Zafar49, Y. Zeng18, Z. Zeng47,38, B. X. Zhang1,
B. Y. Zhang1,38, C. C. Zhang1, D. H. Zhang1, H. H. Zhang39, H. Y. Zhang1,38, J. Zhang1, J. J. Zhang1,
J. L. Zhang1, J. Q. Zhang1, J. W. Zhang1,38,42, J. Y. Zhang1, J. Z. Zhang1,42, K. Zhang1, L. Zhang1, S. Q. Zhang30,
X. Y. Zhang33, Y. H. Zhang1,38, Y. N. Zhang42, Y. T. Zhang47,38, Yang Zhang1, Yao Zhang1, Yu Zhang42,
Ling Zhao1, M. G. Zhao30, Q. Zhao1, Q. W. Zhao1, S. J. Zhao54, T. C. Zhao1, Y. B. Zhao1,38, Z. G. Zhao47,38,
A. Zhemchugov23,b, B. Zheng48,14, J. P. Zheng1,38, W. J. Zheng33, Y. H. Zheng42, B. Zhong28, L. Zhou1,38,
X. Zhou52, X. K. Zhou47,38, X. R. Zhou47,38, X. Y. Zhou1, K. Zhu1, K. J. Zhu1,38,42, S. Zhu1, S. H. Zhu46,
X. L. Zhu40, Y. C. Zhu47,38, Y. S. Zhu1,42, Z. A. Zhu1,42, J. Zhuang1,38, L. Zotti50A,50C, B. S. Zou1, J. H. Zou1
(BESIII Collaboration)
1 Institute of High Energy Physics, Beijing 100049, People’s Republic of China
2 Beihang University, Beijing 100191, People’s Republic of China
3 Beijing Institute of Petrochemical Technology, Beijing 102617, People’s Republic of China
4 Bochum Ruhr-University, D-44780 Bochum, Germany
5 Carnegie Mellon University, Pittsburgh, Pennsylvania 15213, USA
6 Central China Normal University, Wuhan 430079, People’s Republic of China
7 China Center of Advanced Science and Technology, Beijing 100190, People’s Republic of China
8 COMSATS Institute of Information Technology, Lahore, Defence Road, Off Raiwind Road, 54000 Lahore, Pakistan
9 G.I. Budker Institute of Nuclear Physics SB RAS (BINP), Novosibirsk 630090, Russia
10 GSI Helmholtzcentre for Heavy Ion Research GmbH, D-64291 Darmstadt, Germany
11 Guangxi Normal University, Guilin 541004, People’s Republic of China
12 Guangxi University, Nanning 530004, People’s Republic of China
13 Hangzhou Normal University, Hangzhou 310036, People’s Republic of China
14 Helmholtz Institute Mainz, Johann-Joachim-Becher-Weg 45, D-55099 Mainz, Germany
15 Henan Normal University, Xinxiang 453007, People’s Republic of China
16 Henan University of Science and Technology, Luoyang 471003, People’s Republic of China
17 Huangshan College, Huangshan 245000, People’s Republic of China
18 Hunan University, Changsha 410082, People’s Republic of China
19 Indiana University, Bloomington, Indiana 47405, USA
20 (A)INFN Laboratori Nazionali di Frascati, I-00044, Frascati,
Italy; (B)INFN and University of Perugia, I-06100, Perugia, Italy
21 (A)INFN Sezione di Ferrara, I-44122, Ferrara, Italy; (B)University of Ferrara, I-44122, Ferrara, Italy
22 Johannes Gutenberg University of Mainz, Johann-Joachim-Becher-Weg 45, D-55099 Mainz, Germany
23 Joint Institute for Nuclear Research, 141980 Dubna, Moscow region, Russia
24Justus-Liebig-Universitaet Giessen, II. Physikalisches Institut, Heinrich-Buff-Ring 16, D-35392 Giessen, Germany
25 KVI-CART, University of Groningen, NL-9747 AA Groningen, The Netherlands
26 Lanzhou University, Lanzhou 730000, People’s Republic of China
27 Liaoning University, Shenyang 110036, People’s Republic of China
28 Nanjing Normal University, Nanjing 210023, People’s Republic of China
29 Nanjing University, Nanjing 210093, People’s Republic of China
30 Nankai University, Tianjin 300071, People’s Republic of China
31 Peking University, Beijing 100871, People’s Republic of China
32 Seoul National University, Seoul, 151-747 Korea
33 Shandong University, Jinan 250100, People’s Republic of China
34 Shanghai Jiao Tong University, Shanghai 200240, People’s Republic of China
35 Shanxi University, Taiyuan 030006, People’s Republic of China
36 Sichuan University, Chengdu 610064, People’s Republic of China
37 Soochow University, Suzhou 215006, People’s Republic of China
38 State Key Laboratory of Particle Detection and Electronics,
Beijing 100049, Hefei 230026, People’s Republic of China
39 Sun Yat-Sen University, Guangzhou 510275, People’s Republic of China
40 Tsinghua University, Beijing 100084, People’s Republic of China
41 (A)Ankara University, 06100 Tandogan, Ankara, Turkey; (B)Istanbul Bilgi
University, 34060 Eyup, Istanbul, Turkey; (C)Uludag University, 16059 Bursa, Turkey; (D)Near East University, Nicosia, North Cyprus, Mersin 10, Turkey
42 University of Chinese Academy of Sciences, Beijing 100049, People’s Republic of China
43 University of Hawaii, Honolulu, Hawaii 96822, USA
45 University of Rochester, Rochester, New York 14627, USA
46 University of Science and Technology Liaoning, Anshan 114051, People’s Republic of China
47 University of Science and Technology of China, Hefei 230026, People’s Republic of China
48 University of South China, Hengyang 421001, People’s Republic of China
49 University of the Punjab, Lahore-54590, Pakistan
50 (A)University of Turin, I-10125, Turin, Italy; (B)University of Eastern
Piedmont, I-15121, Alessandria, Italy; (C)INFN, I-10125, Turin, Italy
51 Uppsala University, Box 516, SE-75120 Uppsala, Sweden
52 Wuhan University, Wuhan 430072, People’s Republic of China
53 Zhejiang University, Hangzhou 310027, People’s Republic of China
54 Zhengzhou University, Zhengzhou 450001, People’s Republic of China
a Also at Bogazici University, 34342 Istanbul, Turkey
b Also at the Moscow Institute of Physics and Technology, Moscow 141700, Russia
c Also at the Functional Electronics Laboratory, Tomsk State University, Tomsk, 634050, Russia
d Also at the Novosibirsk State University, Novosibirsk, 630090, Russia
e Also at the NRC ”Kurchatov Institute”, PNPI, 188300, Gatchina, Russia
f Also at Istanbul Arel University, 34295 Istanbul, Turkey
g Also at Goethe University Frankfurt, 60323 Frankfurt am Main, Germany
h Also at Key Laboratory for Particle Physics, Astrophysics and Cosmology, Ministry
of Education; Shanghai Key Laboratory for Particle Physics and Cosmology; Institute of Nuclear and Particle Physics, Shanghai 200240, People’s Republic of China
i Government College Women University, Sialkot - 51310. Punjab, Pakistan.
We study the process e+e−
→ π+π−
ψ(3686) using 5.1 fb−1of data collected at 16 center-of-mass
energy (√s) points from 4.008 to 4.600 GeV by the BESIII detector operating at the BEPCII collider. The measured Born cross sections for e+
e−→ π+
π−ψ(3686) are consistent with previous results, but with much improved precision. A fit to the cross section shows contributions from two structures: the first has M = 4209.5 ± 7.4 ± 1.4 MeV/c2
and Γ = 80.1 ± 24.6 ± 2.9 MeV, and the second has M = 4383.8±4.2±0.8 MeV/c2
and Γ = 84.2±12.5±2.1 MeV, where the first errors are statistical and the second systematic. The lower-mass resonance is observed in the process e+
e−→ π+
π−ψ(3686) for the first time with a statistical significance of 5.8σ. A charged charmonium-like structure is observed in the π±
ψ(3686) invariant mass spectrum for data at√s = 4.416 GeV. A fit with an S-wave Breit-Wigner function yields a mass M = 4032.1 ± 2.4 MeV/c2
, where the errors are statistical only. However, there are still unresolved discrepancies between the fit model and data. The width of the intermediate state varies in a wide range for different kinematic regions within the data set. Therefore no simple interpretation of the data has been found, and a future data sample with larger statistics and more theoretical input will be required to better understand this issue.
PACS numbers: 14.40.Rt, 14.40.Pq, 13.66.Bc
I. INTRODUCTION
In the past decade, a series of new vector (JP C =
1−−) charmoniumlike states, e.g., the Y (4260), Y (4360),
and Y (4660), have been observed in e+e− annihilation
through dipion hadronic transitions to low mass char-monium states [1–5]. Many theoretical interpretations have been proposed to understand the underlying struc-ture of the Y family of states, such as hybrid charmoni-um [6], tetraquark [7], or hadronic molecule [8] etc. The
Y (4360) was first observed in e+e− → γ
ISRY (4360) →
γISRπ+π−ψ(3686) by BaBar [4] and subsequently
con-firmed by Belle [5]. Recently, two resonant structures
were observed in the processes e+e− → π+π−J/ψ at
BESIII [9], indicating the Y (4260) resonance reported by previous experiments [1–3] actually consists of two structures. There are two resonances observed in the
process e+e−→ π+π−h
c[10] in the mass region between
4.2 and 4.4 GeV/c2. The lower mass state, Y (4220),
has a mass consistent with the lower mass state
ob-served in e+e− → π+π−J/ψ [9], but has a somewhat
larger width. The higher mass state, Y (4390), does not match any known vector charmonium or charmonium-like states. Therefore, a more precise measurement of
the cross section of e+e− → π+π−ψ(3686) at BESIII
will help to clarify the spectrum of vector particles. In recent years, another mysterious and interesting new
pattern of charmoniumlike states, the Z±
c ’s, have been
observed both in final states containing a charged pion and a low mass charmonium state [3, 11–13], and in pairs
of charmed mesons (D(∗)D¯∗)±[14–16]. A similar pattern
of states is also observed in the bottomonium system [17]. All of these states contain a minimum of four quarks as they are electrically charged and their constituents
include a c¯c pair. They are good candidates for meson-meson molecules or tightly bound tetraquark states. To clarify their true nature, it is essential to search for this kind of exotic state in other final states. Belle’s recently
updated result of e+e−→ γISRπ+π−ψ(3686), using their
full data samples, shows evidence for a new Z±
c state
in the mass spectrum of π±ψ(3686) with a mass around
4.05 GeV/c2 and a statistical significance of 3.5σ [5]. It
is important to confirm the existence of this new Z±
c candidate in other experiments.
In this paper, we present a study of e+e− →
π+π−ψ(3686), with two decay modes ψ(3686) →
π+π−J/ψ (mode I) and ψ(3686) → neutrals + J/ψ
(mode II), where ‘neutrals’ refers to π0π0, π0, η and
γγ, at center-of-mass (c.m.) energies √s from 4.008 to
4.600 GeV. The J/ψ is reconstructed in its
promi-nent decay mode J/ψ → ℓ+ℓ− (ℓ = e/µ). The
actu-al c.m. energies are measured by studying the process
e+e− → µ+µ− [18]. The data samples used in this
analysis were collected with the BESIII detector at the BEPCII collider at 16 different c.m. energy points with
a total integrated luminosity of 5.1 fb−1 [19].
II. THE BESIII EXPERIMENT AND THE DATA SETS
BEPCII is a double-ring e+e− collider running at
c.m. energies between 2.0 and 4.6 GeV, reaching a peak
luminosity of 1.0 × 1033cm−2s−1 at a c.m. energy of
3770 MeV. The cylindrical BESIII detector has an ef-fective geometrical acceptance of 93% of 4π and is divid-ed into a barrel section and two endcaps. It contains a
small cell, helium-based (60% He, 40% C3H8) main drift
chamber (MDC) which provides a momentum measure-ment of charged particles with a resolution of 0.5% at a momentum of 1 GeV/c in a magnetic field of 1 Tesla. The energy loss measurement (dE/dx) provided by the MDC has a resolution better than 6%. A time-of-flight system (TOF) consisting of 5-cm-thick plastic scintilla-tors can measure the flight time of charged particles with a time resolution of 80 ps in the barrel and 110 ps in the endcaps. An electromagnetic calorimeter (EMC) consist-ing of 6240 CsI (Tl) in a cylindrical structure and two endcaps is used to measure the energies of photons and electrons. The energy resolution of the EMC is 2.5% in the barrel and 5.0% in the endcaps for photon/electrons with an energy of 1 GeV. The position resolution of the EMC is 6 mm in the barrel and 9 mm in the endcaps. A
muon system (MUC) consisting of 1000 m2 of Resistive
Plate Chambers (RPC) is used to identify muons and provides a spatial resolution better than 2 cm. A de-tailed description of the BESIII detector can be found in Ref. [20].
The Geant4-based [21] Monte Carlo (MC) simula-tion software package Boost [22] is used to generate
the signal and background MC samples. The e+e−
colli-sion is simulated with the KKMC [23] generator taking
into account the beam energy spread and Initial State
Radiation (ISR), where the line shape of the e+e− →
π+π−ψ(3686) cross section is taken from the latest Belle
results [5]. The QED Final State Radiative (FSR)
correc-tion for J/ψ → ℓ+ℓ− is incorporated with Photos [24].
Large signal MC samples e+e− → π+π−ψ(3686) as well
as the dominant backgrounds are generated exclusive-ly at each c.m. energy, where the decay ψ(3686) →
π+(0)π−(0)J/ψ is simulated with the Jpipi model [25],
and the decay e+e− → π+π−ψ(3686) is generated with
both the Jpipi model and a model distributed uniformly in phase space (PHSP). The Jpipi model is construct-ed with an effective Lagrangian for the hadronic decays and the coupling constants in the model are obtained
by a fit to the invariant π+π− mass distributions in
ψ(3686) → π+π−J/ψ. The generic inclusive MC samples
at√s = 4.258 and 4.358 GeV, with integrated
luminosi-ty equivalent to that of data, are generated to study the potential background contributions, where the known de-cay modes are generated with Evtgen [26] with branch-ing fractions set to values in the Particle Data Group (PDG) [27], and the remaining unknown ones are gener-ated with Lundcharm [28].
III. EVENT SELECTION
The final states of the decay e+e− → π+π−ψ(3686)
have topologies π+π−π+π−ℓ+ℓ− and π+π−ℓ+ℓ− +
N γ (N ≥ 2) for mode I and II, respectively. A good charged track must have a polar angle | cos θ| < 0.93 in the MDC, and have the point of closest approach to the interaction point within 1 cm in the plane perpendic-ular to the beam and within ±10 cm along the beam. Candidate events are required to have five (with ±1 net charge) or six (with zero net charge) charged tracks for mode I and four (with zero net charge) charged tracks for mode II. Photon candidates are reconstructed by clus-tering EMC energy deposits. They must have a mini-mum energy of 25 MeV for | cos θ| < 0.8 or 50 MeV for 0.86 < | cos θ| < 0.92, and be isolated from all charged
tracks by an angle > 10◦. EMC timing is used to
sup-press electronic noise and energy deposition unrelated to the event. At least two photon candidates are required for mode II. Since pions and leptons are kinematically well separated for the signal process, charged tracks with momentum p > 1.0 GeV/c are assumed to be leptons, while those with p < 0.65 GeV/c are pions. Electron and muon separation is performed with the deposited energy E in the electromagnetic calorimeter. Electrons must have E/pc > 0.7, while muons have E < 0.45 GeV. Candidate events are required to have one lepton pair
ℓ+ℓ−, and the other tracks must be pions. The number
of hits in the muon counter is further required to be not
less than 5 for J/ψ → µ+µ− candidates.
In mode I, a four-constraint (4C) kinematic fit
impos-ing energy-momentum conservation under the e+e− →
can-didates with six charged tracks, and a one-constraint (1C) kinematic fit with one missing pion is applied for the candidates with five charged tracks. The corresponding
χ2 of the fit must be χ2
4C< 60 or χ21C< 15, respectively.
The J/ψ signal appears with low background in the
spec-trum of the ℓ+ℓ− invariant mass, M (ℓ+ℓ−), calculated
with the corrected momentum after the kinematic fit, and
is required to be within 3.05 < M (ℓ+ℓ−) < 3.15 GeV/c2.
To improve the mass resolution of the ψ(3686), the select-ed candidates with six or five good chargselect-ed tracks are fur-ther fed into a five-constraint (5C) or two-constraint (2C)
kinematic fit with an additional constraint on M (ℓ+ℓ−)
to the nominal J/ψ mass (M (J/ψ)) [27], respectively.
The ψ(3686) signal is reconstructed with the π+π−J/ψ
system (four combinations per event) whose invariant
mass M (π+π−J/ψ), calculated with the corrected
mo-mentum after the 5C or 2C fit, is closest to the nominal ψ(3686) mass (M (ψ(3686))) [27].
In mode II, no kinematic fit is applied. The J/ψ
signal is extracted by requiring 3.05 < M (ℓ+ℓ−) <
3.15 GeV/c2. The ψ(3686) signal is
reconstruct-ed using the mass recoiling against the π+π−
sys-tem, Mrecoil(π+π−). The requirement |Mcorr
ψ(3686) −
M (ψ(3686))| > 8 MeV/c2 is imposed to veto the
background e+e− → neutrals + ψ(3686) (ψ(3686) →
π+π−J/ψ), where Mcorr
ψ(3686) = M (π+π−ℓ+ℓ−) −
M (ℓ+ℓ−) + M (J/ψ). A requirement |M(γγπ+π−) −
M (η)| > 50 MeV/c2 is used to eliminate the background
e+e− → ηJ/ψ (η → π+π−π0), where γγ are the two
photons with largest energy, and M (η) is the nominal
η mass [27]. A requirement cos θπ+π− < 0.9 is also
ap-plied to remove the radiative Bhabha and dimuon
back-ground in which a photon converts into a e+e− pair and
is misidentified as a π+π− pair.
IV. EXTRACTION OF THE BORN CROSS
SECTION
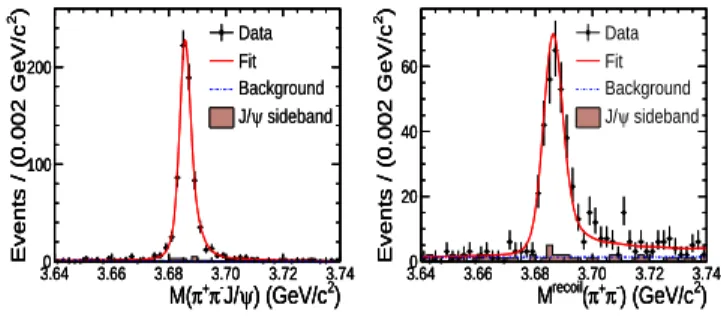
With the above selection criteria, a prominent ψ(3686) signal over a small background is observed in the
M (π+π−J/ψ) and Mrecoil(π+π−) spectra for Mode I and
Mode II, respectively, as shown in Fig. 1 for data at
√s = 4.416 GeV as an example. Potential backgrounds
without a J/ψ in the final state are explored with events within the J/ψ sideband regions. Backgrounds including a J/ψ in the final state are studied with both inclusive and exclusive MC samples. From these studies, no peak-ing background is expected in the range of interest in the two ψ(3686) decay modes. To determine the signal yields, unbinned maximum likelihood fits are performed
to the M (π+π−J/ψ) and Mrecoil(π+π−) spectra for the
two modes, respectively. Here, the signal probability den-sity function (PDF) is described with the MC simulated shape convoluted with a Gaussian function to account for the mass resolution difference between data and MC simulation, and the PDF for background is presented as a linear function. Simultaneous fits to data at 16
differ-ent c.m. energies are performed. The c.m. energies share a common background shape and a common data/MC resolution difference. ) 2 ) (GeV/c ψ J/ -π + π M( 3.64 3.66 3.68 3.70 3.72 3.74 ) 2 Events / (0.002 GeV/c 0 100 200 ) 2 ) (GeV/c ψ J/ -π + π M( 3.64 3.66 3.68 3.70 3.72 3.74 ) 2 Events / (0.002 GeV/c 0 100 200 ) 2 ) (GeV/c ψ J/ -π + π M( 3.64 3.66 3.68 3.70 3.72 3.74 ) 2 Events / (0.002 GeV/c 0 100 200 Data Fit Background sideband ψ J/ Data Fit Background sideband ψ J/ ) 2 ) (GeV/c -π + π ( recoil M 3.64 3.66 3.68 3.70 3.72 3.74 ) 2 Events / (0.002 GeV/c 0 20 40 60 ) 2 ) (GeV/c -π + π ( recoil M 3.64 3.66 3.68 3.70 3.72 3.74 ) 2 Events / (0.002 GeV/c 0 20 40 60 ) 2 ) (GeV/c -π + π ( recoil M 3.64 3.66 3.68 3.70 3.72 3.74 ) 2 Events / (0.002 GeV/c 0 20 40 60 Data Fit Background sideband ψ J/
FIG. 1. Distributions of (left) M (π+
π−
J/ψ) for mode I and (right) Mrecoil
(π+
π−
) for mode II at√s =4.416 GeV, with the integrated luminosity of 1074 pb−1. Dots with error bars are data, the shaded histograms are background from J/ψ sideband, and the curves are the fit described in the text.
The Born cross section is determined from
σB i = Nobs i Lint (1 + δr) (1 + δv) Bri ǫi (i = 1, 2), (1) where Nobs
i is the signal yield extracted from the fit, Lint
is the integrated luminosity, 1 + δr is the ISR correction
factor, 1 + δv is the vacuum polarization factor, Br is
the product of the decay branching fractions of the in-termediate states in the cascade decay (4.11% for mode I and 2.95% for mode II), and ǫ is the detection efficien-cy. The various numbers used in the Born cross section calculation are summarized in Table I.
Several sources of systematic uncertainty are consid-ered in the measurement of the Born cross section. The uncertainty in the tracking efficiency for leptons and pio-ns are 1.0% per track [30]. The uncertainty in the photon efficiency is 1.0% per photon [31]. The uncertainty relat-ed to the requirement on the number of hits in the muon counter is 4.2%, determined by studying a control sample
of e+e− → π+π−J/ψ. The uncertainty associated with
the kinematic fit is estimated with the same technique as in Ref. [32]. The uncertainty associated with the J/ψ
mass requirement is estimated by smearing the M (ℓ+ℓ−)
distribution of MC samples according to the resolution
of M (ℓ+ℓ−) in data, and the difference in MC
efficien-cies is taken as the uncertainty. In mode II, the
uncer-tainties associated with the requirements on Mcorr
ψ(3686),
M (γγπ+π−) and cos θ
π+π− are evaluated by changing
the requirements. The uncertainty associated with the fit procedure is investigated by varying the fit range, re-placing the linear function by a second-order polynomial function for the background, and varying the width of the Gaussian function for signal. For data sets with large lu-minosity, the detection efficiency is estimated with a MC sample weighted according to the observed Dalitz plot
M2(π+ψ(3686)) versus M2(π+π−). The corresponding
uncertainty is estimated by varying the weight factors ac-cording to the statistical uncertainty of data in each bin
TABLE I. Summary of the measurement of the Born cross section σB
at individual c. m. energies. The subscript 1 or 2 denotes mode I or II, respectively. The first uncertainties are statistical, and the second systematic. An upper limit at the 90% confidence level (C.L.) is determined by a profile likelihood method [29] for data samples with low signal significance.
√ s (GeV) L (pb−1) Nobs 1 ǫ1 (%) N2obs ǫ2(%) (1 + δr) (1 + δv) σ1B (pb) σ B 2 (pb) σ B (pb) 4.008 482 0.0 ± 0.6 22.6 0.2 ± 2.3 4.7 0.70 1.056 < 0.9 < 23.3 < 0.9 4.085 52.6 4.0 ± 2.0 36.1 1.0 ± 1.0 20.9 0.75 1.056 6.5 ± 3.2 ± 0.9 3.9 ± 3.9 ± 0.3 5.4 ± 2.5 ± 0.6 4.189 43.1 3.8 ± 2.0 39.2 2.8 ± 2.2 27.7 0.76 1.056 6.8 ± 3.6 ± 0.7 9.9 ± 7.8 ± 1.5 7.3 ± 3.3 ± 0.7 4.208 54.6 8.9 ± 3.3 40.7 7.0 ± 3.0 27.5 0.76 1.057 12.2 ± 4.5 ± 1.7 20.0 ± 8.4 ± 1.9 14.0 ± 4.0 ± 1.5 4.217 54.1 13.0 ± 3.6 40.9 0.0 ± 0.7 27.3 0.76 1.057 17.8 ± 4.9 ± 1.5 < 30.4 17.8 ± 4.9 ± 1.5 4.226 1092 315 ± 18 39.2 141 ± 14 28.1 0.76 1.056 22.3 ± 1.3 ± 1.7 19.4 ± 1.9 ± 2.0 21.3 ± 1.1 ± 1.6 4.242 55.6 11.0 ± 3.3 41.4 7.9 ± 3.1 28.0 0.76 1.053 14.6 ± 4.4 ± 1.3 21.5 ± 8.4 ± 1.8 16.0 ± 3.9 ± 1.2 4.258 826 241 ± 16 40.3 84 ± 11 23.5 0.76 1.054 22.0 ± 1.4 ± 1.7 18.3 ± 2.5 ± 1.8 20.9 ± 1.2 ± 1.5 4.308 44.9 17.0 ± 4.2 41.6 15.0 ± 4.1 27.3 0.74 1.053 28.2 ± 6.9 ± 2.6 53.2 ± 14.5 ± 7.4 32.1 ± 6.2 ± 2.8 4.358 540 439 ± 21 41.2 275 ± 19 29.8 0.79 1.051 57.8 ± 2.8 ± 4.4 69.8 ± 4.8 ± 5.2 61.0 ± 2.4 ± 4.3 4.387 55.2 56.6 ± 7.6 39.4 25.7 ± 6.1 29.4 0.86 1.051 70.1 ± 9.4 ± 6.7 59.4 ± 14.1 ± 5.6 66.4 ± 7.8 ± 5.5 4.416 1074 693 ± 27 37.8 415 ± 24 27.4 0.96 1.053 41.0 ± 1.6 ± 3.2 47.3 ± 2.7 ± 3.7 42.8 ± 1.4 ± 3.0 4.467 110 15.1 ± 4.2 32.6 8.3 ± 4.2 23.9 1.10 1.055 8.8 ± 2.5 ± 1.0 9.2 ± 4.7 ± 1.9 8.9 ± 2.2 ± 0.9 4.527 110 13.4 ± 4.0 29.1 7.0 ± 3.6 20.8 1.25 1.055 7.7 ± 2.3 ± 0.9 7.8 ± 4.0 ± 1.2 7.7 ± 2.0 ± 0.8 4.575 47.7 4.5 ± 2.3 28.3 5.7 ± 3.2 20.2 1.23 1.055 6.2 ± 3.2 ± 0.8 15.4 ± 8.7 ± 1.8 7.3 ± 3.0 ± 0.8 4.600 567 106 ± 11 31.8 71 ± 10 21.5 1.08 1.055 12.6 ± 1.3 ± 1.2 17.2 ± 2.4 ± 1.6 14.6 ± 1.1 ± 1.1
on the Dalitz plane. For data sets with low luminosity, the detection efficiency is estimated using MC samples with the Jpipi model; the corresponding uncertainty is evaluated with large luminosity data sets, by taking the largest difference of efficiencies between the Jpipi mod-el MC sample and their nominal values with weighted MC. The uncertainty related with the ISR correction fac-tor is studied by replacing the input cross section line shape with the latest results from BaBar [4] in KKMC,
and the change on (1 + δv) ǫ is taken as an
uncertain-ty. The uncertainty in the vacuum polarization factor is 0.5% taken from a QED calculation [33]. The uncer-tainty on the integrated luminosity is 1%, determined with large angle Bhabha events [19]. The uncertainties in the decay branching fractions of intermediate states are quoted from the PDG [27]. The uncertainty from others sources, such as lepton separation, trigger efficien-cy, and FSR are negligible, and are conservatively taken to be 1.0%. Assuming all sources of systematic are inde-pendent, the total uncertainties are obtained by adding the individual values in quadrature, and are in a range between 7.7% to 14.1% and 7.4% to 20.1%, depending on c.m. energy, for mode I and II, respectively.
The measured Born cross sections of e+e− →
π+π−ψ(3686) at individual c.m. energies for the two
ψ(3686) decay modes are consistent with each other
with-in their uncertawith-inties. The measurements are
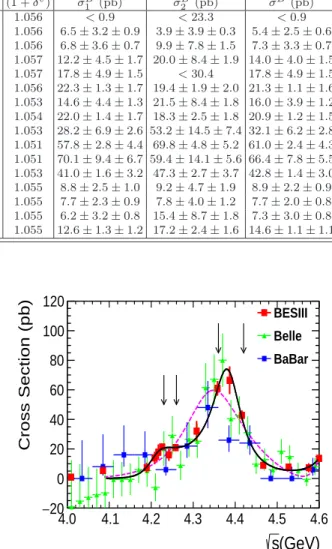
there-fore combined by considering the correlated and un-correlated uncertainties between the two modes, accord-ing to Refs. [34, 35]. The comparison of the combined
Born cross section of e+e− → π+π−ψ(3686) with those
from previous experimental results is shown in Fig. 2. The results are consistent with former experiments, and have much improved precision.
(GeV)
s
4.0 4.1 4.2 4.3 4.4 4.5 4.6 Cross Section (pb) 20 − 0 20 40 60 80 100 120 BESIII Belle BaBarFIG. 2. Born cross section of e+
e−
→ π+π−
ψ(3686). The dots (red) are the results obtained in this analysis, the trian-gles (green) and squares (blue) are from BELLE and Babar’s latest updated results, respectively. The solid curve is the fit to BESIII results with the coherent sum of three Breit-Wigner functions. The dashed curve (pink) is the fit to BESIII results with the coherent sum of two Breit-Wigner functions without the Y (4220) hypothesis. The arrows mark the locations of four energy points with large luminosities.
V. FIT TO THE CROSS SECTION
To study the possible resonant structures in e+e− →
π+π−ψ(3686), a binned χ2 fit is applied to describe the
cross section obtained in this analysis in a energy region from 4.085 GeV to 4.600 GeV. Assuming that three res-onances exist, the PDF can be parameterized as
A = f1eiφ1+ f2+ f3eiφ2, (2)
where f1 is for the Y (4220), f2 is for the Y (4390), f3 is
and Y (4220), and φ2is the phase angle between Y (4390) and Y (4660).
The amplitude fi (i = 1, 2, 3) for each resonance is a
P -wave Breit-Wigner function, defined as
fi= Mi M q 12πBiΓe +e− i Γi M2− M2 i + iMiΓi s Φ(M ) Φ(Mi) , (3)
where Mi is the mass of the resonance, Γe
+
e−
i is the
par-tial width to e+e−, Γ
iis the total width, Biis the
branch-ing fraction of the resonance decaybranch-ing to π+π−ψ(3686),
and Φ(Mi) is the three-body PHSP factor. In the fit, Mi,
Γi, the product BiΓe
+
e−
i , and the relative phase angle φi
(i = 1, 2) are free parameters. The parameters of the Y (4660) are fixed to Belle’s latest results [5].
The fit result is shown in Fig. 2 as the solid curve and the resulting parameters of the resonances are summa-rized in Table II. There are two solutions with equally
good fit quality, χ2/ndf = 9.98/7, where ndf is the
num-ber of degrees of freedom. An alternative fit without Y (4220) is performed as shown by the dashed curve in
Fig. 2, yielding χ2/ndf = 54.54/11. The significance of
the Y (4220) is determined to be 5.8σ. TABLE II. Results of the fit to the e+e−
→ π+π−
ψ(3686) cross section. The error is statistical only.
Parameters Solution I Solution II
M (Y 4220) (MeV/c2) 4209.5 ± 7.4 Γ(Y (4220)) (MeV) 80.1 ± 24.6 BΓe+e− (Y (4220)) (eV) 0.8 ± 0.7 0.4 ± 0.3 M (Y 4390) (MeV/c2) 4383.8 ± 4.2 Γ(Y (4390)) (MeV) 84.2 ± 12.5 BΓe+e− (Y (4390)) (eV) 3.6 ± 1.5 2.7 ± 1.0 φ1 (rad) 3.3 ± 1.0 2.8 ± 0.4 φ2 (rad) 0.8 ± 0.9 4.7 ± 0.1
The systematic uncertainties accociated with the reso-nance parameters include the following. The uncertainty from the c.m. energy measurement is studied by taking
the uncertainty of the c.m. energy ∆(√s)=0.8 GeV [18]
into consideration. The uncertainty due to the c.m. en-ergy spread is estimated by convoluting the fit PDF with a Gaussian function with a width of 1.6 MeV, which is the energy spread determined by the Beam Energy
Measurement System [36]. The uncertainty from the
fit range is investigated by including the first energy
point √s = 4.008 GeV or excluding the energy point
√
s = 4.085 GeV. The uncertainty from the Y (4660) resonance is studied by varying the parameters of the Y (4660) within its uncertainties. Table III summarizes the systematic uncertainties for the mass and total width of the resonances Y (4220) and Y (4390).
A comparison of the masses and widths of the Y (4220) and Y (4390) determined in this work to those of other vector states observed at BESIII in the mass region
be-tween 4.2 and 4.4 GeV/c2 are shown in Table IV.
TABLE III. Systematic uncertainty in the measurement of resonance parameters.
Sources Y (4220) Y (4390)
M (MeV/c2) Γ (MeV) M (MeV/c2) Γ (MeV)
Energy scale 0.1 0.0 0.1 0.0
Energy spread 1.3 0.1 0.7 1.6
Fit range 0.2 1.8 0.2 0.5
Y (4660) 0.6 2.3 0.3 1.2
Total 1.4 2.9 0.8 2.1
VI. STUDY OF INTERMEDIATE STATES
Intermediate states in the process e+e− →
π+π−ψ(3686) are investigated in the data samples
that have large integrated luminosity. A requirement of
3.68 < M (π+π−J/ψ)(Mrecoil(π+π−)) < 3.70 GeV/c2
is applied to extract the ψ(3686) signal, and the
side-band regions, 3.63 < M (π+π−J/ψ)(Mrecoil(π+π−)) <
3.65 GeV/c2 or 3.73 < M (π+π−J/ψ) < 3.75 GeV/c2,
are used to explore the potential non-ψ(3686) back-grounds, where only the left side sideband region is used in mode II since a long tail appears on the right side of the ψ(3686) signal due to ISR. The non-ψ(3686) backgrounds are found to be small, and do not produce peaks in the various distributions.
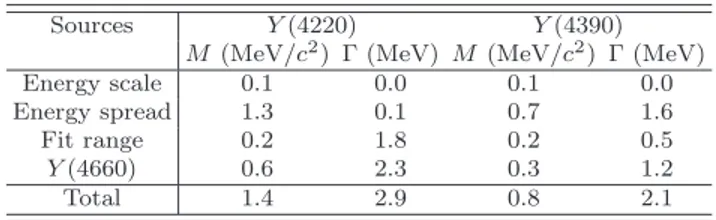
With the above selection criteria, the Dalitz plots of
M2(π+π−) versus M2(π±ψ(3686)) and the
correspond-ing one-dimensional projections are shown in Fig. 3 for
data samples at√s = 4.416, 4.358, 4.258 and 4.226 GeV,
individually, where the plots include the candidates of the two ψ(3686) decay modes. It should be noted that the two higher energy points are from the Y (4390) peak region, while the other two are from the Y (4220) peak re-gion. These four points are marked with vertical arrows in Fig. 2.
For data at √s = 4.416 GeV, a prominent
nar-row structure is observed around 4030 MeV/c2 in the
M (π±ψ(3686)) spectrum. The structure is also evident
in the corresponding Dalitz plot, but it appears to be
more complex when looking at high and low M (π+π−)
ranges. In the low M (π+π−) region, there seem to be
two separate π±ψ(3686) structures, presumably
corsponding to a physical structure and its kinematic
re-flection. But in the high M (π+π−) region, only one
broad π±ψ(3686) structure is seen. For data at √s =
4.358 GeV, there is no obvious structure observed in
the M (π±ψ(3686)) spectrum, but a cluster of events
ap-pear in the low M (π+π−) region on the corresponding
Dalitz plot. It is worth noting that, at this c.m.
en-ergy, a physical structure with a mass of 4030 MeV/c2
in the M (π±ψ(3686)) spectrum has a reflection at the
same mass position. For data at√s = 4.258 GeV, two
bumps around 3900 and 4030 MeV/c2are visible in both
the Dalitz plot and in the M (π±ψ(3686)) spectrum. For
data at √s = 4.258 GeV, the possible structures with
TABLE IV. Masses and widths of the vector charmonium states observed from different processes at BESIII in the mass region between 4.2 and 4.4 GeV/c2. The subscript 1 or 2 denotes the lower mass state or higher mass state.
Process M1(MeV/c2) Γ1 (MeV) M2(MeV/c2) Γ2 (MeV)
e+e− → ωχc0 4230 ± 8 ± 6 38 ± 12 ± 2 [37] e+e− → π+π−J/ψ 4220.0 ± 3.1 ± 1.4 44.1 ± 4.3 ± 2.0 4320.0 ± 10.4 ± 7.0 101.4+25.3 −19.7± 10.2[9] e+ e− → π+ π− hc 4218.4+5.5−4.5± 0.9 66.0+12.3−8.3 ± 0.4 4391.5+6.3−6.8± 1.0 139.5+16.2−20.6± 0.6 [10] e+ e− → π+ D0 D∗− + c.c 4224.8 ± 5.6 ± 4.0 72.3 ± 9.1 ± 0.9 4400.1 ± 9.3 ± 2.1 181.7 ± 16.9 ± 7.4 [38] e+ e− → π+ π− ψ(3686) 4209.5 ± 7.4 ± 1.4 80.1 ± 24.6 ± 2.9 4383.8 ± 4.2 ± 0.8 84.2 ± 12.5 ± 2.1 2 ) 2 ) (GeV/c ± π (3686) ψ ( 2 M 15 16 17 18 2) 2 ) (GeV/c -π +π ( 2 M 0.0 0.2 0.4 0.6 0 5 10 15 20 √ s= 4.416 GeV 2 ) 2 (3686))(GeV/c ψ ± π ( 2 M 15 16 17 18 ) 2 ) 2 Events / (0.1 (GeV/c 0 50 100 150 2 ) 2 (3686))(GeV/c ψ ± π ( 2 M 15 16 17 18 ) 2 ) 2 Events / (0.1 (GeV/c 0 50 100 150 2 ) 2 )(GeV/c -π + π ( 2 M 0.1 0.2 0.3 0.4 0.5 ) 2) 2 Events / (0.02 (GeV/c 0 20 40 60 2 ) 2 )(GeV/c -π + π ( 2 M 0.1 0.2 0.3 0.4 0.5 ) 2) 2 Events / (0.02 (GeV/c 0 20 40 60 2 ) 2 ) (GeV/c ± π (3686) ψ ( 2 M 15 16 17 2) 2 ) (GeV/c -π +π ( 2 M 0.0 0.1 0.2 0.3 0.4 0.5 0 2 4 6 8 10 12 √ s= 4.358 GeV 2 ) 2 (3686))(GeV/c ψ ± π ( 2 M 15 16 17 ) 2) 2 Events / (0.1 (GeV/c 0 20 40 60 80 2 ) 2 )(GeV/c -π + π ( 2 M 0.1 0.2 0.3 0.4 ) 2) 2 Events / (0.01 (GeV/c 0 20 40 60 2 ) 2 ) (GeV/c ± π (3686) ψ ( 2 M 15.0 15.5 16.0 16.5 17.0 2) 2 ) (GeV/c -π + π ( 2 M 0.0 0.1 0.2 0.3 0.4 0 2 4 6 8 √ s= 4.258 GeV 2 ) 2 (3686))(GeV/c ψ ± π ( 2 M 15.0 15.5 16.0 16.5 ) 2) 2 Events / (0.1 (GeV/c 0 20 40 60 2 ) 2 )(GeV/c -π + π ( 2 M 0.10 0.15 0.20 0.25 0.30 ) 2) 2 Events / (0.01 (GeV/c 0 10 20 30 2 ) 2 ) (GeV/c ± π (3686) ψ ( 2 M 15.0 15.5 16.0 16.5 2) 2 ) (GeV/c -π + π ( 2 M 0.0 0.1 0.2 0.3 0 2 4 6 8 10 √ s= 4.226 GeV 2 ) 2 (3686))(GeV/c ψ ± π ( 2 M 15.0 15.5 16.0 16.5 ) 2) 2 Events / (0.1 (GeV/c 0 20 40 60 80 2 ) 2 )(GeV/c -π + π ( 2 M 0.10 0.15 0.20 0.25 0.30 ) 2) 2 Events / (0.01 (GeV/c 0 10 20 30 40
FIG. 3. Dalitz plots of M2
(π± ψ(3686)) versus M2 (π+ π− ), distributions of M2 (π±
ψ(3686)) (two entries per event), and M2
(π+
π−
) for data at√s = 4.416, 4.358, 4.258 and 4.226 GeV, with integrated luminosities of 1074, 540, 826 and 1092 pb−1, respectively. Dots with errors are data. For the plots at√s = 4.416, 4.358 and 4.258 GeV,
the solid curves (red) are projections from the fit; the dashed curves (pink) show the shape of the intermediate state; the dash-dotted curves (blue) show the shape from the direct process e+
e−
→ π+π−
ψ(3686) obtained from the Jpipi MC model; the shaded histograms (green) show the non-ψ(3686) background estimated with the ψ(3686) sideband. For plots at√s = 4.226 GeV, the dashed (pink) and dash-dotted (blue) curves show the shapes from the intermediate state and the direct process e+
e−
→ π+π−
ψ(3686) (with arbitrary scale). In all plots, the two ψ(3686) decay modes are combined.
spectrum have kinematic reflections at each other’s mass
positions. For data at√s = 4.226 GeV, no structure is
clearly seen, which is very different from the behavior at
the energy point close by, √s = 4.258 GeV. A further
striking feature for data at √s = 4.226 GeV is a very
different M (π+π−) distribution from those at the other
three energy points.
To characterize the structure observed on the
M (π±ψ(3686)) spectrum for data at √s = 4.416 GeV,
an unbinned maximum likelihood fit is carried out on the
Dalitz plot of M2(π+ψ(3686)) versus M2(π−ψ(3686))
(denoted as x and y in formula 4). Assuming an
in-termediate state with spin parity 1+, the Dalitz plot is
parameterized by the coherent sum of the process with
an intermediate state and the direct process e+e− →
π+π−ψ(3686). The PDF of the intermediate state is
described with an S-wave Breit-Wigner function with-out considering interference among the charged conjugate modes, p · q/c2 (M2 R− x)2+ MR2· Γ2/c4 + p · q/c 2 (M2 R− y)2+ MR2 · Γ2/c4 , (4) where p (q) is the ψ(3686) (intermediate state)
momen-tum in the π±ψ(3686) (initial e+e−) rest frame, and M
R and Γ are the mass and width of the intermediate state. The 2-dimensional mass resolution and the detection effi-ciency, determined from MC simulations, are incorporat-ed in the PDF for the intermincorporat-ediate states in the fit. The
PDF of the direct process e+e−→ π+π−ψ(3686) is taken
from a MC-simulated shape using the Jpipi model, and that of the non-ψ(3686) background is described with the distribution of events in the ψ(3686) sideband region. A simultaneous fit constraining the mass and width of the intermediate state is carried out by maximize the product of the likelihood values of the two ψ(3686) decay modes. The fit process is validated using MC samples. The dis-tributions of mass resolution and detection efficiency are provided in the appendix.
The fit yields a mass of M = 4032.1 ± 2.4 MeV/c2
and a width of Γ = 26.1 ± 5.3 MeV for the intermediate state with a significance of 9.2σ, evaluated by comparing the likelihood values with or without the intermediate
states included. The fit projections on M2(π±ψ(3686))
and M2(π+π−) for data at √s = 4.416 GeV are shown
in Fig. 3. It can be seen that the overall fit curve does
not match the peaking structure on the M (π±ψ(3686))
spectrum in data, and the corresponding confidence lev-el (C.L.) of the fit is only 8%, as estimated by toy-MC tests. Alternative fits with different assumptions of the spin parity of the intermediate state, including the terference among the charge conjugated modes, and
in-cluding the contribution of Zc(3900)± are explored. In
these fits the parameters of the intermediate state are close to the norminal fit result and the fit qualities are not improved significantly. As shown in the Dalitz plot, the behavior of the structure is very different between
the high M (π+π−) region and the low M (π+π−) region.
A similar fit to data with the additional requirement
M2(π+π−) > 0.3 (GeV/c2)2 is performed, which yields
a mass of M = 4030.3 ± 0.1 MeV/c2 and a width of
Γ = 5.1 ± 0.2 MeV. The corresponding projection of the
fit and data on the M2(π±ψ(3686)) distribution is shown
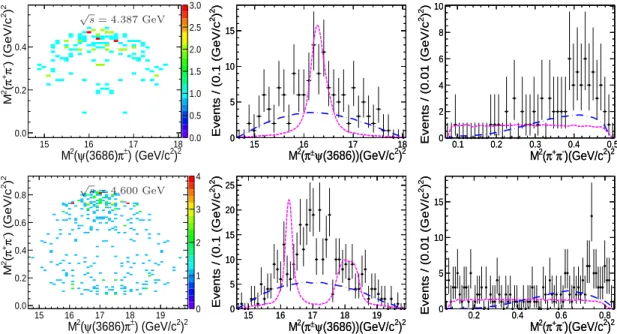
in Fig. 4, and the fit C.L. is 50%.
2
)
2(3686))(GeV/c
ψ
±π
(
2M
15 16 17 18)
2)
2Events / (0.1 (GeV/c
0 50 100 150 FIG. 4. Projection of M2(π± ψ(3686)) at √s = 4.416 GeV with a requirement of M2 (π+ π− ) > 0.3 (GeV/c2 )2 .Similar fits are carried out to data at √s = 4.358
and 4.258 GeV, where the parameters of the interme-diate state are fixed to those from the fit to data at √
s = 4.416 GeV. The projections on M2(π±ψ(3686))
and M2(π+π−) are also shown in Fig. 3. The statistical
significance of the intermediate state is 3.6σ and 9.6σ for
data at √s = 4.358 and 4.258 GeV, respectively. For
data at √s = 4.358 GeV, as shown in the Dalitz plot,
a cluster of events appears in the M2(π±ψ(3686))
spec-trum at low M2(π+π−), which also shows a hint of an
intermediate structure. As mentioned previously, for
da-ta at √s = 4.258 GeV, the structures with masses of
3900 and 4030 MeV/c2 on the M (π±ψ(3686)) spectrum
are kinematic reflections of each other, so the fit results
are strongly dependent on whether the Zc(3900)± is
in-cluded in the fit or not. For data at√s = 4.226 GeV,
an intermediate state with a mass of 4030 MeV and its reflection are very close to the kinematic boundary of the three-body decay, so no obvious peak is observed in
the M (π±ψ(3686)) spectrum. The anomalous
distribu-tion on the M (π+π−) spectrum is, however, discussed in
Ref. [39]. For the other energy points with high
statis-tics, such as√s = 4.387 and 4.600 GeV, the Dalitz plots
and the distribution of M2(π±ψ(3686)) and M2(π+π−)
are shown in Fig. 5.
VII. SUMMARY
In summary, based on 5.1 fb−1 of e+e− collision data
with c.m. energies between 4.008 and 4.600 GeV, col-lected with the BESIII detector, the Born cross
sec-2 ) 2 ) (GeV/c ± π (3686) ψ ( 2 M 15 16 17 18 2) 2 ) (GeV/c -π + π ( 2 M 0.0 0.2 0.4 0.0 0.5 1.0 1.5 2.0 2.5 3.0 √ s= 4.387 GeV 2 ) 2 (3686))(GeV/c ψ ± π ( 2 M 15 16 17 18 ) 2 ) 2 Events / (0.1 (GeV/c 0 5 10 15 2 ) 2 (3686))(GeV/c ψ ± π ( 2 M 15 16 17 18 ) 2 ) 2 Events / (0.1 (GeV/c 0 5 10 15 2 ) 2 )(GeV/c -π + π ( 2 M 0.1 0.2 0.3 0.4 0.5 ) 2) 2 Events / (0.01 (GeV/c 0 2 4 6 8 10 2 ) 2 )(GeV/c -π + π ( 2 M 0.1 0.2 0.3 0.4 0.5 ) 2) 2 Events / (0.01 (GeV/c 0 2 4 6 8 10 2 ) 2 ) (GeV/c ± π (3686) ψ ( 2 M 15 16 17 18 19 2) 2 ) (GeV/c -π +π ( 2 M 0.0 0.2 0.4 0.6 0.8 0 1 2 3 4 √ s= 4.600 GeV 2 ) 2 (3686))(GeV/c ψ ± π ( 2 M 15 16 17 18 19 ) 2 ) 2 Events / (0.1 (GeV/c 0 5 10 15 20 25 2 ) 2 (3686))(GeV/c ψ ± π ( 2 M 15 16 17 18 19 ) 2 ) 2 Events / (0.1 (GeV/c 0 5 10 15 20 25 2 ) 2 )(GeV/c -π + π ( 2 M 0.2 0.4 0.6 0.8 ) 2) 2 Events / (0.01 (GeV/c 0 5 10 15 2 ) 2 )(GeV/c -π + π ( 2 M 0.2 0.4 0.6 0.8 ) 2) 2 Events / (0.01 (GeV/c 0 5 10 15
FIG. 5. Dalitz plots of M2(π±
ψ(3686)) versus M2(π+π−
), distributions of M2(π±
ψ(3686)) (two entries per event), and M2
(π+
π−
) for data at√s = 4.38 and 4.600 GeV, Dots with errors are data, the dashed (pink) and dash-dotted (blue) curves show the shapes from intermediate state and direct process e+
e−
→ π+π−
ψ(3686) (with arbitrary scale).
tions of e+e− → π+π−ψ(3686) are measured. The
mea-sured cross sections are in good agreement with those from Babar and Belle [4, 5], but with significantly im-proved precision. The cross section is fit with three co-herent Breit-Wigner functions. The parameters of two resonances, the Y (4220) and Y (4390), are determined
from the fit to be M = 4209.5 ± 7.4 ± 1.4 MeV/c2 and
Γ = 80.1 ± 24.6 ± 2.9 MeV for the Y (4220), and M =
4383.8 ± 4.2 ± 0.8 MeV/c2and Γ = 84.2 ± 12.5 ± 2.1 MeV
for the Y (4390), where the first errors are statistical and the second systematic. The resonance Y (4220) is
observed in the process e+e− → π+π−ψ(3686) for the
first time with a significance of 5.8σ. Both of the reso-nances Y (4220) and Y (4390) are consistent with the
vec-tor resonances observed in e+e− → π+π−h
c [10]. The
Y (4220) state is possibly the same state as observed in
e+e−→ π+π−J/ψ [9] and e+e−→ ωχ
c0[37], and an
at-tempt was made with a combined fit to the e+e−→ ωχc0,
π+π−J/ψ, π+π−h
c, and π+D0D∗−+ c.c cross sections
measured by BESIII to determine the resonant parame-ters of the Y (4220) [40]. Peaking at a similar mass was
also observed in the process e+e−→ ηJ/ψ [41] at BESIII.
A charged charmonium-like structure is observed in the
M (π±ψ(3686)) spectrum for data at √s = 4.416 GeV.
A fit to the structure, assuming the existence of a
spin-parity 1+ charmonium-like state, yields a mass M =
4032.1±2.4 MeV/c2, where the errors are statistical only.
However, the fit cannot describe data well. The width of the intermediate state varies over a wide range for
dif-ferent kinematic regions of data at √s = 4.416 GeV.
Similar fits are carried out to data at √s = 4.258 and
4.358 GeV, where there is also evidence for the new
struc-ture at 4030 MeV/c2in the M (π±ψ(3686)) spectra. For
data at √s = 4.226 GeV, no obvious structure in the
M (π±ψ(3686)) spectrum is observed, but the M (π+π−)
spectrum shows an anomalous distribution. The mea-sured mass of the intermediate state deviates from that of the structure observed by Belle with their full data sam-ple [5] by over 3σ. Larger data sets, as well as additional theoretical input, are necessary for further understanding
of the intermediate structures in e+e−→ π+π−ψ(3686).
VIII. ACKNOWLEDGMENTS
The BESIII collaboration thanks the staff of BEPCII, the IHEP computing center and the supercomputing
center of USTC for their strong support. This work
is supported in part by National Key Basic Research Program of China under Contract No. 2015CB856700; National Natural Science Foundation of China (NSFC) under Contracts Nos. 11235011, 11322544, 11335008, 11375170, 11275189, 11425524, 11475164, 11475169, 11625523, 11605196, 11605198, 11635010; the Chinese Academy of Sciences (CAS) Large-Scale Scientific Facility Program; the CAS Center for Excellence in Particle Physics (CCEPP); Joint Large-Scale Scientific Facility Funds of the NSFC and CAS under Contracts Nos. U1332201, U1532257, U1532258, U1532102; CAS under Contracts Nos. N29, KJCX2-YW-N45, QYZDJ-SSW-SLH003; 100 Talents Program of CAS; National 1000 Talents Program of China; INPAC and Shanghai Key Laboratory for Particle Physics and Cosmology; German Research Foundation DFG under
Contracts Nos. Collaborative Research Center CRC
1044, FOR 2359; Istituto Nazionale di Fisica Nucleare, Italy; Joint Large-Scale Scientific Facility Funds of the NSFC and CAS; Koninklijke Nederlandse Akademie van Wetenschappen (KNAW) under Contract No. 530-4CDP03; Ministry of Development of Turkey under
Contract No. DPT2006K-120470; National Natural Science Foundation of China (NSFC); National Science and Technology fund; The Swedish Resarch Council; U.
S. Department of Energy under Contracts Nos.
DE-FG02-05ER41374, DE-SC-0010118, DE-SC-0010504,
DE-SC-0012069; University of Groningen (RuG) and the Helmholtzzentrum fuer Schwerionenforschung GmbH (GSI), Darmstadt; WCU Program of National Research Foundation of Korea under Contract No. R32-2008-000-10155-0.
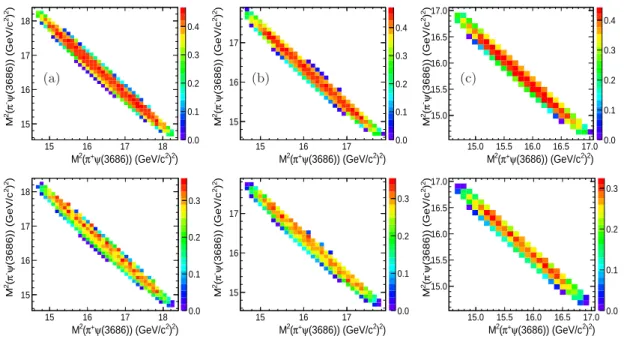
Appendix A: Distribution ofǫ(x, y) and σ(x, y) In Eq. A1, the fit procedure can be carried out
by the Breit-Wigner function for M2(π+ψ(3686)) and
M2(π−ψ(3686)) (denoted as x and y) convoluted with
a resolution function σ(x), σ(y), respectively, and then each of them multiplies by a flat polynomial on y and x to form a 2-dimensional function. The signal shape can then be obtained by multiplying a 2-dimensional res-olution function ǫ(x, y) after adding the above two 2-dimensional functions together.
ǫ(x, y) · ( p · q (M2 R− x) 2+ M2 R· Γ 2+ p · q (M2 R− y) 2+ M2 R· Γ 2) ⊗ σ(x, y), (A1)
The resolution for distributions M2(π+ψ(3686)) and
M2(π−ψ(3686)) are shown in Fig. 6 for c.m. energies
√
s =4.416, 4.358, 4.258 and 4.226 GeV. It can be pa-rameterised by a double-Gaussian with the parameters listed in Table V. The distributions of 2-dimensional ef-ficiency function are shown in Fig. 7.
[1] B. Aubert et al. [BaBar Collaboration], Phys. Rev. Lett. 95, 142001 (2005); J. P. Lees et al. [BaBar Collaboration], Phys. Rev. D 86, 051102(R) (2012); [2] Q. He et al. [CLEO Collaboration], Phys. Rev. D 74,
091104(R) (2006);
[3] C. Z. Yuan et al. [Belle Collaboration], Phys. Rev. Lett. 99, 182004 (2007); Z. Q. Liu et al. [Belle Collaboration], Phys. Rev. Lett. 110, 252002 (2013).
[4] B. Aubert et al. [BaBar Collaboration], Phys. Rev. Lett. 98, 212001 (2007); Phys. Rev. D 89, 111103 (2014). [5] X. L. Wang et al. [Belle Collaboration], Phys. Rev. Lett.
99, 142002 (2007); Phys. Rev. D 91, 112007 (2015). [6] F. E. Close and P. R. Page, Phys. Lett. B 628, 215
(2005);
[7] L. Maiani, V. Riquer, F. Piccinini and A. D. Polosa, Phys. Rev. D 72, 031502 (2005);
[8] M. B. Voloshin and L. B. Okun, JETP Lett. 23, 333 (1976); A. De Rujula, H. Georgi and S. L. Glashow, Phys. Rev. Lett. 38, 317 (1977); X. Liu, X. Q. Zeng and X. Q. Li, Phys. Rev. D 72, 054023 (2005);
[9] M. Ablikim et al. [BESIII Collaboration], Phys. Rev. Lett. 118, 092001 (2017).
[10] M. Ablikim et al. [BESIII Collaboration], Phys. Rev. Lett. 118, 092002 (2017).
[11] M. Ablikim et al. [BESIII Collaboration], Phys. Rev. Lett. 110, 252001 (2013).
[12] T. Xiao et al., Phys. Lett. B 727, 366 (2013).
[13] M. Ablikim et al. [BESIII Collaboration], Phys. Rev. Lett. 111, 242001 (2013).
[14] M. Ablikim et al. [BESIII Collaboration], Phys. Rev. Lett. 112, 022001 (2014).
[15] M. Ablikim et al. [BESIII Collaboration], Phys. Rev. D 92, 092006 (2015).
[16] M. Ablikim et al. [BESIII Collaboration], Phys. Rev. Lett. 112, 132001 (2014).
[17] A. Bondar et al. [Belle Collaboration], Phys. Rev. Lett. 108,122001(2012).
[18] M. Ablikim et al. [BESIII Collaboration], Chin. Phys. C 40, 063001 (2016).
[19] M. Ablikim et al. [BESIII Collaboration], Chin. Phys. C 39, 093001 (2015).
[20] M. Ablikim et al. [BESIII Collaboration], Nucl. Instrum. Meth. A 614, 3 (2010).
[21] S. Agostinelli et al. [Geant4 Collaboration], Nucl. Instrum. Meth. A 506, 250 (2003).
[22] Z. Y. Deng et al., HEP&NP 30, 371 (2006).
[23] S. Jadach, B. F. L. Ward, and Z. Was, Phys. Rev. D 63, 113009 (2001).
[24] E. Barberio and Z. Was, Comput. Phys. Commum. 79, 219 (1994).
[25] T. Mannel and R. Urech, Z. Phys. C 73, 541 (1997); S. Chakravarty and P. Ko, Phys. Rev. D 48, 1205 (1993); S. Chakravarty, S. M. Kim and P. Ko, Phys. Rev. D 50, 389 (1994).
[26] R. G. Ping, Chin. Phys. C 32, 599 (2008); D. J. Lange, Nucl. Instrum. Meth. A 462, 152 (2001).
[27] K. A. Olive et al. [Particle Data Group], Chin. Phys. C, 38, 090001 (2014).
[28] J. C. Chen, G. S. Huang, X. R. Qi, D. H. Zhang and Y. S. Zhu, Phys. Rev. D 62, 034003 (2000).
[29] W. A. Rolke et al. Nucl. Instrm. Meth. A 551, 493 (2005). [30] M. Ablikim et al. [BESIII Collaboration], Phys. Rev. Lett. 112, 022001 (2014); Phys. Rev. D 83, 112005 (2015).
[31] M. Ablikim et al. [BESIII Collaboration], Phys. Rev. D 81, 052005 (2010).
[32] M. Ablikim et al. [BESIII Collaboration], Phys. Rev. D 87, 012002 (2013).
[33] E. A. Kuraev and V. S. Fadin, Sov. J. Nucl. Phys. 41, 466 (1985) [Yad. Fiz. 41, 733 (1985)].
[34] G. D’Agostini, Nucl. Instrum. Meth. A 346, 306 (1994). [35] M. Ablikim et al. [BESIII Collaboration], Phys. Rev. D
89, 074039 (2014).
[36] E. V. Abakumova et al. Nucl. Instrum. Meth. A 659, 21 (2011).
[37] M. Ablikim et al. [BESIII Collaboration], Phys. Rev. Lett. 114, 092003 (2015).
[38] Chang-Zheng Yuan for the BESIII Collaboration, ”e+
e−
annihilation cross section measurements at BESIII”, talk at ”the 10th workshop of the France China Particle Physics Laboratory”, http://indico.ihep.ac.cn/ event/6651/timetable/#20170329.detailed, March
2 ) 2 (3686))) (GeV/c ψ ± π ( 2 (M ∆ -0.10 -0.05 0.00 0.05 0.10 0.15 2) 2 Events / (0.005 (GeV/c 0 200 400 600 800 1000 1200 1400 1600 1800 2000 2 ) 2 (3686))) (GeV/c ψ ± π ( 2 (M ∆ -0.10 -0.05 0.00 0.05 0.10 0.15 2) 2 Events / (0.005 (GeV/c 0 200 400 600 800 1000 1200 1400 1600 1800 2000 (a) 2 ) 2 (3686))) (GeV/c ψ ± π ( 2 (M ∆ -0.10 -0.05 0.00 0.05 0.10 0.15 2) 2 Events / (0.005 (GeV/c 0 500 1000 1500 2000 2500 2 ) 2 (3686))) (GeV/c ψ ± π ( 2 (M ∆ -0.10 -0.05 0.00 0.05 0.10 0.15 2) 2 Events / (0.005 (GeV/c 0 500 1000 1500 2000 2500 (b) 2 ) 2 (3686))) (GeV/c ψ ± π ( 2 (M ∆ -0.10 -0.05 0.00 0.05 0.10 0.15 2) 2 Events / (0.005 (GeV/c 0 500 1000 1500 2000 2500 3000 3500 2 ) 2 (3686))) (GeV/c ψ ± π ( 2 (M ∆ -0.10 -0.05 0.00 0.05 0.10 0.15 2) 2 Events / (0.005 (GeV/c 0 500 1000 1500 2000 2500 3000 3500 (c) 2 ) 2 (3686))) (GeV/c ψ ± π ( 2 (M ∆ -0.10 -0.05 0.00 0.05 0.10 0.15 2) 2 Events / (0.005 (GeV/c 0 200 400 600 800 1000 1200 2 ) 2 (3686))) (GeV/c ψ ± π ( 2 (M ∆ -0.10 -0.05 0.00 0.05 0.10 0.15 2) 2 Events / (0.005 (GeV/c 0 200 400 600 800 1000 1200 2 ) 2 (3686))) (GeV/c ψ ± π ( 2 (M ∆ -0.10 -0.05 0.00 0.05 0.10 0.15 2) 2 Events / (0.005 (GeV/c 0 200 400 600 800 1000 1200 1400 2 ) 2 (3686))) (GeV/c ψ ± π ( 2 (M ∆ -0.10 -0.05 0.00 0.05 0.10 0.15 2) 2 Events / (0.005 (GeV/c 0 200 400 600 800 1000 1200 1400 2 ) 2 (3686))) (GeV/c ψ ± π ( 2 (M ∆ -0.10 -0.05 0.00 0.05 0.10 0.15 2) 2 Events / (0.005 (GeV/c 0 200 400 600 800 1000 1200 1400 1600 1800 2 ) 2 (3686))) (GeV/c ψ ± π ( 2 (M ∆ -0.10 -0.05 0.00 0.05 0.10 0.15 2) 2 Events / (0.005 (GeV/c 0 200 400 600 800 1000 1200 1400 1600 1800
FIG. 6. Resolution function for M2(π±
ψ(3686)) at (a) 4.416, (b) 4.358, (c) 4.258 and (d) 4.226 GeV. The upper plots for mode I and bottom for mode II. Dots with error bars are data, the red solid line are fit results, dot-dashed line in pink denotes contribution from Gaussian function one, and the dashed line in blue denotes contribution from Gaussian function two.
TABLE V. Parameters of the resolution for M2
(π±ψ(3686)), M and σ are the mean and resolution of Gaussian function, respectively. The subscript 1 or 2 denote Gaussian function one or two. f ra is the fraction of Gaussian function one.
√s (GeV) M
1 (GeV/c2)2 σ1 (GeV/c2)2 M2 (GeV/c2)2 σ2 (GeV/c2)2 f ra
4.416 (Mode I) 0.00088 ± 0.00017 0.01611 ± 0.00016 0.0377 ± 0.0014 0.0543 ± 0.0010 0.7862 ± 0.0064 4.416 (Mode II) 0.00014 ± 0.00047 0.01918 ± 0.00031 0.0581 ± 0.0046 0.0311 ± 0.0023 0.841 ± 0.019 4.358 (Mode I) 0.00114 ± 0.00015 0.01585 ± 0.00014 0.0376 ± 0.0013 0.0567 ± 0.0010 0.7809 ± 0.0057 4.358 (Mode II) 0.00011 ± 0.00037 0.01839 ± 0.00029 0.0508 ± 0.0049 0.0335 ± 0.0021 0.839 ± 0.020 4.258 (Mode I) 0.00037 ± 0.00012 0.01562 ± 0.00011 0.0326 ± 0.0010 0.05346 ± 0.00079 0.7974 ± 0.0048 4.258 (Mode II) −0.001167 ± 0.00026 0.01724 ± 0.00023 0.0432 ± 0.0032 0.0344 ± 0.0013 0.841 ± 0.014
27-30, 2017, Tsinghua University, Beijing, China. [39] M. B. Voloshin, JETP Lett. 37, 69 (1983);
V. V.Anisovich, D. V. Bugg, A. V. Sarantsev and B. S. Zou, Phys. Rev. D 51, R4619 (1995).
[40] X. Y. Gao, C. P. Shen and C. Z. Yuan, Phys. Rev. D
95, 092007 (2017).
[41] M. Ablikim et al. [BESIII Collaboration], Phys. Rev. D 91, 112005 (2015).
) 2 ) 2 (3686)) (GeV/c ψ + π ( 2 M 15 16 17 18 ) 2) 2 (3686)) (GeV/c ψ -π ( 2 M 15 16 17 18 0.0 0.1 0.2 0.3 0.4 (a) ) 2 ) 2 (3686)) (GeV/c ψ + π ( 2 M 15 16 17 ) 2) 2 (3686)) (GeV/c ψ -π ( 2 M 15 16 17 0.0 0.1 0.2 0.3 0.4 (b) ) 2 ) 2 (3686)) (GeV/c ψ + π ( 2 M 15.0 15.5 16.0 16.5 17.0 ) 2) 2 (3686)) (GeV/c ψ -π ( 2 M15.0 15.5 16.0 16.5 17.0 0.0 0.1 0.2 0.3 0.4 (c) ) 2 ) 2 (3686)) (GeV/c ψ + π ( 2 M 15 16 17 18 ) 2) 2 (3686)) (GeV/c ψ -π ( 2 M 15 16 17 18 0.0 0.1 0.2 0.3 ) 2 ) 2 (3686)) (GeV/c ψ + π ( 2 M 15 16 17 ) 2) 2 (3686)) (GeV/c ψ -π ( 2 M 15 16 17 0.0 0.1 0.2 0.3 ) 2 ) 2 (3686)) (GeV/c ψ + π ( 2 M 15.0 15.5 16.0 16.5 17.0 ) 2) 2 (3686)) (GeV/c ψ -π ( 2 M15.0 15.5 16.0 16.5 17.0 0.0 0.1 0.2 0.3
FIG. 7. The 2-dimensional efficiency curve ǫ(x, y) for M2
(π+
ψ(3686)) versus M2
(π−ψ(3686)) at (a) 4.416, (b) 4.358, (c) 4.258 and (d) 4.226 GeV. The upper plots for mode I and bottom for mode II.