Impact of Natural Gas Price on Electricity Price
Forecasting in Turkish Day-Ahead Market
Oguzhan Goktug Poyrazoglu Mechanical Engineering
Bilkent University Ankara, Turkey
Gokturk Poyrazoglu Electrical & Electronics Engineering
Ozyegin University Istanbul, Turkey
[email protected] Abstract—The electricity is a regular commodity that is
being sold and bought in a highly transparent and efficient market in Turkey. The market is operated by EXIST and an hourly energy price is formed for every hour in the day-ahead market. In Sept. 2018, EXIST also found a central natural gas market in Turkey which enables a ground for all shareholders in the natural gas industry. This study examines the impact of natural gas prices formed in the market on the electricity price. Different predictors are tested to lower the mean absolute percentage error. Addition of past natural gas price into the forecasting model reduces the error from 15.85% to 14.31% when the average of the last two weeks’ natural gas price is used. This may indicate that the current natural gas price affects the electricity market two weeks later. And the final model also reached the 6.67% error for a Saturday, which is a significantly accurate forecast for a volatile electricity market.
Keywords—electricity price forecasting, natural gas price, price formation, multiple linear regression, interaction regression, lagged price
I. INTRODUCTION
The electricity and the natural gas (NG) are indeed two commodities that have separate market structures and rules in developed countries. They are being traded every day between the suppliers and the consumers in a market environment. Although a central electricity market was found by Turkish Energy Exchange (EXIST) in 2015 in Turkey, there was no central natural gas market until it was found by EXIST in September 2018 [1]. After the new foundation of the natural gas market, the price formation in the industry and the stability of the price variation of natural gas as a commodity are under more predictable. The NG market structure is based on a uniform price auction which maximizes the social welfare by maximizing the total of both supplier and consumer surplus. The NG market operator, EXIST, has experience in the operating electricity markets and they now provide a transparent ground to all NG shareholders to sell their goods or to buy their needs.
Although the NG market and the electricity market are two separate market grounds for two different commodities; the high share of NG in the fuel mix of electricity generation creates an unbreakable bond between two markets. The NG share in power production has once reached to 46.5% in 2010 in Turkey [2] but till then reduced constantly to 30.5% in 2018 [3] due to the increased number of new-builds by renewable energy. One of the main reasons for high investment in gas-fired plants in the 2000s was the high spark spread of NG between 2007 and 2009. The spark spread is the ratio between the price of electricity and the cost of generating it by natural gas [4]. Although the spark spread has been decreasing ever since and has reached 100% in December 2018 in Turkey [5]. This study is intended to look at the different formulations of electricity price forecasting in Turkey and to evaluate the impact of the central NG market price on the electricity price.
Due to the new formation of the NG market in Turkey, in Sept. 2018, this study is the first research on this field with a special application for Turkey. The research is also valuable in terms of representing the unbreakable bond of natural gas and electricity and the future discussion can be extended to co-optimization of two markets as a trending topic in energy economics.
The research question in this study is to detect the possible impact of daily natural gas price on the formation of electricity day-ahead market (DAM). But first, the other parameters that have an impact on the DAM should have been known to deterministically calculate the impact of NG price. For other DAMs in Europe and the USA, there are lots of studies in the literature that introduces parameters that have an impact on the electricity price formation; however, there is a limited study on the Turkish DAM price formation, so the first step in this study is to identify the parameters. Therefore, a generic function as given in (1) to forecast the hourly electricity price is adopted. It is based on a theoretical approach of forecasting a variable as a function of other variables but itself, so that the historical price is not included as a predictor to forecast the price of electricity. However, the observations in the Turkish electricity market reveals that the price formation is not independent of itself. Therefore, an intermediate well-structured study is conducted to reveal the correlation of previous hour electricity price with the current hour electricity price. The most successful equation is then used as a benchmark. Later the impact of previous day NG price is included in the benchmark by considering different variations of the predictor, such as previous day price or previous week average price. The foundation of the Turkish natural gas market by EXIST is not a while ago. Therefore, the training data has limitations to start from the date, Sept. 1st, 2018.
The rest of the paper is structured as follows: Section II provides the details of the multi-variable-linear-regression method adopted for the long term and the short term forecasting. Section III describes the fundamental background of the Turkish natural gas market and presents the results of the developed short-term price forecasting model. Section IV discusses the findings and concludes the study by analysis.
II. ELECTRICITY PRICE FORECASTING A. Long Term Forecasting
The hourly price in the DAM, in a very basic explanation, is the intersection point of supply and demand cost curves. This intersection point in the economics literature is the point that maximizes the total supplier and consumer surpluses. Therefore, supply and demand cost curves might be used to forecast the price of electricity; however, the secrecy of this two information is the key of a free market so it is impossible to use them. Therefore, a price forecasting model should include other features having a possible impact on the price such as hour-of-the-day, day-of-the-week, holidays, temperature, humidity, load forecast, historical electricity
price, and NG price. For long-term forecasting; however, the model should use only calendar variables and demand forecast due to the high error expectation on long term meteorological forecast. This implies almost all long term predictions to avoid reducing the interpretability of the model [6]. Therefore, a long-term electricity price forecasting model, as adopted in this study, is given in (1).
= + + + + +
+ (1)
where is the price forecast for time (hour) t; are the coefficients estimated by least square errors method; , , and are the hour-of-the-day, day-of-the-week, and a binary predictor to define the hour of the day to be a part of either a working day (zero) or a holiday (one). The load forecast of time t, is the key predictor in long-term price forecasting model; finalized with the function of the current hour load forecast as given in (2). = + + + + + + + + + + + (2)
18 weeks of historical data (Sept. 3rd, 2018- Jan. 4th, 2019)
is used to estimate the coefficients of (1). Three-days-ahead ex-post validation period is selected (Jan 5th - Jan. 7th, 2019).
Fig. 1 shows the actual and forecasted price from Eq. (1) for the validation period.
The long term forecasting methods are generally used in
understanding the possible trend of electricity price for the evaluation of investment decisions where the exact hourly prices are not essential; therefore, as seen in Fig.1 the method indeed captures the trend of price in off-peak and on-peak hours; however, the hourly residual is significantly high on Saturday night time and Sunday peak hours.
In order to verify the effectiveness of each predictor in Model 1 on electricity price forecasting; a combinatorial study
is performed to understand the correlation of having or avoiding a predictor in the model. The total of 18 predictors indeed creates 262,143 different models. Once all combinations are tested, a success rate measure is defined. The success rate of having the predictor k is the ratio of the number of combinations, which includes the predictor k, with less or equal error than the average error of combinations with no predictor k.
For all combinations, the success rates are more than 50% with the lowest success rate on with 63% and the highest success rate on with 93% as shown in Fig. 2. Therefore, no update on Model 1 is adopted.
Fig. 2 Success rate evaluation for 18 predictors B. Short Term Forecasting
The main obstacle of the long term forecasting model (1) is the significant lack of identifying the unexpected spikes in the hourly price within the day. This further motivates our study of examining the impact of historical electricity price data on short term forecasting. The addition of past price to the model indeed reduces the effectiveness of the model on the long term forecast because of the error propagation within the model [6]. However, the problematic part of error propagation is neglected if the model is only used to forecast the next day. Therefore, two more predictors are included in the short-term forecasting model as in (3).
= + + + +
+ + ℎ ̂ (3)
ℎ ̂ = 1 ̂ + 1 ̂ (4) where d and w are the indicators for the day and week. In (4) for example, using d=1 makes the first term the previous day same hour price, and using w=2 makes the second term the average of the last two-weeks same-day same-hour price.
In order to evaluate the impact of d and w on the improvement of the mean absolute percentage error (MAPE), a trial-and-error method is adopted, varying the number of days from 0 to 14, and the number of weeks from 0 to 14. This trial creates 225 (15×15) possible d-w pairs. The MAPE of hourly price forecast as an error measure is calculated as in (5).
Fig. 1 Forecast with Model 1 vs real price for the validation period of Jan 5th - Jan. 7th, 2019
= 1 − (5) where A is the actual price vector and the F is the forecasted price vector, and n is the number of hours in the validation period.
After all 225 pairs are enumerated with respect to the short-term forecasting model, a heat map can be obtained corresponding to the MAPE values on the validation day as shown in Fig. 4. The lowest MAPE is 15.06% which occurs when d=1 and w=2.
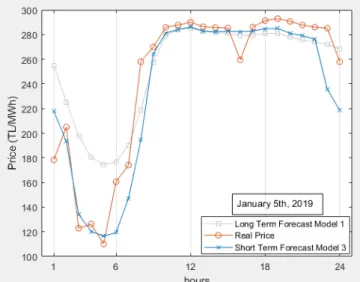
The short term forecasting model, (3), captures the missing features discussed in Section II.A. Therefore, three-days-ahead ex-post forecasting for the “validation period” is illustrated in Fig. 5.
The addition of past electricity price as a predictor to the model indeed captures the salient features of (1) by reducing the high residual observed on off-peak hours. Especially, the reduction of an error on Saturday night is important; therefore, to focus more on the improvement in short-term forecasting, Jan. 5th, 2019 is selected and illustrated in Fig. 3 to show the
comparison of the results from the long and short-term forecast models.
III. NATURAL GAS MARKET EFFECT
The Turkish natural gas market was found in Sept. 1st,
2018 by EXIST and is in operation since then. Therefore, the only available data for the natural gas price in Turkey by a central market starts from Sept. 1st, 2018. The aim of this study
is to evaluate the impact of having the past natural gas prices as a new predictor on short-term electricity price forecasting. Therefore, the same methodology that was adopted for adding the past electricity price as a predictor into the model is also applied here. Therefore, two more predictors are included in the new model as shown in (6).
= + + + + + + ℎ ̂ + (6) = 1 24 + 1 168 (7)
where d and w are the indicators for the day and week, and is the hourly natural gas price. In (7) for example, using d=1 Fig. 4 Heat map of MAPE values in % for short term forecasting model on the validation day
d/w 0 1 2 3 4 5 6 7 8 9 10 11 12 13 14 0 15,59 15,85 16,26 17,26 18,19 17,99 17,97 18,29 18,38 19,43 20,72 20,62 21,90 20,63 19,98 1 15,57 15,06 16,04 15,46 16,71 16,69 17,23 17,51 17,72 18,49 19,35 19,07 20,33 19,03 18,71 2 15,25 16,02 15,84 16,84 17,35 17,37 17,83 18,10 18,34 18,95 19,48 19,30 20,25 19,18 18,80 3 15,77 16,29 16,29 17,68 18,10 18,23 18,68 18,94 19,30 19,73 20,14 19,91 20,82 19,78 19,56 4 17,33 18,97 17,61 18,95 19,37 19,52 19,91 20,18 20,44 20,82 21,11 20,82 21,60 20,45 20,48 5 17,91 18,78 18,15 19,47 19,94 20,10 20,49 20,74 21,02 21,33 21,61 21,29 21,96 20,76 20,99 6 19,27 20,57 19,28 20,51 20,96 21,14 21,45 21,67 22,06 22,20 22,51 22,18 22,69 21,15 21,84 7 19,27 20,26 19,04 20,04 20,48 20,68 20,92 21,10 21,56 21,72 22,05 21,71 22,25 20,66 21,37 8 18,79 19,70 18,68 19,67 20,14 20,31 20,55 20,72 21,09 21,36 21,66 21,28 21,85 20,28 20,77 9 18,10 18,86 18,18 19,19 19,65 19,79 20,06 20,21 20,59 20,98 21,28 20,82 21,43 19,84 20,16 10 17,90 18,72 17,91 18,95 19,39 19,51 19,82 19,94 20,44 20,84 21,26 20,78 21,41 19,73 20,14 11 18,13 19,04 17,99 19,07 19,48 19,62 19,93 20,08 20,60 21,03 21,49 21,00 21,62 19,95 20,31 12 18,56 19,60 18,34 19,42 19,83 19,95 20,26 20,41 20,90 21,34 21,85 21,38 21,96 20,30 20,64 13 18,76 19,90 18,59 19,70 20,08 20,25 20,52 20,68 21,16 21,59 22,16 21,75 22,29 20,63 20,95 14 19,01 19,97 18,66 19,62 19,97 20,16 20,40 20,53 20,96 21,42 21,98 21,58 22,12 20,44 20,65
Fig. 5 Forecast with Model 3 vs real price for the validation period
makes the first term the previous day natural gas price, and using w=2 makes the second term the average of the last two-weeks daily prices.
Varying the number of days from 0 to 30, and the number of weeks from 0 to 14. This trial creates 465 (31×16) possible d-w pairs. After all-pairs are enumerated with respect to the aggregated model (6), a heat map can be obtained as shown in Fig. 6. The lowest MAPE is 14.26% when d=15 and w=2. The aggregated model given in (6) captures the missing features of the model (3). Therefore, three-days-ahead ex-post forecasting for the “validation period” is illustrated in Fig. 7.
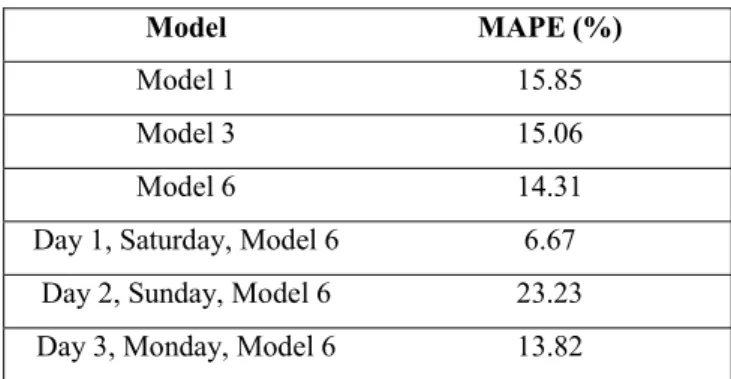
TABLE 1. MAPE values of all models
Model MAPE (%)
Model 1 15.85 Model 3 15.06 Model 6 14.31 Day 1, Saturday, Model 6 6.67
Day 2, Sunday, Model 6 23.23 Day 3, Monday, Model 6 13.82
The forecast of Model 6 indeed looks like the forecast of Model 3; however, the MAPE is reduced significantly. Due to the fuel mix of Turkish energy industry being led by gas-fired power plants during the daytime, Model 6 is expected to show improvement on on-peak hours. Fig. 6 shows the expectations are accurate by having an almost 100% accurate forecast on Saturday peak hours. The model also accurately forecast the sudden decrease in the price on the night between Sunday and Monday. However, Model 6 also reveals that the price forecasting is not only dependent on the known and the expected predictors but also dependent on the predictors that are not captured in the model yet.
IV. DISCUSSION &CONCLUSION
The aim of this study is to examine the impact of the natural gas market price on the electricity price forecasting in the Turkish day-ahead market. The study initialized with a Fig. 6 Heat map of MAPE values in % for the aggregated model on the validation day
d/w 0 1 2 3 4 5 6 7 8 9 10 11 12 13 14 0 14,61 15,06 14,33 14,31 14,91 15,74 16,60 15,60 15,36 16,21 18,03 19,67 18,36 17,27 19,00 1 14,87 15,32 15,03 15,71 18,38 19,67 18,98 17,45 16,24 16,80 18,41 20,27 18,06 17,71 19,47 2 15,06 15,36 15,18 16,07 19,70 21,35 20,13 18,53 17,20 17,75 20,82 22,87 20,31 20,02 21,81 3 15,11 15,07 15,08 16,12 20,37 22,41 20,82 19,30 17,76 17,72 22,35 24,03 21,57 22,28 24,99 4 15,64 15,04 15,25 16,20 21,16 23,71 21,67 20,44 18,95 18,01 23,90 25,40 22,50 25,91 30,12 5 15,44 14,83 14,98 15,68 20,57 23,78 21,73 20,76 19,53 18,37 25,71 26,96 23,03 30,08 37,80 6 14,54 14,55 14,57 15,03 19,03 22,57 20,65 19,29 18,48 16,52 23,67 24,92 20,29 30,10 42,70 7 14,61 14,61 14,52 14,79 18,26 22,32 20,79 19,58 18,45 16,95 21,96 23,54 18,95 30,38 48,82 8 14,96 14,56 14,41 14,55 17,36 21,69 20,42 19,23 18,31 17,06 19,94 20,75 17,06 26,74 47,67 9 15,01 14,50 14,35 14,39 16,69 20,93 20,00 18,77 17,96 16,77 17,22 19,78 16,62 24,06 39,79 10 14,92 14,49 14,33 14,34 16,32 20,50 19,98 18,92 18,03 17,02 16,36 20,37 16,52 23,52 35,74 11 14,77 14,49 14,33 14,33 16,08 20,18 20,13 19,23 18,37 17,84 17,02 21,95 16,59 24,84 34,27 12 14,70 14,49 14,33 14,32 15,89 20,00 20,38 19,61 18,76 18,88 18,48 25,26 17,13 30,19 38,59 13 14,55 14,44 14,33 14,32 15,69 19,58 20,39 19,60 18,84 19,23 18,11 27,35 17,29 34,20 41,69 14 14,52 14,33 14,33 14,31 15,53 19,24 20,47 19,66 18,63 19,05 18,00 27,52 17,34 33,19 36,87 15 14,50 14,26 14,26 15,34 14,31 18,76 20,33 19,35 18,19 18,55 17,37 25,98 16,90 28,81 31,11 16 14,52 14,29 14,29 14,31 15,22 18,47 20,42 19,40 18,16 18,94 17,97 27,26 16,87 28,65 30,85 17 14,55 14,30 14,29 14,31 15,13 18,21 20,52 19,51 18,17 19,37 18,70 29,18 17,20 30,14 33,58 18 14,57 14,31 14,31 14,31 15,06 17,84 20,45 19,42 17,92 19,23 18,72 28,71 17,12 28,63 34,20 19 14,64 14,31 14,32 14,31 14,98 17,44 20,36 19,33 17,62 18,76 18,31 25,74 17,05 26,48 35,27 20 14,62 14,32 14,32 14,31 14,92 17,05 20,17 19,12 17,30 18,16 17,75 21,71 17,04 24,67 37,43 21 14,79 14,31 14,31 14,31 14,89 16,80 20,06 19,09 17,14 17,91 17,63 19,71 16,62 21,12 32,16 22 14,65 14,31 14,31 14,32 14,89 16,71 20,15 19,32 17,23 18,24 18,32 21,01 16,61 20,25 31,34 23 15,03 14,36 14,38 14,37 14,89 16,59 20,32 19,74 17,54 18,98 19,25 22,79 16,79 21,27 34,38 24 15,62 14,50 14,59 14,51 14,91 16,53 20,40 20,08 17,82 19,49 20,05 23,51 16,75 22,11 34,59 25 16,31 14,65 14,88 14,63 14,89 16,38 20,22 20,19 17,94 19,79 20,58 23,79 16,78 21,29 28,09 26 16,41 14,67 14,91 14,62 14,91 16,33 20,16 20,43 18,23 20,40 21,83 24,84 17,89 23,60 29,41 27 16,91 14,75 15,11 14,69 14,91 16,25 19,90 20,46 18,42 20,62 22,54 24,95 18,79 24,95 30,28 28 18,26 14,91 15,53 14,89 14,91 16,16 19,68 20,46 18,62 20,64 22,83 24,90 19,00 23,63 27,90 29 18,66 14,89 15,59 14,85 14,91 16,14 19,48 20,43 18,88 20,67 23,08 25,39 19,83 25,23 27,86 30 19,49 14,97 15,91 14,94 14,99 16,15 19,27 20,49 19,21 20,89 23,69 26,23 20,57 28,18 31,23
which shows promising results in understanding the trend of electricity price in the long run. The long-term forecasting model is useful in investment decision support tools or in energy policymaking research. However, Model 1 shows salient features on capturing the hourly price variation on a daily basis. Therefore, two predictors (based on the past electricity price) are included in the model that may reveal the correct hourly variance on the DAM price. A deterministic test is adapted to calculate the optimal use of past prices in this study. The test results show that last-day same-hour price and the last-week same-hour price are two best predictors that lower the MAPE of the model.
To finalize the study, two more predictors that are derived from the past natural gas market prices are also tested to see the impact on electricity price forecasting. The Model 6 is promising in the sense that it lowers the MAPE of the validation period by 1%; moreover, it also reached 6.67% error on a Saturday.
The study results show that there are certain hours in a day where the use of natural gas price can be helpful to imperfect the forecast; however, the results also show that the electricity price formation may be independent of the natural gas price for off-peak hours. This discussion can be extended into a new study in the future to develop a new forecasting model for both on and off-peak periods.
Due to the limited number of samples from the natural gas market price dataset because of the new foundation of the market in Turkey, the MAPE values can decrease even more with the increased number of samples to be used as training data set.
ACKNOWLEDGMENT
The case studies are performed by Oguzhan G. Poyrazoglu, a mechanical engineering B.Sc. student, under the supervision of Asst. Prof. Gokturk Poyrazoglu during the month of January 2019.
REFERENCES
[1] EXIST, Organized Natural Gas Market Has Started, [Online]
https://www.epias.com.tr/en/announcements/market/natural-gas/organized-natural-gas-market-has-started (Last seen on Jan. 29th,2019)
[2] EMO, Installed capacity of Turkish Electric Grid 2012 Presentation. [Online] http://www.emo.org.tr/ekler/ad33665364cf4ce_ek.pdf (Last seen on Jan. 29th, 2019)
[3] EMO, Installed capacity of Turkish Electric Grid 2018 Presentation. [Online] http://www.emo.org.tr/genel/bizden_detay.php?kod=88369 (Last seen on Jan. 29th, 2019)
[4] R. S. Poats, "The spark spread as a measure of wholesale electricity's economic reliability," 2002 IEEE Power Engineering Society Winter Meeting. Conference Proceedings (Cat. No.02CH37309), New York, NY, USA, 2002, pp. 967-968 vol.2.
[5] Omer Koc, Sistemi ayakta tutmak için ihtiyacımız olan santrallerin yaşam mücadelelerine devam etmesini nasıl sağlarız? [Online], https://www.linkedin.com/pulse/sistemi-ayakta-tutmak-i%C3%A7in- ihtiyac%C4%B1m%C4%B1z-olan-santrallerin-%C3%B6mer-ko%C3%A7/ (Last seen on Jan. 29th, 2019)
[6] P. Wang, B. Liu, T. Hong, Electric load forecasting with recency effect: A big data approach, International Journal of Forecasting, Volume 32, Issue 3, 2016, Pages 585-597,