The ISE Finance Award Series Volume:2
The ISE Finance Award Paper Honorable Mention - International Conference in Economics at the Middle East Technical University in 2000
ARE THE EUROPEAN MARKETS INTEGRATED? EVIDENCE FROM FRENCH STOCKS CROSS-LISTED ON THE GERMAN MARKET
Ash Bayar * Bilkent University Faculty of Business Administration
Bilkent, Ankara 06533, Turkey Phone: (90-312) 290-2046 e-mail: [email protected]
and Zeynep Onder Bilkent University Faculty of Business Administration
Bilkent, Ankara 06533, Turkey Phone: (90-312) 290-2038 e-mail: [email protected]
Abstract
This study examines the behaviour of French stocks that are cross-listed on Xetra for the period between May 1998 and November 1999. It is found that after French stocks are cross-listed in the German market, their exposure to local market risk declines and their exposure to the world market risk increases significantly. The results are consistent with the market segmentation hypothesis. Similar results are observed when stocks are grouped into size por(folios and book value-to-market value porifolios. The analysis of the abnormal returns also supports a significant decline in stock returns aier cross-listing.
JEL classification code: G 15. * Corresponding author.
I. Introduction
The integration of the capital markets has received the attention of several researchers recently. Most of the studies examine whether several exchanges in the world have integrated with the U.S. markets 1, and their results support segmentation hypothesis. Since the European Union aims at the economic, commercial and political integration of the European countries, as a part of this integration, it is interesting to examine whether European capital markets are integrated or segmented. This paper tries to achieve this purpose by examining the behaviour of French stocks that are cross-listed on the Gennan electronic stock market, Xetra.
In the integrated capital markets, similar financial instruments should provide the same risk adjusted expected returns. On the other hand, in the completely segmented markets, it is possible to get different risk adjusted expected returns from similar financial instruments since only national factors affect pricing of these financial instruments.
The cross-listed stocks provide a mechanism to test the level of integration
of capital markets. 2 E1rnnza and Losq (1985) and Alexander, Eun, and
Janakiramanan (1987) develop an equilibrium model for the pricing of stocks that are traded in both domestic and foreign markets. They show that if the markets are segmented, the equilibrium price will increase and the expected rate of return on the stock will decline after cross-listing. If investment barriers, such as transaction cost, regulatory restrictions, taxes, infomiation limitations, are the reasons for the existence of segmented markets, we do not expect to observe a segmented markets in
1 There are few studies in the literature that have not examined the U.S. markets. For example,
Serra ( 1999) examines stocks listed in emerging markets and London (SEAQ-1) in addition to U.S. markets; Centeno and Mello (1999) analyze the integration of European money markets; Rouwenhorst ( 1999) investigate the importance of industy or country effects in stock returns in European stock markets.
2 In recent years, an increase in the cross-listings of stocks has been observed. For example, in 1996, 383, in 1997, 730 and in 1998, 930 foreign stocks were started to trade on German stock exchanges. There are several reasons for cross-listing of stocks. Saudagaran ( 1988)
groups them into four groups: financial factors, management and public relations, political fact0rs, and employee motivation. First, if firms' stocks are traded on segmented and illiquid domestic market, listing on a liquid market reduces the cost of capital. Second, cross-listing increases the potential investor base and hence, the demand for the stock. Moreover, cross-listing may create an oppo11unity for foreign acquisitions and mergers. In addition, since it rises corporate visibility, marketing efforts of the firm may become easier. Third, cross-listing eliminates some problems that a foreign investor may face because of the differences in language, currency, financial reporting system, and auditing practices. Finally, if the firm has foreign subsidiaries, the listing of the stock in the foreign country may increase the motivation of foreign employees. Furthermore, Saudagaran and Biddle ( 1995) identify two more reasons for cross-listing: disclosure level and existence of large markets for the firm's product. They show that firms will more likely to list on foreign stock exchanges with lower financial disclosure levels than their domestic market, and they prefer to list on foreign stock exchanges in the countries where they have large market share for their products.
the European Union (EU) countries since several steps have been taken to have an integrated market. For example, European investors do not need to hedge their investments against changes in exchange rates because of having a single cun-ency. In addition, investment firms that satisfy the regulatory requirements in any EU country can trade on other EU markets, eliminating trading barriers for investment firms. Moreover, because of the increase in competition among European stock exchanges, after new electronic trading system (SuperCAC) started to be used in Paris Bourse in April 1995, new electronic stock exchanges, such as EASDAQ, EURO.NM, and Xetra, have sta11ed to operate, and electronic trading network has increased (Srinivasan, 1999). Furthennore, some studies such as Beckers ( 1999), Steely, Steely, and Pentecost (1998), Jochum (1999) suppo11 the integration of money markets in the EU countries.
In this paper, the behaviour of French stocks is examined before and after they are listed on the Xetra, the electronic trading stock exchange market of Deutsche Bourse, for the period between May 1998 and November 1999. Because of the recent developments and the elimination of several restrictions for trading in European markets, it is hypothesized that two European member countries, French and Gennan markets, are not segmented. Hence, when French stocks are cross-listed at the Gennan electronic stock exchange, it is expected that there is no change on the expected rates of returns of French stocks.
Unlike the previous studies that examined the behaviour of European stocks that are listed in other European markets, several restrictions are imposed to the selection of cross-listed stocks into the sample in order to eliminate the impact of other factors that might affect the behaviour of stock prices. First, the stocks with cross-listing days in other markets that were very close to the first trading day at Xetra, are not included in the sample, eliminating the effects of other cross-listings on the behaviour of the stocks. Second, the stocks with dividend payment dates that were very close to their first trading date on Xetra, are excluded from the sample, in order to eliminate the impact of dividend announcements on the behaviour of stocks. Third, earnings announcement dates are searched, and it is found that in France, all of the firms have to make earnings announcements in March, and none of the firms in our sample has earnings announcement dates close to their first trading date on Xetra. Hence, the effects of other events on the pricing of stocks are eliminated making the results of this analysis more robust in terms of data. The results show that the exposure to local market risk declines and the exposure to global market risk increases significantly after cross-listing, suggesting that French and German markets are segmented.
This paper is organized as follows. Section II presents the relevant literature about cross-listing. Section III identifies testable hypotheses. The data and the methodology used in the analysis are presented in Sections IV and V. Section VI summarizes the results. Section VII concludes the paper.
II. Literature Review
The behaviour of cross-listed stocks has been analyzed by many researchers. Several explanations have offered for the decline in stock returns after cross-listing, and
these explanations have been tested empirically for several markets. Among them, the explanations offered by Amihud, and Mendelson ( 1986), Merton ( 1987), Alexander, Eun, Jankiramanan (1987), and Dharan and Ikenberry (1995) are the most frequently tested ones.
The first explanation is offered by Amihud and Mendelson ( 1986). They explain the decline in the rate of return after cross listing with respect to liquidity measured by bid-ask spread. If the stock is listed in the more liquid market, investors will require lower rate ofreturn.
Norohan, Sarin, and Saudagaran ( 1996) investigate the spread and the depth ofNYSE/AMEX stocks that are cross-listed on London and Tokyo Stock Exchanges for the period between 1983 and 1989. They find that there is no difference in bid-ask spreads between pre-listing and post-listing periods for the entire sample and for the sample of stocks listed in London. However, bid-ask spreads significantly increase for the stocks that are cross-listed on the Tokyo Stock Exchange. Their analysis shows that spread is less sensitive to price after dual-listing and more sensitive to volume for the entire sample and for the sample of stocks listed on the London Stock Exchange.
Khan, Baker, Kennedy, and Perry (1993) investigate the effects of dual domestic listing of 137 AMEX and NYSE listed stocks on Pacific and Midwest Stock Exchanges on the shareholders wealth between 1984 and 1988. They show that the increased bid-ask spread by the specialist to compensate the decline in volume resulting from increased competition is a potential explanation for the negative abnormal returns observed in the post listing period. However, even though such an explanation is made, no analysis is made about the difference in volume between pre-listing and post-listing periods.
The second explanation is called Me1ton 's (1987) investor sentiment hypothesis. He identifies that market risk is not the only factor that detennines the expected returns, investor recognition factor also affects returns. Investors invest only in those securities that they are aware of. Therefore, if the finn has a relatively smaller shareholder base, its recognition will be low, and the finn-specific risk will be high. Hence, with cross-listing, the number of investors that are aware of this stock will increase, and market value of the shares increases reducing the required rate of return. Foerster and Karolyi (1999) support this hypothesis for the non-U .S. stocks cross-listed on the U.S. exchanges. They find that the change in the investor base of the non-U.S. finns depends on their listing location.
Alexander, Eun, and Jankiramanan ( 1987) provide another explanation on the changes in the behaviour of stock prices after cross-listing by examining an equilibrium asset pricing problem arising from the dual listing of stocks. They show that when capital markets are completely segmented before cross-listing, ceteris paribus, a decline in the required rate of returns of cross-listed stock is observed as long as the covariance of the cross-listed security with its local market p01tfolio is larger than the covariance with the market portfolio of the stock exchange where it is cross-listed.
Following Alexander, Eun, and Jankiramanan (1987), several researchers have analyzed the cross-listing of stocks in order to test the level of integration
versus segmentation across capital markets. They test the hypothesis that when markets are segmented, after cross-listing, exposure to local market risk will decline but exposure to global market risk will increase. For example, Jorion and Schwartz ( 1986) examine the integration versus the segmentation of Canadian stock market relative to North American stock markets. Using monthly return data of Canadian stocks cross-listed on the US stock exchanges between 1963 and 1982, they show that Canadian and North American stock markets are segmented, and legal barriers, such as restrictions on ownership of foreign securities, are the reasons for the segmentation.
Like Jorion and Schwarts ( 1986), Foerster and Karolyi ( 1993) examine the integration of Canadian and US stock exchanges. They analyze the behaviour of Canadian stocks listed on both American and Canadian stock exchanges for the period between 1981 and 1990. They find that indust1y has great effect on the behaviour of cross-listed stocks: even though Canadian non-resource stocks are segmented from US markets, non-resource markets are not.
Foerster and Karolyi (1999) analyze the effects of cross-listing on prices and risks of 153 non-US stocks that are cross-listed in the US markets (NYSE, NASDAQ, and AMEX) between 1976 and 1992. They examine the stocks of firms from Canada, Europe, and Asia-Pacific Basin regions. They find that the average beta on the local market excess return is close to one and the average beta on the global market excess return is smaller but still statistically different from zero in the pre-listing period. In the post-listing period, the beta for the local market declines and it is statistically significant. However, they do not observe any statistically significant change in the global market betas. Moreover, Chow tests suppmt the existence of break point. In addition, they find abnonnal returns even after adjusting for changes in risk. It means that the abnormal returns around cross-listings are robust to changes in expected returns that are captured by changes in beta. They find different results when they analyze countries separately. In Europe and UK, there is a general increase in cumulative abnonnal returns for the entire pre- and post-listing periods. In Asia, no significant change in abnonnal return is observed. However, in Australia and Canada, the cumulative abnormal returns increase in pre-listing period but they decline after cross-listing. The results for Canada are consistent with the results obtained by Jori on and Schwa11s (1986), and Foerster and Karolyi ( 1993 ).
Serra (1999) investigates the effects of cross-listing on 70 finns from I 0 emerging markets that are cross-listed on NYSE, NASDAQ, and SEAQ-1 between 1991 and 1995. She finds that markets are segmented because abnonnal return is positive before cross-listing but it declines after cross-listing.
Oran (1999) examines the changes in risk-return relationships and abnormal returns of 71 non-US stocks of firms from Canada, Europe and Latin America after the announcement of cross-listing on the NYSE between 1980 and 1996. He finds a significant change in risk-return relationship and an increase in abnomrnl returns just before the cross-listing announcement. Moreover, he tests whether the differences in accounting policies originate any difference in the effects of cross-listing. However, no significant evidence supporting such a difference is found.
Howe and Madura ( 1990) test the integration or segmentation of the capital 85
markets by analyzing the changes in the domestic beta and foreign beta of the stocks after the cross-listing. They use the U.S. stocks that are cross-listed on Gennany, France, Japan or Switzerland between 1969 and 1984. No significant changes in domestic beta, foreign beta, and standard deviation are found after cross-listing. They identify two possible reasons for these results: markets are well integrated or cross-listing does not reduce segmentation.
The last explanation is specified as the pre-selection bias by Dharan and Ikenberry ( 1995). Their empirical analysis supports the idea that initial listing requirements on the exchange are discouraging for small finns. However, managers of these finns apply for listing before a decline in the finn's perfonnance. So, unlike large finns, the long-run negative drift of post-listing return of small finns is observed.
In addition to these four explanations, Dowowitz, Glen and Madhaven (1998) develop a theoretical model to explain the effects of cross-listing on the behaviour of the stocks in a market where acquiring infom1ation is costly. Three effects of cross-listing are identified depending on the degree of inter-market informational linkages: (I) if inter-market infonnation linkages are perfect, cross-listing increases the total number of traders, that leads to a decline in spreads, an increase in the precision of public infonnation and an increase in the liquidity in both markets; (2) if inter-market infonnation linkages are very poor, after cross-listing liquidity declines and price volatility increases in the domestic market; (3) if inter-market infonnation linkages are imperfect, inter-market spreads decline, price volatility increases, and liquidity declines in the domestic market due to order flow migration. They test their model using Mexican stocks cross-listed on ADR between 1989 and 1993. They find that after cross-listing, liquidity declines, price volatility increases and spreads decline in the Mexican Stock Exchange because of the increased competition. Thus, their results suggest that impacts of cross-listing are complex.
Jayaraman, Shastri, and Tandon (1993) examine the effects of the listing of American Depository Receipts on the risk and return of the stocks using the daily closing price data of 95 stocks ( 44 Japanese stocks, 30 English stocks, and 21 other stocks) between 1983 and 1988. The comparisons of excess returns and variances for pre- and post-listing periods show that both return and variance increase after cross-listing. Moreover, they find that the existence of informed traders increases volatility after cross-listing because the informed traders start to trade on both markets and gain more due to infonnation differentials in these markets.
Most of these studies provide support for the segmentation of capital markets by examining cross-listing in the U.S. markets. They show that there are positive abnonnal returns in pre-listing period, and negative abnormal returns in post-listing periods. However, although there are only very few studies examining the integration/segmetation of European markets, none of them has examined this issue by investigating the behaviour of cross-listed stocks. For example, in their recent study, Centeno and Mello ( 1999), and Rouwenhorst ( 1999) find that market segmentation has still observed among the members of EU countries. For example, Centeno and Mello (1999) test the integration of money market and the bank loans markets for six EU countries, Gennany, the UK, France, Italy, Spain, and Portugal
between 1985 and 1994. They find that even though the domestic money markets are closely linked, domestic banking markets are segmented. On the other hand, Rouwenhorst ( 1999) investigates whether differences in the pricing of stocks among European countries are disappearing using monthly returns of 952 stocks from twelve European countries for the period between 1978 and 1998. He shows that country effect is larger than the industry effect. Moreover, country effect is found to be higher in European Monetary Union (EMU) countries than that in non- EMU countries. This result suggests that country selection is important for the pricing of the stocks in the second half of 1990.
III. Hypotheses and Data
This study examines the French stocks that are cross-listed on the Xetra, the German electronic stock exchange. France and Germany are two leading countries in European Union, and up to now, some progresses, such as the removal of trading barriers in capital markets, towards the integration of the markets of these countries occurred. These markets can be considered as well integrated. Hence, no change in the risks and returns of the stocks after cross-listing are expected in these countries.
The following null hypotheses are tested in this study using the French stocks that are cross-listed on the Xetra:
HJO: The beta of French market index will not change after cross-listing. H20 : The beta of world index will not change after cross-listing.
H30 : Cross-listing will not affect the returns of the stocks.
There are 70 French stocks that are cross-listed on both Paris Bourse and Xetra during the sample period between the first trading date of Xetra, November 29 1997, and November 1999. Out of 70 stocks, 55 of them were staited to trade on Xetra during 1998, and the rest during 1999. The stocks in sample are highly liquid and large-size stocks. 3
Several restrictions are imposed on the stocks in order to eliminate the impact of other events that might affect the behaviour of stock prices in addition to cross-listing. First, stocks that were cross-listed on other exchanges on a day very close to their first trading date on Xetra are eliminated. This procedure results in the exclusion of 33 French stocks whose first trading dates on other markets are close to the one on Xetra. Hence, with this procedure the effects of other cross-listings on the behaviour of the stocks are eliminated4 •
Second, it is known that stock prices react to dividend announcements (for example, see Aharony and Swary (1980), and Kwan (1981)). Therefore, if there is a dividend payment in one-month window around the cross-listing date, those stocks are eliminated from the sample. There are only two stocks satisfying this restriction.
Third, the stocks traded on only the Reglement Mensue segment of the
3 For example, the mean (median) market value of stocks listed in the Reglement Mensue section of the Paris Bourse is 3,137 (874) Euros. However, the mean (median) market value of the French stocks cross-listed in the German market is much higher 5,492 (3,767) Euros.
4 Listing dates on the other stock exchange markets are obtained from the web pages of the
corresponding markets.
Paris Bourse are included in the sample in order to eliminate the effects of the segment differences on the pricing of stocks. Stocks are traded in the different segments of the Paris Bourse depending on their trading volume and liquidity.5 The largest and most liquid stocks are traded on monthly settlement basis, and there are few restrictions on margin trading and short selling in the Reglement Mensue. Since these stocks are large and highly liquid stocks, with this restriction the problem of non-synchronous trading is eliminated. In our sample, only 4 stocks are not traded on Reglement Mensue, so the elimination of those stocks reduces our sample to 31 stocks that are traded on Reglement Mensue.
Lastly, earnings announcement dates are checked and the announcement dates are found to be at least two months before the first trading dates. Hence, earnings announcement dates do not affect returns on cross-listing date. None of the French stocks were delisted from Xetra since the first trading date on Xetra, November 29 1998, until November 1999. So, in our study, there is no survivorship bias identified in Sanz and Breen (l 986).
The final sample consists of 27 stocks that are cross-listed on Xetra during 1998. In the analysis, data for daily closing price of the stocks, market and world indices, and market value and book value of the stocks are used. All of them are obtained from the Datastream. They adjust prices for dividend payments and stock splits. Infonnation about cross-listing dates are obtained from Xetra.
IV. Methodology
Event study methodology is used in the analysis. Event window is specified as -250 and +250 days with respect to cross-listing date. This period COITesponds to approximately one year before and after cross-listing.
a) Calculation of Risk Adjusted Returns:
In order to examine the changes in the risk structures because of cross-listing, the following two-factor model is estimated for the sample:
Rit = ai PRE+
~/RE
RFt + ~iWPRE Rwi+ aiLISTD/IST+ ai'OSTD/OSTt=-250, ... ,0, ... ,250 where Rii is the continuously compounded rate of return calculated using closing prices of stock i on day
t;
ais are constants; ~iF is the coefficient on the French market index return, RF1; ~iw is the coefficient on the world market index return, Rw1;DiiusT is a dummy variable that is equal to I if the observation is the listing day (t=O) and O if not; D/OST is a dummy variable that is equal to I if the observation is from the post listing period (t>O) and O otherwise; Eii represents the error tenn.
All of the returns are denominated in Euro. The French stock market index
5 Biais, Bisiere and Decamps (1999) analyze the consequences of differences in the segments
of the Paris Bourse on the order flows and return process of the stocks. They find that market sell orders are less frequent on the spot market segment than the segment called Reglement Mensue and the spot market segment reflect good news faster than bad news.
and closing prices of the stocks are provided in Euro by the Datastream. The world index is conve1ted from US dollar to Euro by using the US dollar- Euro exchange rate. The Datastream's French stock market index is used as the French stock market index rather than CAC40, because most of the stocks in our sample are included in CAC40.
The world index specified in equation (I) consists of several markets, including French stock market. In order to eliminate the effects of French market on the world index, first the world index is regressed on the French index, and the residuals are taken as Rwr· Hence, the new world index does not include any impact of the French market.
If we do not adjust for site and book-to-market value ratios, a downward bias in abnonnal returns is observed as shown by Dharan and Ikenberry (1995). Therefore, six portfolios are formed depending on the market value of finns and their book value-to-market value ratios. First, the sample of 27 firms are grouped into small, middle and large size portfolios based on their natural break points. Second, the sample is classified into three portfolios based on their book value-to-market value ratios. In the computation of the book value-to-value-to-market values, look-ahead bias is eliminated as advised in Sanz and Breen (1986).6 We assume that
there are three months between the year-end date of the firm and the time balance sheet inforn1ation is available to the investors. Hence, in order to see whether these risk structures change depending on the size of stocks, the model specified in equation (I) is estimated for these six portfolios separately. In addition, since Foerster and Karolyi ( 1993) find some industry differences, this model is also estimated for the six industry groups.
b) Calculation of Abnormal Returns
In the calculation of abnonnal returns the following two-factor model is used:
R;1
=
a;+ ~iF RF1+ ~;w Rw1+ l::;1 (2)Since betas might be different before and after cross-listing, two betas for each index are estimated for each stock. The pre-listing period between -250 and -126 is used to calculate pre-listing betas. The post-listing period between +126 and +250 is used to calculate post-listing betas.
Abnonnal returns are obtained as the difference between the observed return of the stock ion day t and the expected return generated by the model:
where AR;1 is the abnormal return of stock i on day t and E(R;1) represents the expected return of stock i on day t estimated using two-factor market model.
6 Balance sheet information reported at the end of the year is not available to investors until
sometime later in the next year. In the calculation of book-to-market value ratios, if book value is divided by market value before the book value information becomes available to investors, look-ahead bias occurs.
Cumulative abnonnal returns, CAR, .. are calcu.Jated for each stock i on date t by
aggregating abnonnal returns.
T T T
CAR,T ==IAR,,
and
BHAR,r
==fl0+R,,)-Il0+E(R,,))
t=I t=I 1=1
In addition to CARii, buy-and-hold abnormal returns, BHARii, are calculated. By using buy-and-hold abnormal returns, the effects of measurement bias in the CAR calculations are eliminated. The following fonnulae are used in the calculation of CARi, and BHAR;,:
The significance of the abnonnal returns is calculated using the t-test statistics described in Barber and Lyon ( 1997).
N
CAR,,r
=
(II N)"'f,CAR,r•=I
and
N
acARpT
=
(1/(N-l))L,(CAR,7 -CARl',)2 1=1Similarly,
N N
BFIARPT
=
(11 N)"'f,BHAR,T and a,mARpT=
(1/(N -1))"'f,(BHAR,,. - BHARP,)2I=) •=1
where N represents the number of stocks in the portfolio; CARPT is the cumulative abnormal return of the portfolio P on day T; BHARPT is buy-and-hold abnormal return of the portfolio P on day T; and crpT represents cross-sectional standard deviation of portfolio Pon day T. t-statistics are given as follows:
and
Abnormal returns are calculated for market value and book-to-market value portfolios as well. We re-balance these portfolios every 60 days. In each group, almost equal numbers of stocks are included.
V. Results
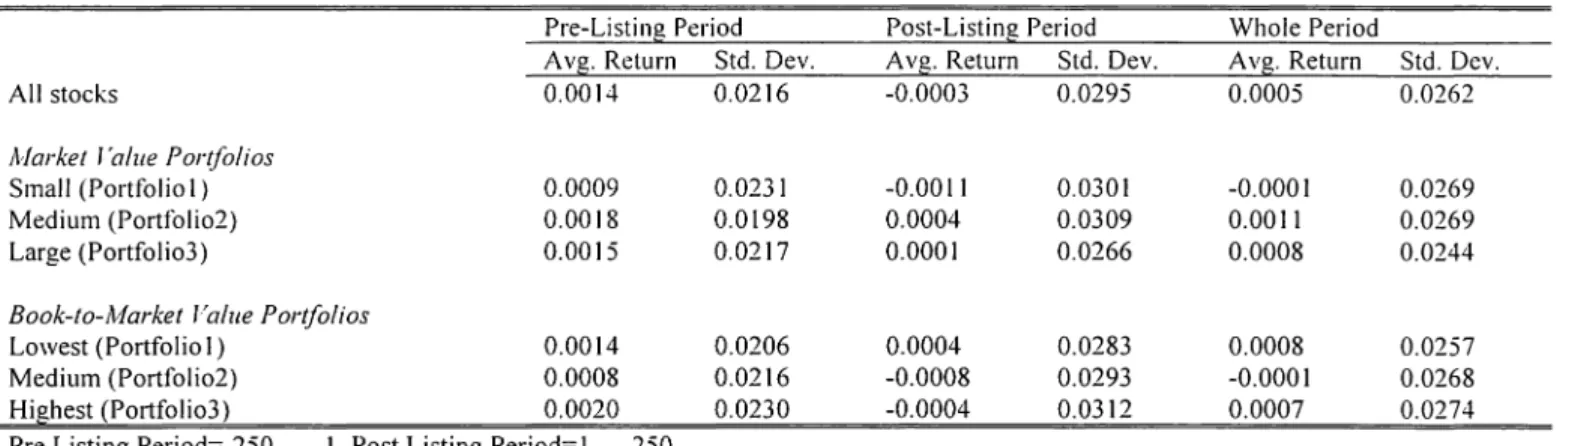
Table I presents the daily mean returns and standard deviations of returns for the whole period and for the pre- and post-listing periods separately. It is observed that for all stocks the mean return is higher in the pre-listing period than the post-listing period. The standard deviations of French stocks are higher after they are cross-listed on the German market. Hence, there is a decline in mean returns but an increase in volatility of returns in the post-listing period. This is also observed for all the prntfolios regardless of their size or book-to-market value ratio.
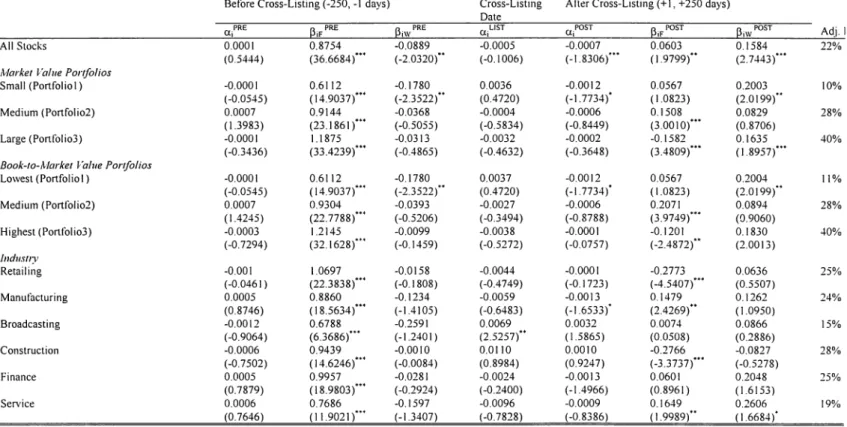
Table II presents the results for the two-factor international asset pricing model. In addition to estimated coefficients, t-statistics are presented in parantheses. t-statistics are calculated using heteroscedasticity and autocorrelation adjusted
standard errors of estimates. The adjusted R2s suggest that the models are moderate in tenns explaining the returns of French stocks cross-listed in the German market.
For the whole sample, in the pre-listing period, the average beta on the French market returns is close to one (0.88) and the average beta on the world market returns is much smaller (-0.09). Both of them are found to be statistically significantly different from zero. Since the sample includes large French firms, the average beta in the domestic market is found to be less than one. On the other hand, there is a decline in the average beta on the French market returns and an increase in the average beta on the world market returns in the post-listing period. Both changes are found to be statistically significant. The average domestic beta declines to 0.06 and the average global beta increases to 0.16. Wald test rejects the hypothesis of the equality of the pre- and post- coefficients on the world index and French index. Hence, this finding suggests that the cross-listed French stocks' exposure to the local market risk declines but their exposure to the world market risk increases with cross-listing. 7 These results suggest that French and German stock markets have not been integrated yet since after the cross listing, exposure to the world market risk increases and exposure to the local market risk declines significantly.
The results of the regression model estimated for the size and book-to-market value portfolios are presented in Table II. Similar results are obtained for these portfolios as well. Hence, when we control the size effect, local and global risks for all portfolios seem to behave similarly: French market beta declines, world index beta increases after cross listing. However, there are slight differences on the significance of coefficients. Even though all pre-listing local market betas are significant for all portfolios, pre-listing world market beta is significant only for small size stocks. Post-listing world market beta is found to be significant for the small and large size portfolios but not for medium size portfolios.
The results are similar for three portfolios grouped according to their book value-to-market value ratios. When we re-estimate the model for each of the three portfolios, a decline in French market beta, and an increase in world index beta are observed after cross-listing. The significance of coefficients on betas is similar to the portfolios grouped based on their market value.
Finally, in order to examine the sensitivity of the results for different industries, stocks are grouped according to the first digit SIC codes.8 The results
suggest that there are differences among industries in tenns of their exposure to local and world market risks after cross listing. All of the betas for local market are found to be significant in the pre-listing period. They all decline in the post-listing period. However, the local beta turns out to be significant only in retailing, manufacturing, broadcasting and services sectors. In addition, although none of the industries has a significant world market risk in the pre-listing period, the finns in services sector
7 In the regression we pool the data, so the beta coefficients can be identified as the average of
the all stocks in the sample. To check the validity of these results for each stock, we re-estimate the model for all of the stocks one by one, and we find that the results are similar to the results of the pooled data.
8 Except for one sector which includes only one stock, for all of the available sectors, analyses
are made again.
have a significant beta on world market after the post-listing. Like the whole sample, the exposure to the world market risk increases for the finns in all industries.
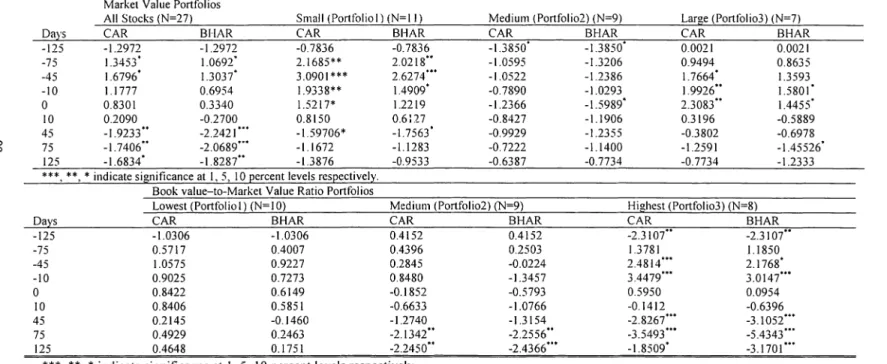
In order to examine the time series patterns of the abnonnal returns in the listing date, a two-factor model is estimated for each stock in the sample. Then, both CAR and BHAR are estimated for each stock and averages of these returns are calculated for the whole sample. Table 3 shows these abnormal returns for the whole sample and for the six p01tfolios grouped based on their market value and book-to-market value ratios. Overall, it is found that there is significant and positive cumulative abnonnal return approximately four and two months before the listing day. These days might con-espond to the announcement of the cross-listing. However, there is no significant abnormal return on the listing day. A significant decline in abnonnal returns is observed after two months. The results are slightly different for the size portfolios. For the small and large sized portfolios, there is significant increase in abnormal returns before the cross-listing day. A significant abnormal return is obtained on the listing day for the large stocks. However, none of the CARs and BHARs is significant after cross-listing.
When the portfolios are formed based on the book-to-market value ratios, results are found to be slightly different. Although no significant abnonnal return is obtained for the stocks with low book-to-market value ratios, there is a significant decline in the abnonnal returns of the medium and large ratio stocks. Interestingly, the stocks in the high book-value-to-market value stocks, CARs and BHARs are statistically significant before the listing. The significant decline in the CARs can be observed in Figures I and 2.
V. Conclusion
This study examines the behaviour of French stocks that are cross-listed on Xetra, Gennan electronic stock market, for the period between May 1998 and November 1999. Ce1,nan and French stock markets can be considered as integrated markets because of the recent developments and the elimination of several restrictions for trading in European markets. However, the results of this study rejected the hypothesis that these markets are integrated. It is found that French stocks' exposure to local market risk declines and their exposure to the world market risk increases significantly after these stocks are cross-listed on the German market. The analysis of the abnonnal returns supports the significant decline in stock returns after cross-listing.
We find the evidence consistent with the market segmentation hypothesis. Since the EU has removed some of the investment restrictions only recently, we may not be able to observe the integration of these markets in this study since our sample includes the stocks that are listed in the Gennan market during 1998. However, as the data become available, if the other French stocks that are cross-listed on Xetra during 1999 are included in the sample, we might observe more integration in these stock markets.
References
Aharony, J. and Swary, I. 1980. "Quarterly dividend and earning announcements and shareholders' returns: an empirical analysis", Journal of Finance, 35( I): 1-12.
Alexander, G., Eun, C. and Janakiramanan, S. 1987. "Asset pricing and dual-listing on foreign capital markets: a note", Journal of Finance, 42 (I): 151-158.
Amihud, Y. and Mendelson, H.1986. "Asset prices and bid ask spread", Journal of Financial Economics, 17: 223-249.
Baber, 8. M. and Lyon, J. D. 1997. "Detecting long run abnonnal stocks returns: empirical power and specification of test-statistics", Journal of Financial Economics, 43(3 ): 341-3 72.
Banz, R. W. and Breen, W. 1986. "Sample-dependent results using accounting and market data: some evidence", Journal of Finance, 41(4): 779-793.
Beckers, S. 1999. "Investment implications of a single European capital market", The Journal of Port.folio Management, 25 (Spring): 9-17.
Biais, 8., Bisiere, C. and Decamps, J. P. 1999. "Sh01t sales constraints, liquidity and price discovery: an empirical analysis on the Paris Bourse", European Financial Management, 5(3): 395-409.
Centeno, M., and Mello, S. A. 1999. "How integrated are the money market and the bank loans market within the European Union?", Journal of International Money and Finance, 18: 75-106.
Conrad, J. and Kaul, G. 1993. "Long-tenn market overreaction or biases m computed returns?", Journal of Finance, 48(1): 39-63.
Dharan, 8. G. and lkenberrym D. I. 1995. "The long run negative drift of post-listing stock returns", Journal of Finance, 50 (5): 1547-1574.
Dimson, E. and Marsh, P. 1986. "Event study methodologies and the size effect", Journal of Financial Economics, 17: 197-226.
Domowitz, I, Glen, J. and Madhaven, A. 1998. "International cross-listing and order flow migration: evidence from and emerging market", Journal of Finance, 53(6): 2001-2027.
E!Tunza, V. and E. Losq. 1985. "International Asset Pricing under Mild Segmentation: Theory and Test," The Journal of Finance, 40 ( 1 ): I 05-124.
Foerster, S. R. and Karolyi, G. A. 1993. "International listings of stocks : the case of Canada and the US", Journal of International Business Studies, 24: 763-784. Foerster, S. R. and Karolyi, G. A. 1999. "The effects of market segmentation and investor recognition on asset prices: evidence from foreign stocks listing in the United States", Journal of Finance, 54(3): 981-1013.
Howe, J. and Madura, J. 1990. "The impact of international listing on risk implications for capital market integration", Journal of Banking and Finance, 14: 1133-1142.
Jayaraman, N., Shastri, K. and Tandon, K. 1993. "The impact of international cross-listings on risk and return: the evidence from American depository receipts", Journal of Banking and Finance, 17: 91-103.
Jochum, C. 1999. "Network economics and the financial markets-the future of Europe's stocks exchanges", Aussenwirtschaft, 54: 49-74.
Jorion, P. and Schwartz, E. 1986. "Integration versus segmentation in the Canadian stock market", Journal of Finance, 41: 603-616.
Kadlec, G. B. and McConnell, J. J. 1994. "The effect of market segmentation and illiquidity on asset prices: evidence from exchange listings", Journal of Finance, 49(2): 611-636.
Khan, W.A. and H.K. Baker, R.E. Kennedy and L.G. Perry. 1993. "Dual Domestic Listing, Market structure and Shareholder Wealth," The Financial Review, 28: 371-383.
Ko, K., Lee, I. and Yun, K. 1997. "Foreign listings, finn value, and volatility: the case of Japanese finns; listings on the US stock markets", Japan and the World Economy, 9: 57-69.
Kothari, S. P., and Warner, J. B. 1997. "Measuring long-horizon security price perfonnance", Journal of Financial Economics, 43: 301-339.
Kwan, C. 1981. "Efficient markets tests of the infonnation content of dividend announcements: critique and extension", Journal of Financial and Quantitative Analysis, 16(2): 193-206.
Lau, T. L., Diltz, J. D. and Apilado, V. P. 1994. "Valuation effects of international stock exchanges listings", Journal of Banking and Finance, 18: 743-755.
McConnell, J. J. and Sanger, G. 1987. "The puzzle in post-listing common stock returns", Journal of Finance, 42: 119-140.
Merton, R. I 987. "A simple model of capital market equilibrium with incomplete information", Journal o.f Finance, 42: 347-376.
Noronha, G., Sarin, A. and Saudagaran, S. M. I 996. "Testing for micro-structure effects of international dual listings using intraday data", Journal o.f Banking and Finance, 20: 965-983.
Oran, A., The Effects of Cross-listing of non-US Firms on the New York Stock Exchange, Texas Tech University, Unpublished Disse1tation.
Rouwenhorst, K. G. I 999. "European equity markets and the EMU", Financial Analysts Journal, 55(May/June): 57-64.
Sundaram, A. K. and Logue, D. E. 1996. "Valuation effects of foreign company listings on U.S. exchanges", Journal of International Business Studies, (First Qua1ter): 67-88.
Saudagaran, S. 1988. "An empirical study of selected factors influencing the decision to list on foreign stock exchanges", Journal of International Business Studies, (Spring): 101-127.
Saudagaran, S. and G.C. Biddle. 1995. "Foreign Listing Location: A Study of MN Cs and Stock Exchanges in Eight Countries," Journal of International Business Studies, 319-341.
Serra, A. 1999. "Dual-listings on international exchanges: the case of emerging markets' stocks", European Financial Management, 5(2): 165-202.
Steeley, P. C. and Steeley, J. 1998."Exchange controls and European stock market Integration", Applied Economics, 30: 263-267.
Table I - Descriptive Statistics of Returns in Pre- and Post-Listing Periods
Pre-Listing Period Post-Listin!): Period Whole Period
Avg. Return Std. Dev. Avg. Return Std. Dev. Avg. Return Std. Dev.
All stocks 0.0014 0.0216 -0.0003 0.0295 0.0005 0.0262
Market l'alue Portfolios
Small (Portfolio 1) 0.0009 0.0231 -0.0011 0.0301 -0.0001 0.0269
'°
Medium (Portfolio2) 0.0018 0.0198 0.0004 0.0309 0.0011 0.0269°'
Large (Portfolio]) 0.0015 0.0217 0.0001 0.0266 0.0008 0.0244Book-to-Market Value Portfolios
Lowest (Portfolio I) 0.0014 0.0206 0.0004 0.0283 0.0008 0.0257
Medium (Portfolio2) 0.0008 0.0216 -0.0008 0.0293 -0.0001 0.0268
Highest (Portfolio]) 0.0020 0.0230 -0.0004 0.0312 0.0007 0.0274
Table 2 - Market Model Regressions With Pooled Data
The following market model is estimated: R;, = a/RE+ 13w PRE RwtRE+ f3;w PRE R;w,PRE+a;LISTD/IST + atOSTD/OST +f3;F POST RiFIPOSTD/OST +f3;w POST R;w,POST
Di1POST+E11 t=-250, ... ,0 .... ,250 In the model, R;, is the logarithmic return of close-to-close prices of the stock i on day t, R;F, is logarithmic return of the
Datastream's French stock market index, and R,w, is the logarithmic return of the Datastream's world index on day t after the effects of French stock. index are eliminated. D;,usT. (=I if t=O, and O otherwise). and D/OST (= I if t>O, and O otherwise) are dummy variables. White's correction is used for heteroskedasticity and autocorrelation corrected standard errors.
Before Cross-Listing (-250, - I days) Cross-Listing After Cross-Listing(+ I, +250 days) Date
CX.iPRE
~;/RE
~i\V PRE CX.iLIST CLiPOST ~if POST ~i\V POST Adj. I
All Stocks 0.0001 0.8754 -0.0889 -0.0005 -0.0007 0.0603 0.1584 22% (0.5444) (36.6684)0
" (-2.0320)0' (-0.1006) (-1.8306)'" (1.9799)" (2.7443)"'
,'vlarket Value Portfolios
Small (Portfolio I) -0.0001 0.6112 -0.1780 0.0036 -0.0012 0.0567 0.2003 10% (-0.0545) (14.9037)'" (-2.3522 )" (0.4720) (-1.7734)' (1.0823) (2.0199)"
Medium (Portfolio2) 0.0007 0.9144 -0.0368 -0.0004 -0.0006 0.1508 0.0829 28% (1.3983) (23.1861)'" (-0.5055) (-0.5834) (-0.8449) (3.0010)'" (0.8706)
Large ( Pon fol io3) -0.0001 1.1875 -0.0313 -0.0032 -0.0002 -0.1582 0.1635 40% (-0.3436) (33.4239)'" (-0.4865) (-0.4632) (-0.3648) (3.4809)"' (1.8957)'"
Book-to-Market Value Portfolios
\0 Lowest (Portfolio I) -0.0001 0.6112 -0.1780 0.0037 -0.0012 0.0567 0.2004 11% -..J (-0.0545) (14.9037)'"' (-2.3522)" (0.4720) (-1.7734)° ( 1.0823) (2.0199)" Medium (Ponfolio2) 0.0007 0.9304 -0.0393 -0.0027 -0.0006 0.2071 0.0894 28% (1.4245) (22.7788)"' (-0.5206) (-0.3494) (-0.8788) (3.9749)'" (0.9060) Highest (Ponfolio3) -0.0003 1.2145 -0.0099 -0.0038 -0.0001 -0.1201 0.1830 40% (-0.7294) (32.1628)°" (-0.1459) (-0.5272) (-0.0757) (-2.4872)" (2.0013) lndu.wy Retailing -0.001 1.0697 -0.0158 -0.0044 -0.0001 -0.2773 0.0636 25% (-0.0461) (22.3838)"' (-0.1808) (-0.4749) (-0.1723) (-4.5407)'" (0.5507) Manufacturing 0.0005 0.8860 -0.1234 -0.0059 -0.0013 0.1479 0.1262 24% (0.8746) (18.5634)"' (-1.4105) (-0.6483) (-1.6533)' (2.4269)" (1.0950) Broadcasting -0.0012 0.6788 -0.2591 0.0069 0.0032 0.0074 0.0866 15% (-0.9064) (6.3686)'" (-1.2401) (2.5257)" (1.5865) (0.0508) (0.2886) Construction -0.0006 0.9439 -0.0010 0.0110 0.0010 -0.2766 -0.0827 28% (-0.7502) (14.6246)'" (-0.0084) (0.8984) (0.9247) (-3.3737)"' (-0.5278) Finance 0.0005 0.9957 -0.0281 -0.0024 -0.0013 0.0601 0.2048 25% (0.7879) (18.9803)"' (-0.2924) (-0.2400) (-1.4966) (0.8961) (1.6153) Service 0.0006 0.7686 -0.1597 -0.0096 -0.0009 0.1649 0.2606 19% (0.7646) (11.9021 )°" (-1.3407) (-0.7828) (-0.8386) ( 1.9989)" (1.6684)'
\0
00
Table 3 - t-Test statistics of Cumulative Abnormal Returns, (CAR) and Buy-and-Hold Abnormal Returns, (81-lAR).
In the calculation of the abnormal returns the following model is used: R;, = a;+ P;F R;F,+ P;w R;w,+ E;1 in the pre-listing period
t=-250 .... ,-124 , and in post-listing period t=+ 124 .... ,+t=-250 In the model. R;, is the logarithmic return of close-to-close prices of the stock i on day t, R;F, is logarithmic return of the Datastream's French stock market index, and R;w, is the logarithmic return of the Datastream's world index on dar t after the effects of French stock index are eliminated.
Market Value Portfolios
All Stocks (N=27) Small (Portfolio I) (N=l l) Medium (Portfolio2) (N=9) Days CAR BI-IAR CAR
-125 -1.2972 -1.2972 -0. 7836 -75 1.3453' 1.0692' 2.1685** -45 1.6796' 1.3037' 3.0901 *** -10 1.1777 0.6954 1.9338** 0 0.8301 0.3340 1.5217* 10 0.2090 -0.2700 0.8150 45 -1.9233" -2.2421'" -1.59706* 75 -1.7406" -2.0689"' -1.1672 125 -1.6834' -1.8287" -1.3876 ***,**,*indicate significance at I, 5, 10 percent levels respectively.
Days -125 -75 -45 -10 0 10 45 75 125
Book value-to-Market Value Ratio Portfolios Lowest (Portfolio!) (N=IO)
CAR BHAR -1.0306 -1.0306 0.5717 0.4007 1.0575 0.9227 0.9025 0.7273 0.8422 0.6149 0.8406 0.5851 0.2145 -0.1460 0.4929 0.2463 0.4648 0.1751 BHAR CAR -0.7836 -1.3850° 2.0218" -1.0595 2.6274'" -1.0522 1.4909' -0.7890 1.2219 -1.2366 0.6:17 -0.8427 -1.7563' -0.9929 -1.1283 -0.7222 -0.9533 -0.6387 Medium (l'or!f_cJlio2) (N=9) CAR BHAR 0.4152 0.4396 0.2845 0.8480 -0.1852 -0.6633 -1.2740 -2.1342" -2.2450" 0.4152 0.2503 -0.0224 -1.3457 -0.5793 -1.0766 -1.3154 -2.2556" -2.4366'" ***,**,*indicate significance at I, 5, 10 percent levels respectively.
BHAR -1.3850° -1.3206 -1.2386 -1.0293 -1.5989' -1.1906 -1.2355 -1.1400 -0.7734 Larg,e (Portfolio3) (N=7) CAR BHAR 0.0021 0.0021 0.9494 0.8635 1.7664° 1.3593 1.9926" 1.5801' 2.3083" 1.4455' 0.3196 -0.5889 -0.3802 -0.6978 -1.2591 -1.45526' -0.7734 -1.2333 Highest (Portfolio3) (N=8) CAR BHAR -2.3107" -2.3107" 1.3781 1.1850 2.4814"' 2.1768' 3.4479"' 3.0147"' 0.5950 0.0954 -0.1412 -0.6396 -2.8267'" -3.1052"' -3.5493"' -5.4343'" -1.8509' -3.1701 '"
I
[_
Figurel. Cumulative abnormal returns for the portfolio of all stocks, and the market value portfolios
CARs of Market Value Portfolios and
the Portfolio of All Stocks
~
-1w.---=~L---=,Ju._----C11~~:.v-.!..4~~~:J:».~!!!!lq,£-~o1:--~I
I-All
~---ii.j...l,p-4----'"'.. ..
1\·l\.J\. ___ -..
---ᵥ \..f\ '\i\ DaysI
______ J
Figure2. Cumulative abnormal returns for the book-to market value portfolios
CA Rs for Book-to-Market Portfolios
1 0 - - P o r t 1 - o -Port2 - P o r t 3 Days 99