TURKEY IS ON THE BRINK OF MIDDLE INCOME TRAP
Seyfettin Gürseland Barış Soybilgen**
Executive Summary
Recently, “the Middle Income Trap” has become one of the mostly debated topics on Turkish Economy. In the last 10 years, per capita income increased from $3,000 to $10,000 in Turkey. But the question is, will this striking increase continue in the next 10 years, and lead Turkey to the group of high income countries, or will the increase in per capita income decelerate, and force Turkey to remain in the group of middle income countries? The government, optimistically, predicts that per capita income in Turkey will reach $25,000 in 2023. However, some economists argue that the increase in per capita income will be much slower from now on, and Turkey will get stuck in the Middle Income Trap. In this research brief, we try to contribute to the discussion by decomposing GDP growth into employment ratio and productivity components during the recent past.
There are three sources of growth considering the factors of production: capital accumulation (in other words the increase in production capacity through investment), the increase in employment, and productivity gains. In the early stages of economic development, capital accumulation and increases in employment are main sources for growth. However, when per capita income exceeds $10,000, there high productivity gains are needed to sustain high growth rates. In this stage (Middle Income), the contribution of capital accumulation and labor force decelerate due to diminishing returns. If productivity gains per worker remains low, per capita income growth also slows down. Before the global crisis (2002-2008), Turkey experienced high growth rates due to strong investment spending (high capital accumulation), increase in non-agricultural employment, and large productivity gains. In addition to these developments, the appreciation of Turkish Lira against USD also helped per capita income to increase quickly.
In the coming years, it is not likely that the Turkish economy will experience another high growth period. Due to high current account deficit and the end of abundant global liquidity, it is hard for the Turkish Lira to appreciate. More importantly, this research shows that the increase in labor productivity has stopped in the last two years. Our findings clearly show that Turkey is on the brink of the Middle Income Trap. For a plausible increase in per capita income, labor productivity should contribute to growth positively and significantly. “How do we make this possible?” is a critical question for the Turkish economy.
The definition of the Middle Income Trap
In the recent period, “Middle Income Trap” was one of the most hotly debated topics in economics. From 2002 to 2012, per capita income increased from $3,000 to $10,000 in Turkey. This leads to the question: “Will this increase continue or will Turkey get stuck in the group of middle income countries?” There are two factors behind the striking increase in per capita income in recent years. The first factor is that economic growth was higher in these years, compared to Turkey’s long run trend. In the last decade, real GDP increased by about 6 percent per year on average. The second factor is the large appreciation of Turkish Lira against the USD. Ultimately, Turkey joined the middle income countries group considering its GDP per capita in terms of current USD. Hence, the “Middle Income Trap” became a widely discussed topic in Turkey.
For a definition of middle income trap, we can look at the suggestion of a prominent economic historian and macroeconomist Barry Eichengreen. Eichengreen suggests three criterions: 1) to reach GDP per capita level of $16,000. 2) to reach 58 percent of United States’ GDP per capita. 3) the share
Prof. Dr. Seyfettin Gürsel, Betam, Director, [email protected] ****BarışSoybilgen, Betam, Research Assistant, [email protected]
Research Brief 13/154
of country’s manufacturing sector to reach 23 percent of national income.3 These criterions are not
absolute definitions. We should apply these criterions within a flexible framework. Regarding these criterions, Turkey almost satisfies the third criterion. For the two others Turkey has still a long road ahead in the middle income group since Turkey only reached 30 percent of United States’ GDP per capita in spite of high growth rates in recent years and its per capita income stays actually around 13.000 USD. In other words, our GDP per capita might increase more slowly compared to the recent period. In this situation, it seems inevitable that the GDP per capita will remain below$25,000 in 2023. The idea behind the theoretical framework of economic growth for a developing country is, taking technological level fixed, increasing production capacity through investment and at the same time shifting employment from less productive traditional sectors (agriculture) to highly productive modern (manufacturing) sectors. Therefore, the country can reach high growth rates in the early, “take-off”, stage of economic development. However, while production capacity (capital accumulation) is increasing, marginal return of capital diminishes. As a result, the increase in per capita income first slowdowns and later stagnates. To resist this iron law of growth, countries should continuously increase the technological level, the level of labor force’s knowledge and skills (human capital), and the efficiency of its institutions. Countries that cannot satisfy these conditions struggle to move to the high income group.
Determinants of growth in Turkish economy should be studied in detail to understand whether Turkey might get caught in the Middle Income Trap. It is more likely for a country growing on productivity increases to escape from the middle income trap than one where growth is dependent solely on employment or capital gains. In this research brief, we analyze the sources growth in the Turkish economy in recent years by decomposing per capita output into its components of working age population growth, labor productivity and employment. Results show that contribution of labor productivity decreased while growth rate slowed down in last two years. Moreover, the contribution of labor productivity was almost zero in the last few quarters. This adverse development brings up the question of whether Turkey is on the brink of the Middle Income Trap.
Two different periods in the growth period
When we analyze the growth performance of the last decade, two different periods stand out: Before and after the Global Recession. We can decompose per capita income into three components: 1) The change in the ratio of working age population to entire population, 2) The change in the ratio of employed population to working age population, or the change in the employment rate, 3) The change in the ratio of GDP to employed population or the change in the labor productivity (For mathematical definition. See Box: “The decomposition of per capita income into its components”).
The impact of changes in working age population ratio on economic growth is usually limited. The change in employment ratio i.e., the change in the number of average employed persons in households is effective, but has a natural limit. What determines whether a country is caught in the Middle Income Trap or not is labor productivity. As we mentioned above continuous economic growth requires continuous increase in labor productivity which comes from i) high technology investment ii) increases in human capital and iii) increases in efficiency through better economic governance and institutions.
The growth performance of Turkey, according to above three components is shown in Figure 1.
Figures show four quarter moving averages.4 We limit our period between 2005(1) and 2013(1),
because quarterly employment data is available since 2005 onwards.
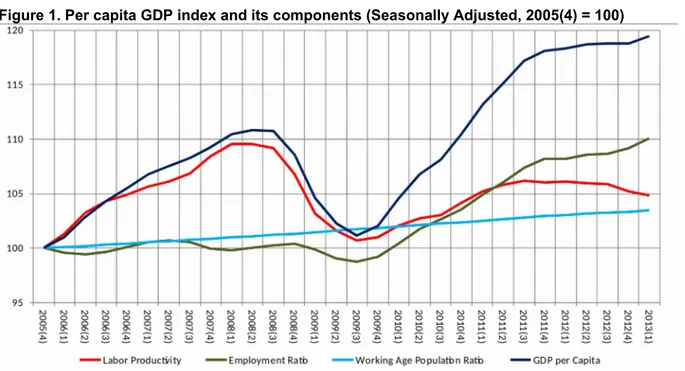
Let’s first analyze the working age population ratio which contributes least to growth. Due to increases in population, working age population also increases in Turkey. However, population growth is decelerating. In 2005, the ratio of working age population to entire population was 72 percent. In 2013, this ratio increased to 74 percent. As Figure 1 shows, working age population index only increased to 103 in 2013 from 100 in 2005. Figure 2 shows that the contribution of changes in this ratio to per
3Barry Eichengreen, Donghyun Park, Kwanho Sin (2011) “When Fast Growing Economies Slow Down: International Evidence
and Implications for China” NBER Economic papers, No 16909. For more information, see TÜRKONFED’s report published in December 2012:“Orta Gelir Tuzağından Çıkış: Hangi Türkiye?”.
4After real GDP, population, working age population and employment are seasonally adjusted, we annualize series by using
capita income has been steady, but very limited. In the coming period, the increase in working age population will decrease more and will stop in 2030. Therefore, the demographic window of opportunity for Turkey will close in 2030.
Figure 1. Per capita GDP index and its components (Seasonally Adjusted, 2005(4) = 100)
Source: Turkstat, Betam.
Productivity led growth before crisis
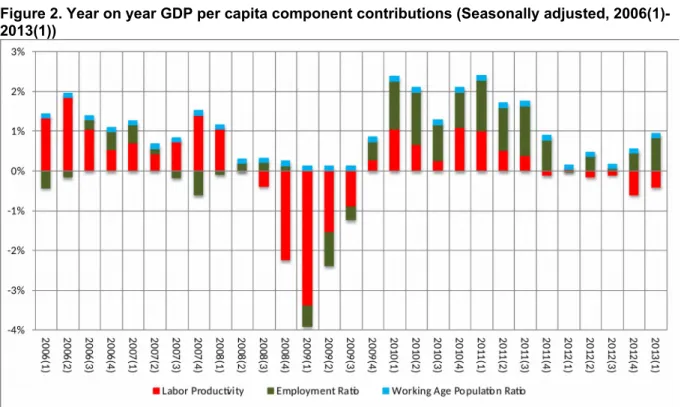
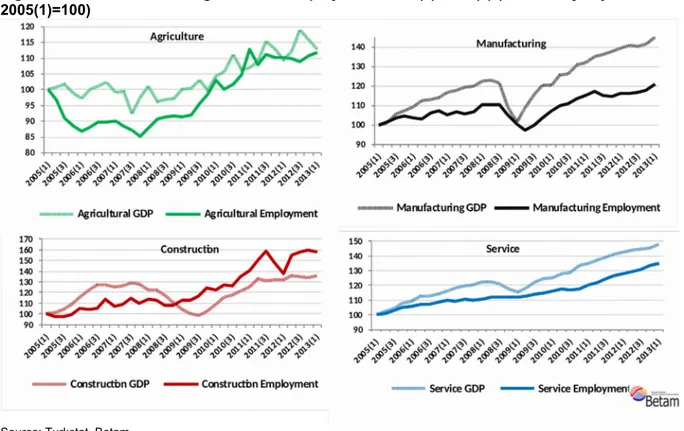
Before the global crisis, the employment ratio first stagnated and then declined slightly. There are two factors behind this development: Slump in agricultural employment in this period (Figure 3) and labor productivity gains in non-agricultural sectors. One of the most hotly debated topics at that time was “jobless growth”, and that was caused by the rapid decline in agricultural employment. Outside the agriculture sector, the increase in employment was accompanied by productivity gains (roughly 1 percent growth per 0.5 percent increase in employment). The decline in agricultural employment accompanied by just enough increases in non-agricultural employment caused total employment to stagnate. As it is seen in Figure 2, the contribution of employment ratio to per capita income was sometimes negative, sometimes positive, but it was zero in overall. Employment ratio mostly fluctuated around 100 between 2005(4) and 2008(2) (Figure 1).
This development which was mostly interpreted as a negative outcome actually drove per capita income higher through productivity gains. Both productivity gains in non-agricultural sectors, especially in manufacturing, and the rapid decline in agricultural employment shifted employment from low productivity sectors to high productivity sectors and increased labor productivity significantly. It is clear in Figure 2 that the increase in per capita income is mostly driven by labor productivity gains. Between 2005(1) and 2008(2), labor productivity index rose from 100 to 109.6, and per capita income index rose to 110.8 (Figure 1).
Employment led growth after the crisis
The crisis period is not very meaningful for our analysis. As predicted, GDP declined more than employment. As a result, labor productivity declined sharply and employment ratio fell, but less than labor productivity. Turkish economy recovered quickly and experienced high growth rates from the second quarter of 2009 until the second quarter of 2011. However, dynamics of this growth period is different than the pre-crisis period.
In this period, labor productivity gains contributed positively to per capita income growth, but the contribution remained weak compared to the pre-crisis period. Between 2009(1) and 2011(3), labor productivity index rose from 103.2 to 106.2 (Figure 1). Employment ratio increased at a similar pace, from 99.9 to 102.9. Growth was balanced in terms of its sources, however, the current account deficit
increased sharply, due to increases in domestic demand. Moreover, strong capital inflows and high inflation caused Turkish Lira to appreciate significantly.
Figure 2. Year on year GDP per capita component contributions (Seasonally adjusted, 2006(1)-2013(1))
Source: Turkstat, Betam.
The economic policy makers who recognized that this kind of growth was unsustainable pursued a more balanced growth (according to demand composition and current account deficit) by cutting domestic demand and reducing real exchange rate through economic policy, especially multi-dimensional monetary policy. However domestic demand declined more than anticipated, in return, imports fell and exports rose. Growth completely relied on net exports in this period. Growth rate fell well below than expected, and realized as 2.2 percent. 2013 indicators imply that the growth will be higher this year due to the limited revival in domestic demand, but it will be lower than 4 percent. The most important part of the low growth trend for our discussion is that the contribution of labor productivity to growth became zero. In the last two years, growth was only based on employment gains. Labor productivity index which was 105.8 in the second quarter of 2011 declined to 104.8 in the first quarter of 2013. In other words, the contribution of labor productivity to growth in per capita income was negative in the last four quarters (Figure 2). The main reason for this unfavorable development is that employment in service sector increased faster than GDP growth from 2011 to
2013.5 In the same period the labor productivity in the industrial sector almost stagnated. (See Betam
Labor Market Outlook: February 2013, Table A). In the same period In previous quarters, labor productivity also stagnated in the manufacturing sector (Figure 3). Moreover, agricultural employment which took off after 2008 stagnated in the last two years (Figure 3). This implies that labor productivity gains due to the decline in agricultural employment have ended in the aftermath of the economic crisis.
Dilemma in growth: Employment vs. Productivity
In the last two years, Turkish economy did not just grow slowly, but had to resort to a growth regime
where employment increases were the only source and labor productivity did not improve at all.6 As a
5We would like to remark that high employment increases in the service sector is observed in the middle income countries
turning out the productivity contributions to the growth negative. For the case of Latin American countries see a recent article in Finance and Development (“A Bumpy Road Ahead”), September 2013.
6Our decomposition method doesn’t decompose the growth into labor and capital components like neo-classical model (Solow
model). Our method focuses on labor productivity which includes the contribution of capital and total factor productivity. Therefore the stagnation or the decline in labor productivity implies a significant fall in total factor productivity, because the contribution of capital cannot be negative. This prediction has been confirmed by a growth accounting exercise in the last Mid Term Program, published in October 2013, after the publication of the original Turkish version of this research brief in August
result, per capita income growth decelerated significantly (Figure 1). The increase in the employment ratio which implies an increase in the average number of workers (the increase in women employment plays a key role) in households is a positive development. But, for the Turkish economy to reach higher growth rates and achieve the target of 2023 ($25,000) through higher per capita income growth, productivity gains should start to make positive contributions to growth again as it was the case in the pre-crisis period. We want to stress once again, that labor productivity stems from structural reforms in the education system, the labor market, taxation system, the energy market and in general strong structural reforms that run the wheels of the economy more efficiently. Otherwise, Turkey can get stuck in the middle income group for many years.
Figure 3. Indices of sectoral growth and employment: 2005(1)-2012(3) (Seasonally adjusted, 2005(1)=100)
Source: Turkstat, Betam.
Appendix: Decomposition of growth using total working hours
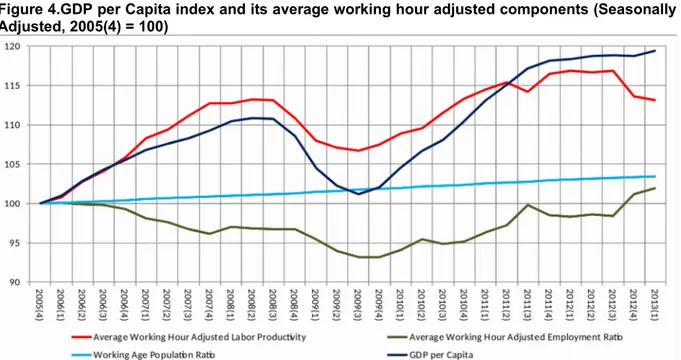
For our main results, we use employment ratio (the share of employed population to working age population) to decompose growth in per capita income. We also include average total working hours into our decomposition to make a robustness check. If average total working hours declines, per capita income (labor productivity) may not increase or may increase slightly. In our period of analysis, average total working hours fell from 51 hours to 48 hours. This fall is not enough to explain the decline in labor productivity. In Figure 4, we use average total working hour adjusted labor productivity:
(GDP / employment× average total working hour).7 As it is seen in Figure 4, average total working hour
adjusted labor productivity increased sharply before the crisis, and the increase continued after the crisis, but it first stagnated and then fell in the last two years.
2013. Indeed, for a forecasted 3.6 percent growth in 2013, MTP estimates a contribution of 2.5 percentage points for the capital stock increase, 2 points for employment increase and minus 0.9 points for the contribution of total factor productivity.
7Average total working hour is taken from Turkstat’s “Bilgi Dağıtım ve İletişim Daire Başkanlığı”. Turkstat calculates average
Figure 4.GDP per Capita index and its average working hour adjusted components (Seasonally Adjusted, 2005(4) = 100)
Box: Decomposing per capita income into its components 1) According to employment
GDP
tP
t=
GDP
tE
t∗E
tWP
t∗WP
tP
tGDP
tP
t =gdp
t (GDP per capita)GDP
tE
t=
alp
t (average labor productivity according to employed population/employment (E
t ))E
tWP
t=
er
t (the ratio of employed population to working age population (WP
t ))WP
tP
t=
wapr
t (the ratio of working age population to entire population)gdp
tgdp
t-1=
alp
talp
t-1*
er
te r
t-1*
wapr
twapr
t-12) According to average total working hour
GDP
tP
t=
GDP
tE
t∗AH
t∗E
t∗AH
tWP
t∗WP
tP
tGDP
tP
t =gdp
t (GDP per capita)GDP
tE
t∗AH
t=
alp
t (average working hour adjusted average labor productivity)E
t∗AH
tWP
tWP
tP
t=