57. Sayı / Temmuz 2018
120
EFFECTIVENESS OF FISCAL POLICY AND MONETARY POLICY IN TURKEY
Adil AKINCI
Güner TUNCER
Abstract
Which policy is more effectiveness; fiscal policy or monetary policy? This question occupies the agenda both theoretically and empirically. Based on this, the purpose of this study is to analyze the effectiveness of the fiscal and monetary policies in Turkey. In terms of macroeconomics, effectiveness is basically the growth of the national income pie. In this context, effectiveness comparison is evaluated on economic growth in the analysis of the study. In the analysis of the study, the Bounds Test is applied for 2006:Q1-2016:Q3 period. According to the econometric results, it was determined that the monetary policy for Turkey is effectiveness.
Keywor ds: Fiscal policy, monetary policy, comparative policy, effectiveness, bounds test JEL Codes: E62, E52, E63
TÜRKİYE’DE MALİYE POLİTİKASI İLE PARA POLİTİKASININ ETKİLİLİĞİ
Öz
Hangi politika daha etkilidir maliye politikası mı para politikası mı? Bu soru gerek teorik gerek ampirik çalışmalard a gündemi oldukça meşgul etmektedir. Bu önemden hareketle bu çalışmanın amacı Türkiye’de maliye ve para politikalarının etkililiğini analiz etmektir. Makro iktisadi anlamda etkililik temel olarak milli gelir pastasının büyümesidir. Bu kapsamda çalışmanın analizinde etkililik kıyaslaması ekonomik büyüme üzerin de değerlendirilmektedir. Çalışmanın analizinde 2006:Q1-2016:Q3 dönemi için Sınır (Bounds) Testi uygulanmıştır. Ekonometrik sonuçlara göre Türkiye için para politikasının etkili olduğu belirlenmiştir.
Anahtar Kelimeler: Maliye politikası, para politikası, karşılaştırmalı politika, etkililik, sınır testi JEL Kodları: E62, E52, E63
This study is developed from the report presented as an abstract at the "International Congress on Afro -Eurasian
Research II" congress with the title "The Efficiency of Fiscal and Monetary Policies in Turkey on the Economic Growth".
Dr.Öğr.Üyesi, Kırklareli Üniversitesi, Uygulamalı Bilimler Yüksekokulu, Bankacılık-Finans Bölümü ,
121 Introduction
The economic policy, used to achieve sustainable growth determined in the social process, to establish price stability, to tackle with unemployment, to establish the current balance, to balance the budget, to prevent the income distribution inequities and to reduce the debt burden of the public sector, is mostly oriented towards money and fiscal policy instruments. The question which policy is more effective has been debated by scientists and policy makers quite intensely. Basically, macroeconomic effectiveness indicates the growth of GNP pie. In this context, there is no judgment on whether monetary policy or fiscal policy is more efficient, but the effective ne ss comparison may vary according to the specific characteristics of each economy and the seasonal conditions.
In an economy, the government can use the fiscal policy by making some changes in public expenditures and public incomes to influence the level of national income; and can use the monetary policy by making some changes in the money supply. This subject has been one of the most heated debates since the 1929 Economic Crisis (Baghdadioğlu, 2012). Especially, with the rise of Keynesian school, policy activities were compared in the framework of IS-LM-BP models and with the further development of econometric methods in the empirical studies and. Today these comparisons are still popular. Undoubtedly, effectiveness of fiscal and monetary policies can be changed by countries’ implementations.
Specific to Turkey, fiscal and monetary policies implementations can be pointed out as the following: After the 2001 crisis, transition to the strong economy program was applied. Fiscal discipline, price stability and steady growth were the main goals of the program. Turkey’s fiscal policy approach can be seen from the medium-term program. In the 2006-2009 medium- ter m programme, in order to maintain macroeconomic stability, fiscal policy, monetary policy and revenue policy will be kept in harmony. During the programme period, policy on having a primary surplus will continue by pursuing the fiscal discipline precisely to ensure a reduction in the public debt stock to GNP ratio as well as controlling the increase in current account deficit (OVP, 2006). After the 2008 global crisis, implementation of fiscal policy, in harmony with the revenue and monetary policy will be carried out by an approach that ensures the realization of the medium term fiscal targets determined in 2010-2012medium-term programme, which is related with revenue, expenditure, public sector deficit and debt (OVP, 2010).Fiscal policy will be implemented in a way that it contributes to a growth process lead by private sector, maintaining macroeconomic stability and coping with current account deficit by pursuing revenue, expenditure and debt targets projected in the 2012-2014 medium-term programme (OVP, 2012). According to the 2014-2016 medium-term programme, fiscal policies will be implemented in line with the goals of supporting economic and financial stability, increasing domestic savings, curbing current account deficit, and raising growth potential of the economy (OVP, 2014).
In terms of Turkey’s monetary policy, the following can be stated: On the back of the success achieved in the disinflation process between 2002 and 2005, the Central Bank was convinced that the necessary preconditions were attained. Consequently, the Inflation Targeting Regime was adopted as of 2006. As of end-2010, to contain the adverse effects of the global crisis, the Central Bank of the Republic of Turkey also devised a new unconventional monetary policy that would respond to shocks. Accordingly, the inflation targeting regime implemented since 2006 was enhanced to safeguard financial stability as well. Through this revision, the Central Bank introduced into the existing regime an asymmetric and wide corridor system in which more than one interest rate is used as an instrument, and a flexible framework based on an active liquid it y policy (TCMB, 2018).
122
Moving from this point, the purpose of this study is to analyze the effectiveness of the fiscal and monetary policies in Turkey. Effectiveness analysis and comparison of policies have been evaluated in terms of economic growth. Literature, dataset, econometric methods and findings, evaluation of empirical findings and conclusion part are presented in the course of the study. 1. Literature
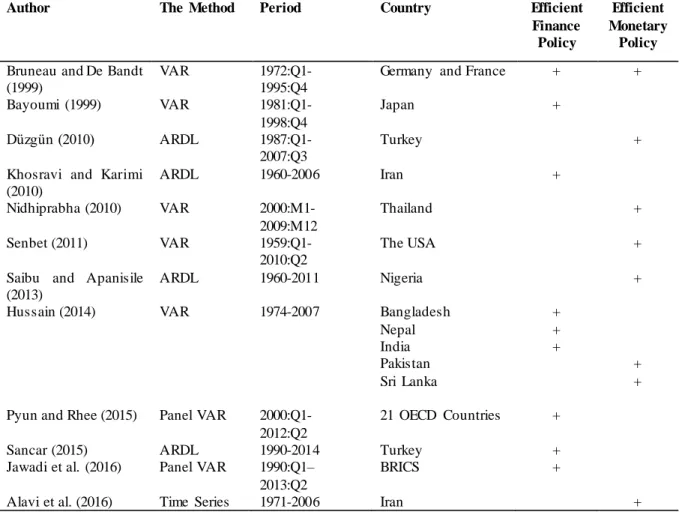
Examining the effectiveness of fiscal and monetary policies on economic growth in the literature, there have been many studies on policies in particular. In this study, since the comparison of the two politics is aimed, the literature review was summarized within the scope of studies that take both policies into consideration. In these studies, particular country evaluations and country group evaluations were conducted. The effectiveness results determined in the studies are presented in the table below.
Table 1: Literature Review
Author The Method Period Country Efficient
Finance Policy
Efficient Monetary
Policy
Bruneau and De Bandt (1999)
VAR 1972:Q1- 1995:Q4
Germany and France + + Bayoumi (1999) VAR 1981:Q1-1998:Q4 Japan + Düzgün (2010) ARDL 1987:Q1-2007:Q3 Turkey +
Khosravi and Karimi (2010) ARDL 1960-2006 Iran + Nidhiprabha (2010) VAR 2000:M1-2009:M12 Thailand + Senbet (2011) VAR 1959:Q1-2010:Q2 The USA +
Saibu and Apanisile (2013)
ARDL 1960-2011 Nigeria +
Hussain (2014) VAR 1974-2007 Bangladesh Nepal India Pakistan Sri Lanka + + + + + Pyun and Rhee (2015) Panel VAR
2000:Q1-2012:Q2
21 OECD Countries +
Sancar (2015) ARDL 1990-2014 Turkey +
Jawadi et al. (2016) Panel VAR 1990:Q1– 2013:Q2
BRICS +
Alavi et al. (2016) Time Series 1971-2006 Iran +
As can be seen in Table 1, the policy effectiveness differs according to the countries evaluated and the periods. The economic and other conditions of each country are the main determinant at that point. For example, taking Turkey into consideration Düzgün (2010) determined the monetary policy to be efficient for 1987:Q1-2007:Q3 period, Sancar (2015) identified the fiscal policy to be effectiveness for the 1990-2014 period.
2. Data Set, Econometric Methods and Findings
The data set of the study covers 2006:Q1-2016:Q3 period. Data for variables were obtained from electronic data distribution system of the Central Bank of the Republic of Turkey. A dummy variable was created to include the effects of the global crisis in 2008 to the model for the 2006:Q1-2016:Q3 period. The "Bounds Test" approach will be used to determine the effectiveness of fiscal
123
policy and monetary policy. Gross domestic product (gdp) as a dependent variable, public expenditures (pe) and money supply (m2) as independent variables are used in this study.
2.1. Bounds Test Approach
The most commonly used cointegration tests in the literature are the two-stage error-based Engle-Granger (1987) method and the Johansen (1988) and Johansen and Jesulius (1990) methods based on the system approach. In order to apply these methods, all variables in the model should be non-stationary I(0) and they should become non-stationary after the first differences are applied (Pesaranet al., 2001: 289-290). The bounds test approach removes the problem of not being able to apply cointegration method to the series with different cointegration levels. The equation to be used in the bounds test approach is as follows (Kıran and Güriş, 2011: 72):
𝛥𝑔𝑑𝑝𝑡 = 𝛼 + ∑ 𝛽𝑖 𝑚 𝑖=1 𝛥𝑔𝑑𝑝𝑡−𝑖 + ∑ 𝜆𝑖 𝑚 𝑖=1 𝛥𝑝𝑒𝑡−𝑖 + ∑ 𝛶𝑖 𝑚 𝑖=1 𝛥𝑚2𝑡−𝑖+ Ǿ𝑔𝑑𝑝𝑡−1+ ʉ𝑝𝑒𝑡−1 + ɸ𝑚2𝑡−1 + 𝜖𝑡
2.2. Unit Root Test Results
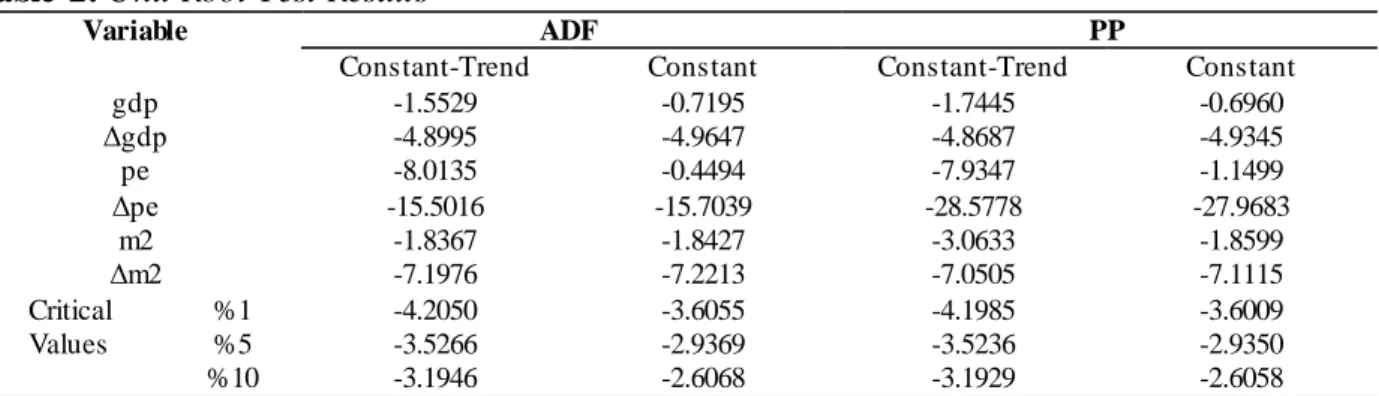
Prior to unit root test analysis, "gdp", "pe" and "m2" variables were seasonally adjusted and the natural logarithms were applied to be stabilized by the Census X-12 method. The Augmented Dickey-Fuller (ADF) test and the Phillips-Peron (PP) test were used to test whether the series contain unit root. The unit root test results were presented in Table 2.
Table 2: Unit Root Test Results
Variable ADF PP
Constant-Trend Constant Constant-Trend Constant
gdp -1.5529 -0.7195 -1.7445 -0.6960 Δgdp -4.8995 -4.9647 -4.8687 -4.9345 pe -8.0135 -0.4494 -7.9347 -1.1499 Δpe -15.5016 -15.7039 -28.5778 -27.9683 m2 -1.8367 -1.8427 -3.0633 -1.8599 Δm2 -7.1976 -7.2213 -7.0505 -7.1115 Critical Values %1 %5 %10 -4.2050 -3.5266 -3.1946 -3.6055 -2.9369 -2.6068 -4.1985 -3.5236 -3.1929 -3.6009 -2.9350 -2.6058 Note: * indicates that the variable is stable at 1%, ** indicates that the variable is stable at 5%. "Δ" sign indicates the difference operator, ie, the first difference values.
According to the ADF and PP unit root test results in Table 2, it is understood that the variables "gdp" and "m2" are I(1) and "pe" is I(0). It has been found that the variables are stationary at different levels. The difference in stationarity levels of the variables has great importance in determining the method to be applied in the analysis. Since the series are stationary at I(0) and I(1) level, the Autoregressive Distributed Lag (ARDL) test will be used to show the relations hips between the variables in the study.
For the dummy variable that will be created to include the effects of the 2008 global crisis in the model, The Zivot-Andrews unit root test, a structural break unit root test, is used to identify the effect of the global crisis on the gross domestic product. Zivot-Andrews unit root test results are presented in Table 3.
124
Table 3: Zivot-Andrews (ZA) Structural Break Unit Root Test Results
Variables Model Delay Length
Break Period Test Statistic
Critical Values
% 1 % 5 % 10
gdp C 4 2008:Q3 -4.31 -5.57 -5.08 -4.82
Examining the Zivot-Andrews results in Table 3, it is determined that there is a break in the gross domestic product 2008:Q3 period. Based on this result, the global crisis dummy variable was formed by assigning "1" for the period beginning from the breakdown until the increase of the gross domestic income again, ie for the period of 2008:Q3, 2008:Q4 and 2009:Q1 and "0" for the other periods.
2.3. Bounds Test Results
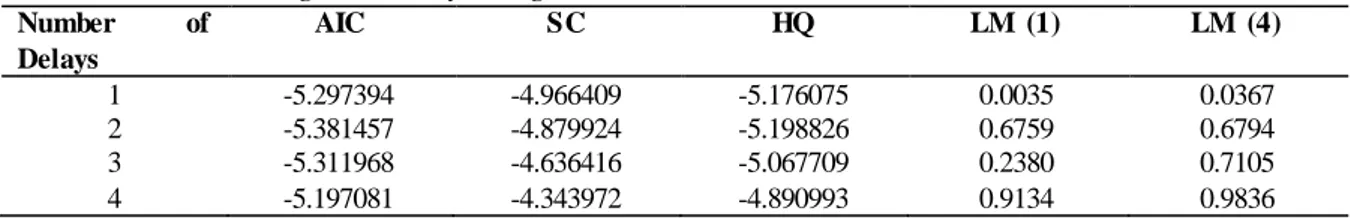
In the application of bounds test, the appropriate delay length must be determined firstly. In order to determine the appropriate delay length, The Akaike Information Criterion, the Schwarz Information Criterion, and the Hannan-Quinn Information Criterion are used. The delay length that gives the smallest value depending on the information criteria is determined as the optimal delay length. However, there should be no autocorrelation problem at the determined appropriate delay length. If there is an autocorrelation problem at the determined appropriate delay length, the delay length giving the smallest value according to the information criteria is determined as the optimal delay length.
Table 4: Determining the Delay Length
Number of Delays AIC SC HQ LM (1) LM (4) 1 -5.297394 -4.966409 -5.176075 0.0035 0.0367 2 -5.381457 -4.879924 -5.198826 0.6759 0.6794 3 -5.311968 -4.636416 -5.067709 0.2380 0.7105 4 -5.197081 -4.343972 -4.890993 0.9134 0.9836
When the results of the information criteria are examined, it is determined that there is no autocorrelation and the second delay length is the most appropriate delay length. After determining the appropriate delay length, the "F-statistic" is calculated based on the 2nd delay length. After "F statistic" is calculated, it is compared with two critical values, lower and upper values, calculated by Pesaran, Shin and Smith (2001). If "F statistic" is bigger than the upper value, there is a long-term relationship between the variables; if it is smaller than the lower value, there is no long- long-term relationship and no interpretation can be made between the lower value and the upper value (Kıran and Guris, 2011: 72).
Table 5: Bounds Test Results
Dependent Variable: "gdp" F statistic: 9.75 Critical Values (k=3) Lower Value Upper Value %5 2.79 3.67
Since the calculated F statistic is greater than the upper critical value of Peseran at the 5% level of significance, it is concluded that there is a long-term relationship between the variables "gdp", "pe" and "m2". Since there is a cointegration relation between the variables, the ARDL model is applied at this stage in order to determine the long and short-term relationships.
125 2.4. ARDL Model Results
In order to examine the long-term relationship between variables, ARDL model is applied and long-term and short-term relationships are determined. The model to be used to investigate the long-term relationship is ARDL (2,3,1,2). In the model, only long-term coefficients are included, and the significance of the coefficients is examined. The results obtained from the model are presented in Table 6.
Table 6: Results of ARDL (2,3,1,2) Model
Variables Coefficient Standard error t-statistic Prob
gdp(-1) 0.446849 0.176692 2.528964 0.0174 gdp (-2) 0.394643 0.16148 2.443915 0.0211 pe -0.07384 0.038187 -1.93374 0.0633 pe(-1) -0.09456 0.035641 -2.65315 0.013 pe (-2) -0.03884 0.036252 -1.07133 0.2932 pe (-3) 0.055625 0.038361 1.450027 0.1582 m2 0.451301 0.156094 2.891206 0.0073 m2 (-1) -0.21467 0.15579 -1.37791 0.1791 CRISIS -0.03897 0.013894 -2.80454 0.0091 CRISIS(-1) -0.03654 0.019763 -1.84867 0.0751 CRISIS(-2) -0.01895 0.014222 -1.33253 0.1934 C 0.966699 0.266347 3.629479 0.0011
Long term coefficients were calculated by considering ARDL (2,3,1,2) model. Long term coefficients are presented in table 7.
Table 7: ARDL (2,3,1,2) Model Long Term Coefficients
Variables Coefficient Standard error t-statistic Prob
pe -0.95652 0.520815 -1.83659 0.0769
m2 1.492896 0.402271 3.71117 0.0009
CRISIS -0.59589 0.173328 -3.43796 0.0019
C 6.098741 1.146802 5.318041 0.0000
Examining the long-term results of the ARDL are examined, there is a statistically significa nt relationship between long term "gdp" and "pe" at 10% significance level and "gdp" and "m2" at 5% significance level. There is a statistically significant relationship between the "crisis" variable, which is a dummy variable created to include the econometric model of the global crisis that emerged in 2008, and the "gdp" variable at 5% significance level. After establishing a long- term relationship, short-term relationships are examined by establishing an error correction model based on the ARDL (3,1,0) model. The error correction model results are presented in Table 8.
Table 8: Error Correction Model Based on ARDL (2,3,1,2) Model
Variables Coefficient Standard error t-statistic Prob
d(gdp(-1)) -0.394643 0.141261 -2.793707 0.0093 d(pe) -0.073843 0.029837 -2.474881 0.0196 d(pe(-1)) -0.016787 0.031257 -0.537066 0.5955 d(pe(-2)) -0.055625 0.025378 -2.191872 0.0369 d(m2) 0.451301 0.09993 4.516188 0.0001 d(CRISIS) -0.038966 0.010823 -3.600388 0.0012 d(CRISIS(-1)) 0.018952 0.013004 1.457324 0.1562 ECT(-1) -0.158508 0.023216 -6.827625 0.0000
126
According to the error correction model results; the short-term error coefficient (-0.1585) is between -1 and 0 and statistically significant (Prob: 0.0000) and that shows the error correction model works. This parameter forces the variables closer to the long-term equilibrium value. Since the error term parameter is significant, there is a causal relationship between the variables. 2.5. Evaluation of Empirical Findings
As a result of the evaluation of econometric findings obtained by the ARDL model in which the effects of fiscal policy and monetary policy on economic growth are examined, the existence of a long-term relationship between variables is determined due to the fact that the calculated "F statistic (9.75)" is greater than the upper and lower critical values. After determining the long- term relationship, long term coefficients were calculated depending on ARDL (2,3,1,2) model and short-term coefficients were calculated depending on error correction model.
Analyzing the long-term coefficients, it is determined that the fiscal policy is statistica ll y significant at the 10% significance level and that a 1% increase in the fiscal policy will decrease the gross domestic product in the long term by -0.95%. It is determined that monetary policy is statistically significant at 5% significance level and a 1% increase in the monetary policy will increase the gross domestic product in the long term by 1.49%. The crisis dummy variant created to model the effects of the global crisis in 2008 was significant at the 5% level of significance, and it was determined that past crises would reduce the long-term gross domestic product by -0.59%. The error correcting term obtained from the error correction model is between 0 and -1 and statistically significant at the 5% significance level and that shows that the established model is valid. The error correction coefficient indicates that 15% of the deviations from the long- term equilibrium are corrected every quarter. Examining the short-term coefficients obtained from the error correction model, it is determined that the fiscal policy is statistically significant at the 5% significance level and that a 1% increase in the fiscal policy will decrease the gross domestic product in the short term by -0.07%. It is determined that monetary policy is statistically significa nt at 5% significance level and a 1% increase in the monetary policy will increase the gross domestic product in the short term by 0.45%. According to the findings, it has been determined that the monetary policy in the short term and the long term is more effective to the gross domestic product than the fiscal policy.
3. Conclusion
Fiscal and monetary policies, which are the main tools of economic policy, though having different roles to play, they have roles in achieving common goals. Basically, fiscal policy uses public expenditures and public revenues (especially tax revenues) while monetary policy uses interest rates and bank reserves. Though using different instruments, the main aim of both policies is to provide economic growth and to create positive effects on all other macroeconomic variables (employment, general level of prices etc.). In order to answer the question "which policy is more effective in Turkey" is the starting point of this study. In this aspect, the Bounds Test is applied in the study for 2006:Q1-2016:Q3 period.
According to the results of the analysis, it is determined that 1% increase in the long-term fiscal policy will decrease the gross domestic product by -0.95% while 1% increase in the monetary policy will increase the gross domestic product by 1.49%. Examining the effects of the global crisis that took place in 2008, we have reached the conclusion that the crises experienced will decrease the gross domestic product by -0.59% in the long term. Moreover, according to the short-term results obtained from the error correction model, it was also found that 1% increase in the fiscal policy would decrease the gross domestic product by 0.07% in the short term and 1% increase in the monetary policy would increase the gross domestic product by 0.45%.
127
In the perspective of econometric results mentioned above, as a result of effectiveness comparison of fiscal and monetary policies in Turkey, the monetary policy has been determined for be more efficient. But, of course, these results do not indicate that the policy, which should be merely preferred, is the monetary policy. In particular, increasingly developing economic relations within the context of globalization, and the increasing number of dynamic problems and increasing economic complexity around this development, necessitate the development of optimal policy components. Achieving a sustainable fiscal discipline, reducing the current deficit, providing equity in income distribution, creating constant growth performance and ensuring price stabilit y can cause conflicts of purpose in certain periods. This conflict can significantly affect the effectiveness of fiscal and monetary policies particularly in developing countries such as Turkey. From this aspect, the government and the central bank need to further develop the synchronizat io n in policy making in order to further increase the effectiveness level of fiscal and monetary policies in Turkey by acting together.
References:
Alavi, S. E., Moshiri, S., & Sattarifar, M. (2016). An Analysis of the efficiency of the monetary and fiscal policies in Iran economy using IS–MP–AS model. Procedia Economics and
Finance(36), 522-531.
Bağdadioğlu, N. (2012). Maliye ve Para Politikalarının Nispi Etkinliği. B. Ataç içinde, Maliye
Politikası I (s. 56-79). Anadolu Üniversitesi Yayını No: 2560.
Bayoumi, T. (1999). The Morning After: Explaining the Slowdown in Japanese Growth in the
1990s. IMF Working Papers 99/13.
Bruneau, C., & Oliver, D. B. (1999). Bruneau, Catherine ve Oliver, De Bandth, (1999), “Fiscal
Policy InThe Transition To Monetary Union: A Structural VAR Model. Banque De France
Working Paper, No:60.
Düzgün, R. (2010). Türkiye Ekonomisinde Para ve Maliye Politikalarının Etkinliği. Uluslararası
Sosyal Araştırmalar Dergisi, 3(11), 230-237.
Engle, R. F., & Granger, C. (1987). Co-integration And Error Correction: Representatio n, Estimation And Testing. Econometrica(55), 251–276.
Hussain, M. N. (2014). Empirical Econometric Analysis of Relationship Between Fiscal-Monetar y Policies and Output on SAARC Countries. The Journal of Developing Areas, 48(4), 209-224.
Jawadi, F., Mallick, S. K., & Sousa, R. M. (2016). Fiscal and monetary policies in the BRICS: A panel VAR approach. Economic Modelling (58), 535-542.
Johansen, S. (1988). Statistical Analysis of Cointegrating Vectors. Journal of Economic Dynamics
and Control(12), 231-254.
Johansen, S., & Juselius, K. (1990). Maximum Likelihood Estimation and Inference on Cointegration with Applications to the Demand for Money. Oxford Bulletin of Economics
and Statistics(52), 169-210.
Khosravi, A., & Mohammad Sharif, K. (2010). To Investigation the Relationship Between Monetary, Fiscal Policy and Economic Growth in Iran: Autoregressive Distributed Lag Approach to Cointegration. American Journal of Applied Science, 7(3), 415-419.
Kıran, B., & Güriş, B. (2011). Türkiye’de Ticari Ve Finansal Dışaaçıklığın Büyümeye Etkisi: 1992-2006 Dönemi Üzerine Bir İnceleme. Anadolu Üniversitesi Sosyal Bilimler Dergisi,
128
Nidhiprabha, B. (2010). Effectiveness of Thailand’s Macroeconomic Policy Response to The Global Financial Crisis. ASEAN Economic Bulletin, 27(1), 121-135.
OVP (2006). Orta Vadeli Program 2006-2009. OVP (2010). Orta Vadeli Program 2010-2012. OVP (2012). Orta Vadeli Program 2012-2014. OVP (2014). Orta Vadeli Program 2014-2016.
Pesaran, M., Shin, Y., & Smith, R. (2001). Bounds Testing Approaches to the Analysis of Level Relationships. Journal of Applied Econometrics(16), 289-326.
Pyun, J. H., & Dong-Eun, R. (2015). Fiscal Multipliers During The Global Financial Crisis: Fiscal and Monetary Interaction Matters. Contemporary Economic Policy, 33(1), 207-220. Saibu, M., & Apanisile, O. (2013). A Bound Test Analysis of The Effects of Global Economic
Shocks on Nigerian Economy: The Role of Fiscal and Monetary Policies. Australian
Journal of Business and Management Research, 2(12), 58-68.
Sancar, C. (2015). Para ve Maliye Politikalarının Nispi Etkinliği: Türkiye İçin Bir Uygula ma.
Journal of International Social Research, 8(39), 933-943.
Senbet, D. (2011). The Relative Impact of Fiscal Versus Monetary Actions On Output: A Vector Autoregressive (VAR) Approach. Business and Economics Journal(2011-BEJ-25), 1-11. TCMB (2018). Central Bank Monetary Policy Framework.
http://www.tcmb.gov.tr/wps/wcm/connect/EN/TCMB+EN/Main+Menu/Core+Functions/Moneta ry+Policy/Central+Bank+Monetary+Policy+Framework
Zivot, E., & Andrews, D. (1992). Further Evidence On The Great Crash, The Oil-Price Shock, And The Unit-Root Hypothesis. Journal of Business & Economic Statistic(10), 251-270.