ENCAPSULATION OF FOOD ADDITIVES
AND DRUGS BY CYCLODEXTRIN
FUNCTIONALIZED ELECTROSPUN
NANOFIBERS
A DISSERTATION SUBMITTED TO
THE GRADUATE SCHOOL OF ENGINEERING AND SCIENCE OF BİLKENT UNIVERSITY
IN PARTIAL FULFILLMENT OF THE REQUIREMENTS FOR THE DEGREE OF
DOCTOR OF PHILOSOPHY IN
MATERIALS SCIENCE AND NANOTECHNOLOGY
By
ZEHRA IREM YILDIZ June 2020
ENCAPSULATION OF FOOD ADDITIVES AND DRUGS BY CYCLODEXTRIN FUNCTIONALIZED ELECTROSPUN NANOFIBERS By Zehra Irem Yildiz
April 2020
We certify that we have read this dissertation and that in our opinion it is fully adequate, in scope and in quality, as a thesis for the degree of Doctor of Philosophy.
_______________________________ Engin Durgun _______________________________ Tamer Uyar _______________________________ Servet Gülüm Şumnu _______________________________ Çağlar Elbüken _______________________________ Pınar Huri _______________________________ Fatih İnci
Approved for the Graduate School of Engineering and Science:
_________________________________ Ezhan Karaşan
i
ABSTRACT
ENCAPSULATION OF FOOD ADDITIVES AND DRUGS BY CYCLODEXTRIN FUNCTIONALIZED ELECTROSPUN NANOFIBERS
Zehra İrem Yıldız
Ph.D. in Materials Science and Nanotechnology Advisor: Engin Durgun
Co-Advisor: Tamer Uyar June 2020
Electrospun nanofibers attract attention of many areas including food and pharmaceutical industries thanks to their unique physical/mechanical properties like large surface area-to-volume ratio, nanoporous structure, design flexibility and lightweight. Although, in general polymers are used for fabrication of electrospun nanofibers, it is also possible to obtain electrospun nanofibers purely from cyclodextrins (CDs). CDs with truncated cone shape structure are attractive host molecules for the formation of host-guest type inclusion complexes (ICs) with variety of appropriate guest molecules. Creating ICs with CDs causes remarkable enhancement at the properties of the guest molecule, and so CDs have wide range of applications in many areas including food and pharmaceutical industries.
In this thesis, polymer-free electrospun nanofibers from CD-ICs of some food additives and drugs were produced. Firstly, four food additives, menthol, carvacrol, cinnamaldehyde and beta-carotene were encapsulated by electrospun CD nanofibers. Afterwards, the solubility, heat/light stability, antibacterial/antioxidant
ii
activity of the materials were investigated to observe the effects of encapsulation by CD nanofibers on the food additives. Secondly, electrospun CD-IC nanofibers of three types of drugs, sulfisoxazole, paracetamol and catechin were produced. Since one of the most critical point for drug bioavailability is its solubility in water, the obtained electrospun drug/CD-IC nanofibers were mainly investigated in terms of change in their solubility. In the light of analyses, it can be concluded that, main drawbacks of food additives and drugs like high volatility, low solubility and low stability were reduced or removed; besides, their properties such as antioxidant and antibacterial activities were enhanced or preserved.
Keywords: electrospinning, nanofibers, modified cyclodextrins, inclusion complexes, food additives, drugs
iii
ÖZET
GIDA KATKI MADDELERİ VE İLAÇLARIN ELEKTROEĞİRME YÖNTEMİ KULLANILARAK ÜRETİLEN VE SİKLODEKSTRİN MOLEKÜLÜ İLE FONKSİYONLAŞTIRILMIŞ NANOLİFLER İLE
ENKAPSÜLASYONU
Zehra İrem Yıldız
Malzeme Bilimi ve Nanoteknoloji, Doktora Tez Danışmanı: Engin Durgun Tez Eş Danışmanı: Tamer Uyar
Haziran 2020
Elektroeğirme yöntemi ile elde edilen nanolifler, geniş yüzey alan/hacim oranı, nanogözenekli yapı, tasarım esnekliği ve hafiflik gibi benzersiz fiziksel/mekanik özellikleri sayesinde gıda ve ilaç endüstrileri de dahil olmak üzere birçok alanın dikkatini çekmektedir. Genelde elektroeğirme yöntemi ile nanolif üretiminde polimerler kullanılmasına rağmen, nanoliflerin sadece siklodekstrinlerden (CD'ler) elde edilmesi de mümkündür. Kesik koni biçiminde olan CD'ler, uygun misafir molekülleri ile ev sahibi-misafir tipi inklüzyon kompleksler (IC'ler) yapabilmektedirler. CD'lerle IC'lerin oluşturulması misafir molekülün özelliklerinde kayda değer bir gelişmeye neden olur ve bu yüzden CD'ler gıda ve ilaç endüstrileri de dahil olmak üzere birçok alanda geniş bir uygulama yelpazesine sahiptir.
iv
Bu tezde, bazı gıda katkı maddelerinin ve ilaçların CD-IC'lerinden polimer içermeyen elektroeğirilmiş nanolifler üretilmiştir. İlk bölümde, gıda katkı maddelerinden mentol, karvakrol, sinnamaldehit ve beta-karoten molekülleri elektroeğirilmiş modifiye CD nanolifleri ile enkapsüle edilmiştir. Daha sonra CD nanolifleri ile enkapsülasyonun gıda katkı maddeleri üzerindeki etkilerini gözlemlemek için malzemelerin çözünürlüğü, ısı ve ışık stabilitesi, antibakteriyel ve antioksidan aktivitesi incelenmiştir. İkinci bölümde, ilaç olarak kullanılan sülfisoksazol, parasetamol ve kateşin moleküllerinin elektroeğirilmiş CD-IC nanolifleri modifiye CD’ler kullanılarak üretilmiştir. İlaç biyoyararlanımında en kritik noktalardan biri ilacın sudaki çözünürlüğü olduğu için, elde edilen elektroeğirilmiş ilaç/CD-IC nanolifleri ilaç çözünürlüklerindeki değişim açısından incelenmiştir. Analizler ışığında, gıda katkı maddelerinin ve ilaçların, yüksek uçuculuk, düşük çözünürlük ve düşük stabilite gibi temel dezavantajlarının azaldığı veya ortadan kaldırıldığı sonucuna varılabilirken, antioksidan ve antibakteriyel aktiviteler gibi özelliklerin geliştirildiği veya korunduğu görülmüştür.
Anahtar kelimeler: elektroeğirme, nanolifler, modifiye siklodekstrinler, inklüzyon kompleksleri, gıda katkı maddeleri, ilaçlar
v
vi
Acknowledgements
I would like to thank my advisor Dr. Engin Durgun for his support, guidance and efforts. I am also grateful to him for his patience and understanding of me in the last year of my thesis period. I would like to express my sincere gratitude to my co-advisor and my previous co-advisor Prof. Tamer Uyar for his valuable guidance, encouragement and understanding throughout my PhD studies. I am proud of being a member of his group; since he guided me to become a good scientist with his virtue, compassion and diligence.
I would like to thank my thesis tracking committee members Prof. Gülüm Şumnu and Dr. Çağlar Elbüken for their advices and encouragements. I would also acknowledge my jury members Dr. Pınar Yılgör Huri and Dr. Fatih İnci for their contribution to my thesis.
I owe a special thanks to Dr. Asli Çelebioğlu, who is like my sister, not only deep scientific support but also her invaluable friendship, understanding and virtuous personality. I would like to give special thanks to my dearest lab mates and sisters Dr. Yelda Ertaş Doğan and Dr. Zeynep Aytaç for creating such a good working ambiance in the laboratory and also for their help and support in all fields of my life. I would like to acknowledge to former members of Uyar Research Group Dr. Amaresh Chandra Pradhan, Dr. Ali Demirci, Dr. Anitha Senthamizhan, Dr. M. Aref Khalily, Dr. Bekir Satılmış, Dr. Bhushan Patil, Dr. Brabu Balusamy, Dr. Fatma Kayacı-Şenırmak, Dr. Fuat Topuz, Dr. Kugalur Shanmugam Ranjith, Dr. Nalan Oya San-Keskin, Dr. Nuray Gündüz, Dr. Osman Arslan, Dr. Ömer Faruk Sarıoğlu,
vii
Dr. Şefika Özcan. I would like to give special thanks to Dr. Mehmet Emin Kılıç for his fruitful collaboration.
I want to thank my friends at UNAM and especially at office for their friendship, help, support and understanding during my PhD. I am very grateful for having the opportunity to work with UNAM facilities. I am especially thankful to Zeynep Erdoğan, Seda Kutkan and Dr. Gökçe Çelik for their contribution to my thesis and to my life.
I would like to acknowledge TUBITAK (The Scientific and Technological Research Council of Turkey) for funding my research and its scholarship, BIDEB 2211-A and TUBITAK projects #213M185, #114Y264 and #115Z488.
Finally, I would like to express my special gratitude to my family. I am grateful to my dear daughter Betül Yıldız for the deep peace and happiness she gave me. The most difficult part of my acknowledgement is to thank my husband Dr. Yakup Yıldız, since words are not enough to explain what his presence has brought me. I would like to thank him for his support, understanding and being always with me in any case. Deepest thanks go to my mom Emine Gürbüz and father Ahmet Gürbüz for their endless support, prayers and beliefs to me. I would like to thank my mother in law Kadriye Yıldız and my father in law Nizamettin Yıldız for their support during thesis period and their prayers. I owe my mothers and fathers special thanks since during thesis writing period, they are like a babysitter and cook without any complaining. I would also like to thank my brother Dr. Okan Gürbüz who has made great contributions to my life and his precious wife Tuğba Gürbüz, who always supports me with her ideas. I send my love to my niece Ela Nas Gürbüz who gives
viii
me positive energy with her loveliness. I would also like to thank my aunt Emriye Cengiz and her family members and my dear cousins Esin Cengiz, Kübra-Abdülkadir-Gülayşe Yüzbaşıoğlu, and Berra-Aytül-Turgut Cengiz who were always with me during my happy and troubled times.
ix
Table of Contents
ABSTRACT ... İ ÖZET ... İİİ ACKNOWLEDGEMENTS ... Vİ TABLE OF CONTENTS ... İX LIST OF ABBREVIATION ... XVİ LIST OF FIGURES ... XVİİ LIST OF TABLES ... XXVİ CHAPTER 1 ... 1 INTRODUCTION ... 1 1.1 Electrospinning ... 1 1.2 Cyclodextrin ... 41.3 Electrospinning of cyclodextrin inclusion complexes ... 9
CHAPTER 2 ... 11
ENCAPSULATIONOFFOODADDITIVESBYCYCLODEXTRIN FUNCTIONALIZEDELECTROSPUNNANOFIBERS ... 11
2.1 Menthol/cyclodextrin inclusion complex nanofibers: Enhanced water solubility and high-temperature stability of menthol ... 11
2.1.1 Introduction ... 11
x
2.1.2.1 Materials ... 13
2.1.2.2 Preparation of electrospinning solutions ... 14
2.1.2.3 Electrospinning of nanofibers ... 15
2.1.2.4 Measurements and characterizations... 15
2.1.3 Results and Discussion ... 19
2.1.3.1 Phase solubility studies ... 19
2.1.3.2 Computational modeling ... 20
2.1.3.3 Morphological analyses ... 23
2.1.3.4 Structural characterizations ... 26
2.1.3.5 The molar ratio of menthol in menthol/CD-IC NFs ... 28
2.1.3.6 Thermal characterization ... 30
2.1.3.7 Release studies ... 32
2.1.3.8 Dissolution behaviour ... 33
2.1.4 Conclusion ... 34
2.2 Fast-dissolving carvacrol/cyclodextrin inclusion complex electrospun fibers with enhanced thermal stability, water solubility, and antioxidant activity ... 35 2.2.1 Introduction ... 35 2.2.2 Experimental ... 37 2.2.2.1 Materials ... 37 2.2.2.2 Preparation of solutions ... 37 2.2.2.3 Electrospinning of nanofibers ... 37
2.2.2.4 Measurements and characterizations... 38
xi
2.2.3.1 Phase solubility studies ... 41
2.2.3.2 Computational modelling ... 42
2.2.3.3 Morphological analyses ... 46
2.2.3.4 Structural characterization ... 49
2.2.3.5 The molar ratio of carvacrol in carvacrol/CD-IC fibers ... 50
2.2.3.6 Thermal characterization ... 54
2.2.3.7 Antioxidant property ... 55
2.2.3.8 Dissolution behaviour ... 58
2.2.4 Conclusion ... 59
2.3 Molecular Encapsulation of Cinnamaldehyde within Cyclodextrin Inclusion Complex Electrospun Nanofibers: Fast-dissolution, Enhanced Water Solubility, High Temperature Stability and Antibacterial Activity of Cinnamaldehyde ... 60
2.3.1 Introduction ... 61
2.3.2 Experimental ... 65
2.3.2.1 Materials ... 65
2.3.2.2 Preparation of electrospinning solutions ... 65
2.3.2.4 Electrospinning of nanofibers ... 66
2.3.2.5 Measurements and characterizations... 66
2.3.3 Results and discussion ... 70
2.3.3.1 Phase solubility studies ... 70
2.3.3.2 Computational modeling ... 71
2.3.3.3 Morphological analyses ... 76
xii
2.3.3.5 Thermal characterization ... 83
2.3.3.6 Antibacterial activity ... 85
2.3.3.7 Dissolution behaviour ... 86
2.3.4 Conclusion ... 90
2.4 β-carotene/cyclodextrin inclusion complex nanofibers: Antioxidant activity and enhanced photostability ... 91
2.4.1 Introduction ... 91
2.4.2 Experimental ... 92
2.4.2.1 Materials ... 92
2.4.2.2 Preparation of electrospinning solution ... 93
2.4.2.3 Electrospinning of nanofibers ... 93
2.4.2.4 Measurements and characterizations... 93
2.4.3 Results and discussion ... 96
2.4.3.1 Phase solubility studies ... 96
2.4.3.2 Computational modeling ... 97 2.4.3.3 Morphological analyses ... 101 2.4.3.4 Structural characterization ... 103 2.4.3.5 Antioxidant activity ... 104 2.4.3.6 Photostability ... 105 2.4.4 Conclusion ... 106 CHAPTER 3 ... 107
ENCAPSULATIONOFDRUGSBYCYCLODEXTRIN FUNCTIONALIZEDELECTROSPUNNANOFIBERS ... 107
xiii
3.1. Polymer-free electrospun nanofibers from sulfobutyl ether7
-beta-cyclodextrin (SBE7-β-CD) inclusion complex with sulfisoxazole:
Fast-dissolving and enhanced water solubility of sulfisoxazole ... 107
3.1.1 Introduction ... 107
3.1.2 Experimental ... 109
3.1.2.1 Materials ... 109
3.1.2.2 Preparation of solutions ... 110
3.1.2.3 Electrospinning of nanofibers ... 111
3.1.2.3 Measurements and characterizations... 111
3.1.3 Results and discussion ... 114
3.1.3.1 Phase solubility studies ... 114
3.1.3.2 Morphological analyses ... 115
3.1.3.3 The molar ratio of sulfisoxazole in sulfisoxazole/CD-IC NFs 117 3.1.3.4. Thermal characterization ... 118
3.1.3.5 Structural caharcterization ... 120
3.1.3.4 Dissolution behaviour ... 123
3.1.4 Conclusions ... 126
3.2 Fast-dissolving electrospun nanofibrous films of paracetamol/cyclodextrin inclusion complexes ... 127
3.2.1 Introduction ... 127
3.2.2 Experimental ... 129
3.2.2.1 Materials ... 129
3.2.2.2 Preparation of electrospinning solutions ... 129
xiv
3.2.2.3 Measurements and characterizations... 131
3.2.3 Results and discussion ... 133
3.2.3.1 Morphological analyses ... 133
3.2.3.2 The molar ratio of paracetamol in paracetamol/CD-ICs ... 136
3.2.3.3 Structural characterization ... 138
3.2.3.4 Thermal characterization ... 141
3.2.3.5 Dissolution behavior ... 142
3.2.4 Conclusion ... 143
3.3 Fast-dissolving electrospun nanofibrous films of catechin/CD-IC NFs with enhanced antioxidant activity ... 144
3.3.1 Introduction ... 144
3.3.2 Experimental ... 145
3.3.2.1 Materials ... 145
3.3.2.2 Preparation of electrospinning solutions ... 146
3.3.2.3 Electrospinning of nanofibers ... 146
3.3.2.4 Measurements and characterizations... 147
3.3.3 Results and discussion ... 149
3.3.3.1 Morphological analyses ... 149 3.3.3.2 Structural characterization ... 150 3.3.3.3 Dissolution behavior ... 153 3.3.3.4 Antioxidant activity ... 154 3.3.4 Conclusion ... 156 CHAPTER 4 ... 157
xv
LIST OF PUBLICATIONS ... 160 BIBLIOGRAPHY ... 164
xvi
LIST OF ABBREVIATION
AFD Average fiber diameter
CD Cyclodextrin
α-CD α-cyclodextrin
β-CD β-cyclodextrin
γ-CD γ -cyclodextrin
d6-DMSO Deuterated dimethylsulfoxide DSC Differential scanning calorimeter DMF N,N Dimethylformamide
DPPH 2,2-diphenyl-1-picrylhydrazyl
E. coli Escherichia coli
EOs Essential oils
Ecomp Complexation energy
Esolv Solvation energy
FTIR Fourier transform infrared spectrometer
HS GC-MS Headspace gas chromatography-mass spectrometry HPβCD Hydroxypropyl-β-cyclodextrin HPγCD Hydroxypropyl-γ-cyclodextrin IC Inclusion complex IZ Inhibition zone Ks Stability constant NFs Nanofibers
PVA Polyvinyl alcohol
1H NMR Proton nuclear magnetic resonance
SBE-β-CD Sulfobutlyether-β-cyclodextrin SEM Scanning electron microscope TGA Thermogravimetric analyzer XRD X-ray diffraction
xvii
LIST OF FIGURES
Figure 1. (a) Electrospinning set-up at UNAM and (b) representative schematic view of electrospinning components. ... 2
Figure 2. Chemical structure and schematic view of α-CD, β-CD and γ-CD. ... 6 Figure 3. (a) Chemical structure and the schematic view of the modified HPβCD or SBE-β-CD, (b) schematic representation of the primary and secondary side of CD molecules. ... 7
Figure 4. Schematic view of IC formation between CD and guest molecule. ... 8
Figure 5. (a) The chemical structure of HPβCD; the schematic representation of menthol/CD-IC formation, menthol/CD-IC aqueous solutions and (b) electrospinning of nanofibers. ... 13
Figure 6. Phase solubility diagrams of menthol/HPβCD-IC and menthol/HPγCD-IC, (n = 3). ... 20
Figure 7. The optimized, lowest energy configurations of side views of ICs of (a) HPβCD and (b) HPγCD; and top view of ICs of (c) HPβCD and (d) HPγCD with menthol. The tail and head vertical orientation of menthol is shown by arrows. (Blue, pink, and light brown balls represent carbon, oxygen, and hydrogen atoms, respectively). ... 22 Figure 8. The photographs of (a) menthol/HPβCD-IC NFs and (b) menthol/HPγCD-IC NFs; SEM images of (c) menthol/HPβCD-menthol/HPγCD-IC NFs and (d) menthol/HPγCD-menthol/HPγCD-IC
xviii
NFs; the fiber diameter distribution with average fiber diameter (AFD) of (e) menthol/HPβCD-IC NFs and (f) menthol/HPγCD-IC NFs. ... 24
Figure 9. FTIR spectra of pure menthol, pure CD NFs and menthol/CD-IC NFs. 27
Figure 10. XRD patterns of pure menthol, pure CD NFs and menthol/CD-IC NFs. ... 28
Figure 11. 1H NMR spectra of (a) menthol/HPβCD-IC NFs and (b)
menthol/HPγCD-IC NFs dissolved in d6-DMSO. ... 30
Figure 12. TGA thermogram of pure menthol, pure CD NFs and menthol/CD-IC NFs. ... 32 Figure 13. The cumulative release of menthol from menthol/HPβCD-IC NFs and menthol/HPγCD-IC NFs at 37 °C and 75 °C, (n = 3). ... 33
Figure 14. Presentation of the solubility behavior of menthol, menthol/HPβCD-IC NFs and menthol/HPγCD-IC NFs for a few seconds of water exposure (the arrows show the undissolved menthol crystals). ... 34 Figure 15. (a) The chemical structure of HPβCD and carvacrol; the schematic representation of carvacrol/CD-IC formation and (b) electrospinning of fibers from carvacrol/CD-IC solutions. ... 36 Figure 16. Phase solubility diagrams of carvacrol/HPβCD-IC and carvacrol/HPγCD-IC solutions, (n=3). ... 42
xix
Figure 17. Top and side view of inclusion complexes of (a) HPβCD and (b) HPγCD with carvacrol. The tail and head vertical orientation of carvacrol is shown by arrows. (Blue, pink and light brown balls represent carbon, oxygen, and hydrogen atoms, respectively). ... 44 Figure 18. The photographs of (a) carvacrol/HPβCD-IC fibers and (b) carvacrol/HPγCD-IC fibers; SEM images of electrospun fibers obtained from the solutions of (c) carvacrol/HPβCD-IC and (d) carvacrol/HPγCD-IC. ... 47
Figure 19. FTIR spectra of pure carvacrol, pure CD fibers and carvacrol/CD-IC fibers. ... 50
Figure 20. 1H-NMR spectra of (a) carvacrol/HPβCD-IC and (b) carvacrol/HPγCD-IC fibrous web dissolved in d6-DMSO. ... 52
Figure 21. 1H-NMR spectra of (a) carvacrol/HPβCD-IC and (b) carvacrol/HPγCD-IC fibrous web (dissolved in d6-DMSO) which were produced 3 years ago. ... 53
Figure 22. (a) TGA thermograms and (b) their derivatives for pure carvacrol, pure CD fibers and carvacrol/CD-IC fibers. ... 54
Figure 23. Carvacrol concentration dependent antioxidant test graphs and the resulting DPPH solution photographs of (a) Carvacrol/HPβCD-IC fibers and (b) Carvacrol/HPγCD-IC fibers. ... 56
Figure 24. Concentration dependent antioxidant test graph and the resulting DPPH solution photographs of pure carvacrol. ... 57
xx
Figure 25. Carvacrol concentration dependent antioxidant test graph and the resulting DPPH solution photographs of Carvacrol/HPβCD-IC Fibers and Carvacrol/HPγCD-IC Fibers which were produced 3 years ago. ... 58
Figure 26. Presentation of the solubility behavior of carvacrol/HPβCD-IC fibrous web and carvacrol/HPγCD-IC fibrous web in water. The carvacrol/CD-IC fibrous webs are dissolved in less than a second. ... 59
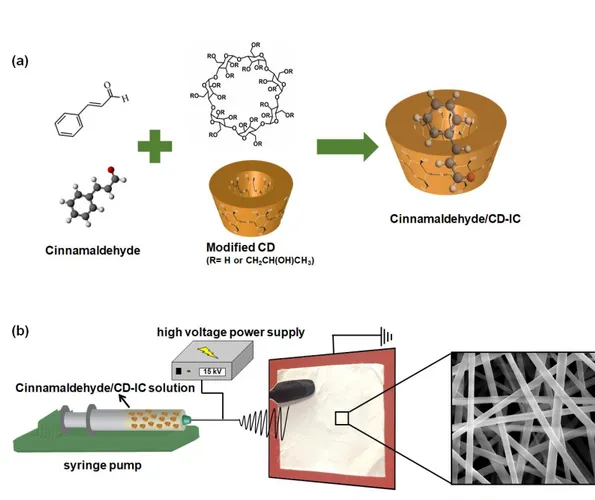
Figure 27. (a) Molecular structure of cinnamaldehyde and HP-β-CD (note: HP-γ-CD has a similar chemical structure with eight glucopyranose units), and illustration of cinnamaldehyde/CD-IC formation, (b) electrospinning process of NFs from cinnamaldehyde/CD-IC solution. ... 64 Figure 28. The phase solubility diagram of cinnamaldehyde/HPβCD-IC and cinnamaldehyde/HPγCD-IC in aqueous systems (n = 3). ... 71
Figure 29. (a) Formation of inclusion complexes in 1:1 stoichiometry between cinnamaldehyde and CDs; (i) top and side view of cinnamaldehyde/HPβCD-IC, (ii) top and side view of cinnamaldehyde/HPγCD-IC and (iii) the variation of interaction energy of cinnamaldehyde with CD as a function of distance, and (b) Formation of inclusion complexes in 2:1 stoichiometry between cinnamaldehyde and CDs; (i) top and side view of cinnamaldehyde/HPβCD-IC, (ii) top and side view of cinnamaldehyde/HPγCD-IC and (iii) the variation of interaction energy of cinnamaldehyde with CD as a function of distance. The possible orientations of cinnamaldehyde are shown as inset. Blue, purple, and light pink balls represent carbon, oxygen, and hydrogen atoms, respectively. ... 73
xxi
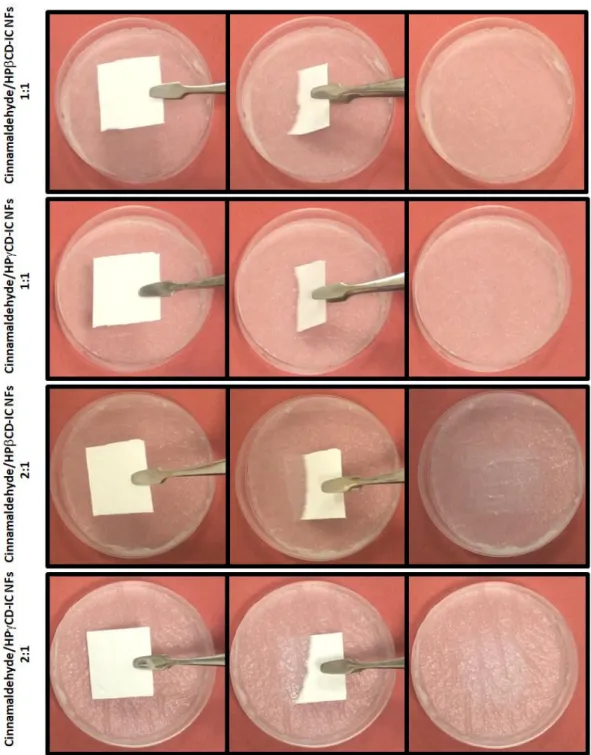
Figure 30. The digital photograph of (a) cinnamaldehyde/HPβCD-IC NF mat (1:1), (b) cinnamaldehyde/HPβCD-IC NF mat (2:1), (c) cinnamaldehyde/HPγCD-IC NF mat (1:1), and (d) cinnamaldehyde/HPγCD-IC NFs (2:1) mat. The representative SEM images of (e) cinnamaldehyde/ HPβCD-IC NFs (1:1), (f) cinnamaldehyde/HPβCD-IC NFs (2:1), (g) cinnamaldehyde/HPγCD-IC NFs (1:1), (h) cinnamaldehyde/HPγCD-IC NFs (2:1)... 78
Figure 31. 1H-NMR spectra of (a) pure cinnamaldehyde, (b) cinnamaldehyde/HPβCD-IC NFs (1:1), (c) cinnamaldehyde/HPβCD-IC NFs (2:1), (d) cinnamaldehyde/HPγCD-IC NFs (1:1), (e) cinnamaldehyde/HPγCD-IC NFs (2:1). The 1H-NMR spectra were recorded by dissolving the samples in d6-DMSO. The characteristic peaks of cinnamaldehyde are shown by black stars. ... 81
Figure 32. The FTIR spectra of pure cinnamaldehyde, pristine CD NFs, and cinnamaldehyde/CD-IC NFs. ... 82
Figure 33. The TGA thermogram of pure cinnamaldehyde and cinnamaldehyde/CD-IC NFs. ... 84
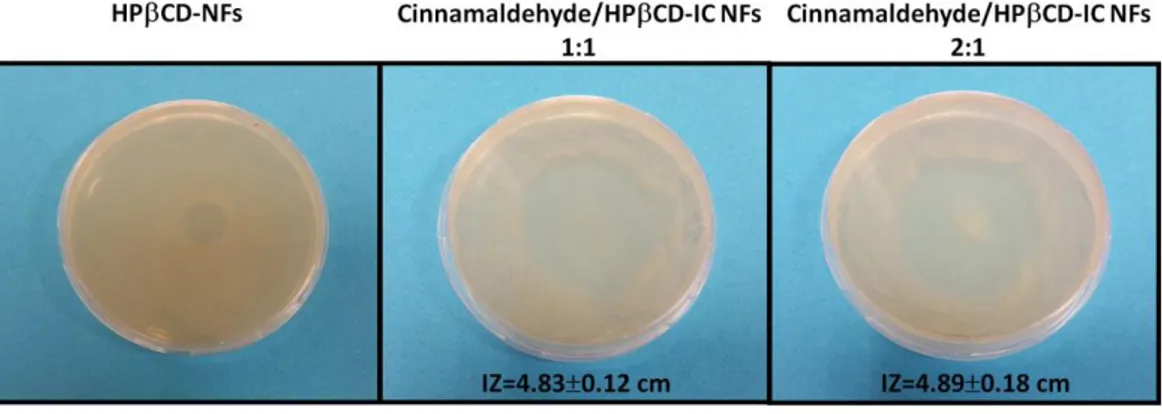
Figure 34. Representative digital photographs of antibacterial test plates of pristine CD NF mats and cinnamaldehyde/CD-IC NF mats against E. coli. The average IZ obtained from agar diffusion method (n = 3). ... 86
Figure 35. Representation of dissolution behavior of cinnamaldehyde/CD-IC NF mats when exposed to distilled water. The cinnamaldehyde/CD-IC NF mats are dissolved completely in a few seconds. ... 88
xxii
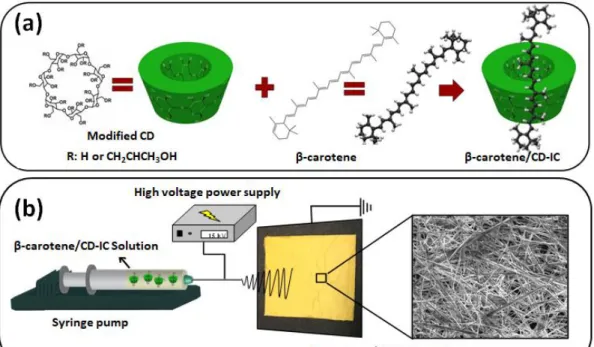
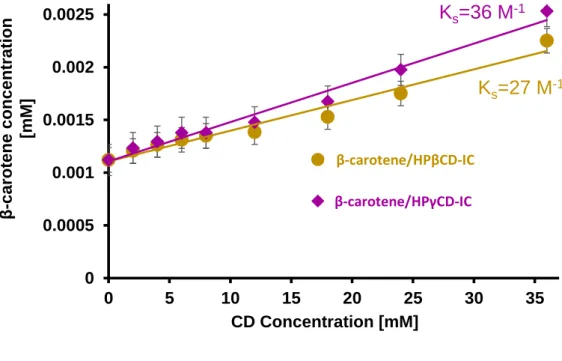
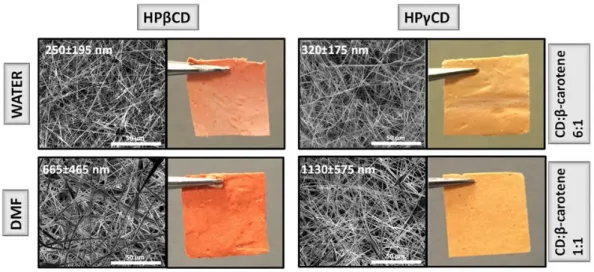
Figure 36. Representation of dissolution behavior of cinnamaldehyde/CD-IC NF mats when contacted to water soaked absorbent paper. The cinnamaldehyde/CD-IC NF mats are dissolved instantly. ... 89 Figure 37. (a) Molecular structure of β-carotene and HPβCD (note: HPγCD has a similar chemical structure with eight glucopyranose units), and illustration of carotene/CD-IC formation, (b) electrospinning process of NFs from β-carotene/CD-IC solution. ... 92 Figure 38. Phase solubility diagrams of carotene/HPβCD-IC and β-carotene/HPγCD-IC, (n = 3). ... 97
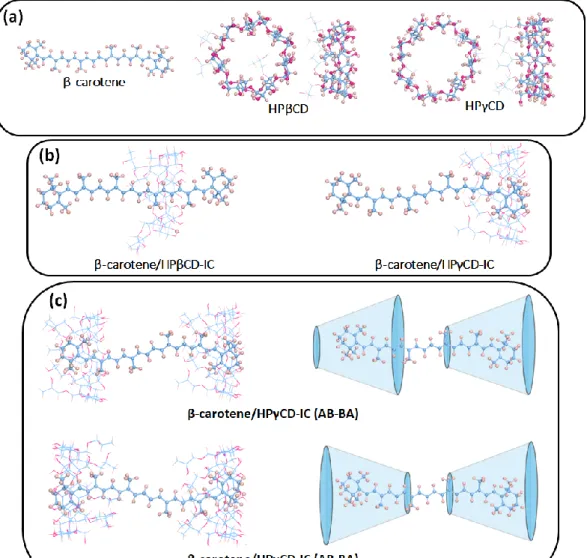
Figure 39. (a) optimized structures of β-carotene, HPβCD and HPγCD, (b) formation of inclusion complexes in 1:1 stoichiometry between CDs and β-carotene, and (c) formation of inclusion complexes in 2:1 stoichiometry between HPγCD and β-carotene with two different configurations. ... 99
Figure 40. The photographs and SEM images of optimized β-carotene /CD-IC NFs. ... 101 Figure 41. The XRD patterns of β-carotene, CD NFs and β-carotene/CD-IC NFs obtained in different solvents. ... 103 Figure 42. FTIR spectra of β-carotene, CD NFs and β-carotene/CD-IC NFs obtained in different solvents. ... 104
Figure 43. Time dependent antioxidant test graphs of carotene and β-carotene/CD-IC NFs. ... 105
xxiii
Figure 44. Antioxidant test graphs of β-carotene and β-carotene/CD-IC NFs after exposure to UV-light. ... 106
Figure 45. (a) The chemical structure of sulfisoxazole and SBE7-β-CD with a
schematic representation of sulfisoxazole, SBE7-β-CD and their IC, (b) Schematic
representation of the electrospinning of sulfisoxazole/SBE7-β-CD-IC nanofibers
(NF). ... 109
Figure 46. Phase solubility diagram of sulfisoxazole/ SBE7-β-CD systems in water
(n=3). ... 115
Figure 47. Photographs of electrospun (a) SBE7-β-CD NF, (b) sulfisoxazole/SBE7
-β-CD-IC NF, and SEM images of (c) SBE7-β-CD NF, (d) sulfisoxazole/SBE7
-β-CD-IC NF. ... 117
Figure 48. 1H NMR spectra of (a) sulfisoxazole powder, (b) SBE7-β-CD NF and
SBE7-β-CD powder, (c) sulfisoxazole/SBE7-β-CD-IC NF, (d) sulfisoxazole/SBE7
-β-CD-IC powder. ... 118
Figure 49. (a) TGA thermograms and (b) their derivatives of sulfisoxazole, SBE7
-β-CD NF and sulfisoxazole/SBE7-β-CD-IC NF. ... 119
Figure 50. DSC thermogram of sulfisoxazole, SBE7-β-CD NF, sulfisoxazole/SBE7
-β-CD-IC NF and sulfisoxazole/SBE7-β-CD-IC powder. ... 120
Figure 51. XRD patterns of sulfisoxazole, SBE7-β-CD NF sulfisoxazole/SBE7-β-CD-IC NF and sulfisoxazole/SBE7-β-sulfisoxazole/SBE7-β-CD-IC powder. ... 122
xxiv
Figure 52. FTIR spectra of sulfisoxazole, SBE7-β-CD NF and sulfisoxazole/SBE7-β-CD-IC NF. ... 123
Figure 53. Water solubility diagram of *sulfisoxazole with concentration of its water solubility (green), **excess amount of sulfisoxazole (pink), sulfisoxazole/SBE7-β-CD-IC NF having the same excess amount of sulfisoxazole (blue), sulfisoxazole/SBE7-β-CD-IC powder having the same excess amount of sulfisoxazole (purple). ... 125
Figure 54. Presentation of the solubility behaviour of sulfisoxazole (represented by "SFO"), sulfisoxazole/SBE7-β-CD-IC NF and sulfisoxazole/SBE7-β-CD-IC powder for a few seconds of water exposure. ... 126
Figure 55. The schematic representation and chemical structure of (a) Paracetamol, CDs and paracetamol/CD-ICs; (b) electrospinning of paracetamol/CD-IC solution. ... 131 Figure 56. The photographs of (a) paracetamol/HPβCD-IC NFs and (b) paracetamol/SBE-β-CD-IC NFs; SEM images of electrospun (c) paracetamol/HPβCD-IC NFs and (d) paracetamol/SBE-β-CD-IC NFs. ... 134
Figure 57. The 1H-NMR spectra of (a) paracetamol/HPβCD-IC NFs and (b) paracetamol/SBE-β-CD-IC NFs which was dissolved in d6-DMSO. ... 137
Figure 58. The FTIR spectra of paracetamol, pure CD NFs and paracetamol/CD-IC NFs. ... 139
xxv
Figure 59.(a) The XRD patterns of paracetamol, pure CD NFs and paracetamol/CD-IC NFs and (b) the DSC thermogram of paracetamol, pure CD NFs and paracetamol/CD-IC NFs... 140
Figure 60. The TGA thermograms and derivatives of paracetamol, pure CD NFs and paracetamol/CD-IC NFs. ... 142
Figure 61. The dissolution behavior of paracetamol/HPβCD-IC NFs and paracetamol/SBE-β-CD-IC NFs with two different methods; (a) addition of distilled water and (b) exposure to distilled water soaked absorbent paper. The paracetamol/CD-IC NFs are dissolved in less than a second. ... 143
Figure 62. The photographs and SEM images of optimized (a) catechin/CD-IC NFs and (b) catechin/PVA NFs. ... 150
Figure 63. 1H NMR spectra of catechin, CD NFs, PVA NFs, catechin/CD-IC powder, catechin/CD-IC NFs and catechin/PVA NFs. ... 151
Figure 64. The XRD patterns of catechin, CD NFs, PVA NFs, catechin/CD-IC powder, catechin/CD-IC NFs and catechin/PVA NFs. ... 152
Figure 65. FTIR Spectra of catechin, CD NFs, PVA NFs, catechin/CD-IC powder, catechin/CD-IC NFs and catechin/PVA NFs. ... 153
Figure 66. Dissolution behaviour of (a)catechin, (b) catechin/CD-IC powder, (c) catechin/CD-IC NFs and (d) catechin/PVA NFs. ... 154
Figure 67. Concentration dependent antioxidant test graphs of catechin, catechin/PVA NFs, catechin/CD-IC NFs and catechin/CD-IC powder. ... 155
xxvi
LIST OF TABLES
Table 1. General properties of native CDs. ... 5 Table 2. Complexation and solvation energies of the menthol, CDs (HPβCD and HPγCD) and menthol within CDs at different orientations. ... 23
Table 3. The properties of the solutions used for electrospinning and morphological characteristics of the resulting menthol/CD-IC NFs. ... 25 Table 4. Complexation and solvation energies of the carvacrol, CDs (HPβCD and HPγCD) and carvacrol within CDs at different orientations. ... 46
Table 5. The properties of the solutions used for electrospinning and morphological characteristics of the resulting carvacrol/CD-IC fibers. ... 48
Table 6. Complexation and solvation energies of the cinnamaldehyde, CDs (HPβCD and HPγCD) and cinnamaldehyde within CDs at different molar ratios and different orientations. ... 74
Table 7. The properties of the solutions used for electrospinning and diameter of the resulting cinnamaldehyde/CD-IC NFs. ... 79 Table 8. Complexation and solvation energies of the β-carotene, CDs (HPβCD and HPγCD) and β-carotene within CDs at different molar ratios and different orientations. ... 100
Table 9. The properties of the solutions used for electrospinning and diameter of the resulting β-carotene/CD-IC NFs. ... 102
xxvii
Table 10. The properties of the solutions used for electrospinning and morphological characteristics of the resulting paracetamol/CD-IC NFs. ... 135
1
CHAPTER 1
INTRODUCTION
1.1 Electrospinning
Electrospinning is an efficient method to produce fibrous mats composed of continuous fibers diameter ranging from several microns to few nanometers. Although there are some other methods for the production of nanofibers (melt fibrillation, gas spinning, island-in-sea, self-assembly, phase separation, melt drawing), electrospinning is preferred due to its relatively low cost, relatively high production rate, simplicity of setup [1, 2]. Another superior feature of electrospinning to other methods is capability of fiber production from a variety of materials including synthetic and natural polymers, polymer blends, inorganic materials, sol-gels, ceramics and composite materials [3, 4].
Electrospinning set-up is mainly composed of three parts: high voltage power supply, syringe pump and collector. Electrospinning set-up found in our laboratory at UNAM is shown in Figure 1a with representative schematic view of its components (Figure 1b). In this system, polymer solution or melt is hosted by a syringe connected to a needle. Syringe pump provides pumping of a solution through the needle at a constant and controllable rate. The application of a high voltage to a polymer solution induces charges within the fluid. Then, charges within the highly electrified fluid are distributed over the surface of the drop at the tip of the needle and electrostatic forces and interactions cause deformation in the drop at
2
the cone-shaped known as Taylor-cone. When electric field reached a critical amount, electrostatic forces overcome the surface tension of polymer solution and a liquid jet from the tip of needle is ejected. While jet goes towards the grounded collector, solvent evaporates and stretching and whipping process leading to formation of thin and long fibers occur. As a result, fibers are deposited on the collector as a nanofibrous webs [5, 6].
Figure 1. (a) Electrospinning set-up at UNAM and (b) representative schematic view of electrospinning components.
Resultant electrospun nanofibers can have different thickness and different morphologies from beaded to porous structures. There are some parameters of electrospinning process effective on these differences in fibrous structure. These
3
parameters can be classified mainly under three titles; polymer solution parameters, processing conditions and ambient conditions [6]. Polymer solution parameters categorized as type and molecular weight of polymer, solution viscosity, solution conductivity and surface tension are highly effective on structure of resultant nanofibers [7-12]. In order to maintain continuity of electrospinning jet during electrospinning, chain entanglement of polymer is required and amount of chain entanglement is determined by molecular weight of polymer, solution viscosity and solution concentration. Since stretching of the solution in electrospinning is due to repulsion of charges, conductivity of the solution is critical parameter [6]. Applied voltage, feed rate of solution, distance between syringe and collector, collector type, diameter of needle called as processing conditions are other factors effective on nanofiber structure [7, 9]. Application of high voltage is required to initiate the electrospinning process. A higher voltage results in greater stretching due to greater columbic forces in the jet which cause formation of thinner fibers. On the other hand, finer fibers may be obtained when a lower voltage is applied. Therefore, the optimum voltage for electrospinning should be adjusted. Solvent evaporation is directly related with the feed rate, and distance between collector and needle tip. Distance between collector and the tip of needle also critical for the strength of the electric field. If the distance is too low, solvent does not have enough time to evaporate and fibers merge; however, if the distance is too large, there is no enough electric field to obtain stretching of solution [6]. Temperature and humidity in other words ambient conditions are other parameters affecting structure of resultant nanofibers [6, 10, 13]. Ambient conditions are known to affect solution viscosity and solvent evaporation which are critical for electrospinning.
4
It is also possible to obtain nanofibers having different morphology like aligned, porous, core-shell and hollow by varying the electrospinning parameters. In case of fixed collector, nanofibers are collected randomly on collector: however, nanofibers can be aligned by using cylindrical rotating collector [14]. Nanofibrous webs already have porous structure; however, porous structure on single fiber can also be obtained by using different approaches [15, 16]. Core-shell nanofibers that have different materials in core and shell part can be obtained by using nozzle specified for this system [17]. Hollow nanofibers are produced by removing core part of core-shell nanofibers [18].
Electrospun nanofibers can be applicable in many areas thanks to their high surface area, light-weight, nano-porous structure and distinctive physical and mechanical properties. Besides, the application of nanofibers can be expanded by fucntionalizing nanofibrous webs with nanoparticles [19-21], drugs [22, 23], food additives [24, 25], inorganic materials [26, 27], etc. As a result, thanks to its unique properties, electrospun nanofibers have potentials to apply in many areas such as food and agriculture [25, 28-41], filtration [42-45], sensors [46-48], energy and electronics [49-51], biomedical [17, 22, 23, 52-55], and enzyme [56] and catalyst [57-60].
1.2 Cyclodextrin
Cyclodextrins (CDs) are cyclic oligosaccharides composed of glucopyranose units linked by α-(1,4)-glycosidic bonds. CDs are produced by enzymatic degradation of starch. Glucosyl transferase (CGTase) is used as an enzyme to hydrolyze off one or several turn of the amylose helix of starch and then the ends are joined together
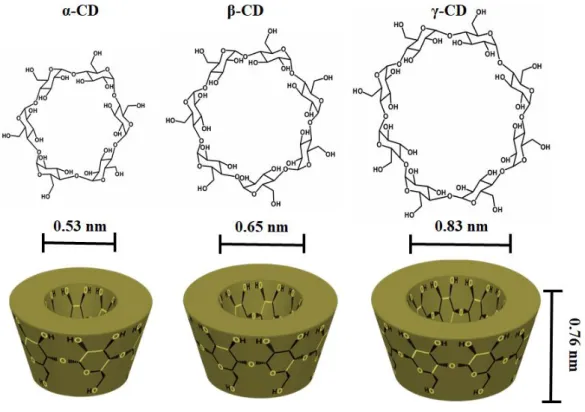
5
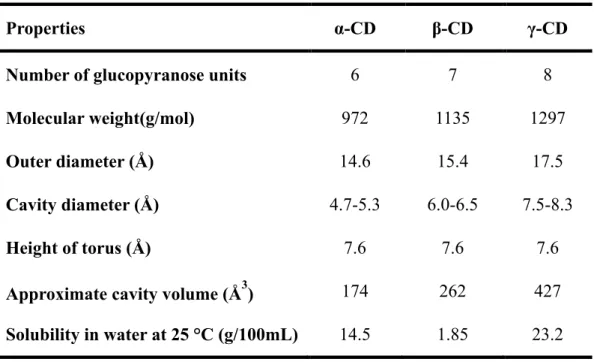
which results in truncated cone torus-like structure (Figure 2) [56, 61]. As a result of this enzymatic degradation, cyclic oligosaccharides mostly having six, seven and eight glucopyranose units called as α-CD, β-CD and γ-CD are obtained, respectively (Figure 2) [61]. These three CD types are generally named as “native CD” which are considered as first generation, parent or major CDs [56, 62]. The main characteristics of these native CDs are given in Table 1. The solubility of CDs in water are determined by H-bonding in CD ring between C-2-OH group of one glucopyranose unit and C-3-OH group of the adjacent glucopyranose unit [56, 61]. β-CD has a rigid structure thanks to complete secondary belt formation by these H-bonds which is probably reason for the lowest water solubility of β-CD among all CDs [56]. For α-CD, there is an incomplete H-bond belt due to distorted position of one glucopyranose unit which results in formation of four H-bond instead of six. On the other hand, noncoplanar structure of CD makes it more flexible and so γ-CD has the highest water solubility of three native γ-CDs (Table 1) [56].
Table 1. General properties of native CDs.
Properties α-CD β-CD γ-CD
Number of glucopyranose units 6 7 8
Molecular weight(g/mol) 972 1135 1297
Outer diameter (Å) 14.6 15.4 17.5
Cavity diameter (Å) 4.7-5.3 6.0-6.5 7.5-8.3
Height of torus (Å) 7.6 7.6 7.6
Approximate cavity volume (Å3) 174 262 427 Solubility in water at 25 °C (g/100mL) 14.5 1.85 23.2
6
Figure 2. Chemical structure and schematic view of α-CD, β-CD and γ-CD.
Besides these naturally occurring CD types, many CD derivatives are synthesized by chemical modifications. CD molecules are generally modified in which either primary or secondary hydroxyl groups of CDs (Figure 3b) are substituted with different groups like alkly, hyroxyalkyl, carboxyalkyl, amino, thio, tosyl, ether, ester, etc. [62, 63]. There are different aims for such modifications like; to increase solubility of CDs and its complexes; to increase association between CD and its guest; or to obtain insoluble CDs [63]. Industrial production and marketing of CD derivatives require simple production reactions, being nontoxic, having acceptable price, keeping its complex forming ability [56]. Therefore, although there are too many possible CD derivatives, many of them have no production and utilization. On the other hand, highly water soluble hydroxyalkylated CDs,
hydroxypropyl-β-7
CD (HPβCD) and hydroxypropyl-γ-CD (HPγCD), and sulfobutylether-β-CD (SBE-β-CD) are industrially produced in high amounts (Figure 3a) [56].
Figure 3. (a) Chemical structure and the schematic view of the modified HPβCD or SBE-β-CD, (b) schematic representation of the primary and secondary side of
CD molecules.
In CD molecule structure, glucopyranose units are aligned in register such that all secondary hydroxyl groups (C2 and C3) are located on one side and primary hydroxyls (C6) are located on the other side [61]. Since primary hydroxyls have freedom for rotation, the diameter of two sides are different from each other; narrower (primary hydroxyls) and wider (secondary hydroxyls) (Figure 3b) [56, 61]. The internal cavity of CDs is occupied by C3 and C5 hydrogens, and
8
glycosidic oxygen bridges which results in relatively hydrophobic cavity [61, 62]. Thanks to this unique molecular structure of CDs, they can form non-covalent host-guest inclusion complexes with host-guest molecules having appropriate dimension and polarity (Figure 4) [61, 62]. Weak bonds are formed or broken during formation of inclusion complexes in aqueous solution of CD and guest molecule. In an aqueous solution, relatively apolar cavity of CD is filled by water molecules which is unfavorable due to polar-apolar interaction. Therefore, water molecules can be substituted by suitable guest molecule which is less polar than water [56, 63]. In other words, substitution of the enthalpy rich water molecules by appropriate guest molecules is the main driving force for the formation of inclusion complexes [62, 63]. There are several methods to form CD inclusion complexes (CD-IC) which are coprecipitation, slurry, paste, dry mixing, etc. [64]. Coprecipitation method is the most suitable one for laboratory scale preparation of CD-IC. In this method, solution of CD in water was prepared and guest molecule is added to the solution which provides favorable condition for formation of CD-IC [64].
Figure 4. Schematic view of IC formation between CD and guest molecule. Formation of CD-IC offers profound effects on the properties of guest molecules such as solubility enhancement, stabilization of labile molecules against light, heat
9
and oxidation, control of volatility, controlled release of guests, and taste modification [62, 64]. Therefore, CDs has wide range of application area in pharmaceuticals [65-67], functional foods [68, 69], cosmetics [70, 71], home/personal care [72] and filtration/membrane[45, 73].
1.3 Electrospinning of cyclodextrin inclusion complexes
Drugs and food additives have some restrictions including low aqueous solubility, low stability against external factors such as light, heat, oxygen, high volatility, and unpleasant taste and odor. Thus, encapsulation of drugs and food additives by using different methods has attracted attention of food and pharmaceutical industries. Formation of CD-ICs are one of the most common encapsulating methods. Besides being very attractive host material due to their structure and properties, non-toxic nature of CDs makes them quite useful for food and pharmaceutical applications. CD-encapsulated molecules can be protected from external factors while increasing their solubility and so their stability, bioavailability and shelf-life are enhanced [74-76]. There are many studies on CD encapsulation in literature to enhance properties of drugs and food additives while removing their drawbacks [75-80]. On the other hand, unique properties of electrospun nanofibrous materials such as nanoporous structure, large surface area, lightweight and design flexibility make them attractive material to encapsulate food additives and drugs [81, 82].
It is also possible to combine the properties of CD-ICs and electrospun nanofibers by integrating CD-ICs of active agents into electrospun nanofibrous mats. CD-ICs of some drugs and food additives were formed and incorporated into polymeric electrospun nanofibers by our group [23, 30, 37-39, 53, 83-87]. In general,
10
electrospun fibrous materials are obtained by using polymer since long polymer chains provide chain entanglements and overlapping for the fiber formation during the electrospinning process [6, 88, 89]. Therefore, use of small molecules to obtain electrospun nanofibers presents a real challenge. Nonetheless, Celebioglu and Uyar successfully produced uniform nanofibers from CDs without any polymeric matrices, since CD molecules in their highly concentrated solutions can form aggregates via hydrogen bonding [90, 91]. In the light of this, IC nanofibrous webs of CDs with different guest molecules were produced to enhance properties of these guests [22, 25, 32-36, 40, 41, 92-94]. Higher guest content compared to polymer based CD-IC nanofibrous webs is one of the main advantages of polymer-free systems. Besides, production of polymer-free CD-IC nanofibers eliminates the necessity of using organic solvents to dissolve polymer which is unfavorable for food and pharmaceutical industries.
Contribution of this thesis to “Electrospinning of CD-IC nanofibers” research is the application of these concept to some food additives (Chapter 2) and drugs (Chapter 3) and investigating the changes occurred in these guest molecules.
11
CHAPTER 2
ENCAPSULATION
OF
FOOD
ADDITIVES
BY
CYCLODEXTRIN
FUNCTIONALIZED
ELECTROSPUN
NANOFIBERS
2.1 Menthol/cyclodextrin inclusion complex nanofibers:
Enhanced water solubility and high-temperature stability
of menthol
This part of thesis was reprinted (adapted) by permission from Elsevier [95], (“Menthol/cyclodextrin inclusion complex nanofibers: Enhanced water solubility and high-temperature stability of menthol”, Z. I. Yildiz, A. Celebioglu, M. E. Kilic, E. Durgun, and T. Uyar, Journal of Food Engineering, 224, 27-36, 2018), Copyright (2018) Elsevier.
2.1.1 Introduction
Menthol ((1R,2S,5R)-2-isopropyl-5-methylcyclohexanol) is a flavor/fragrance compound which is naturally occurring, volatile, cyclic terpene alcohol [96]. It is found in plants of Mentha species and gives them the typical minty smell and flavor.
12
It has used in many fields like pharmacy, food, cosmetics, pesticides etc. [96, 97]. Menthol is a highly volatile compound and it has a very low soluble in water, so, these drawbacks sometimes limit the use of menthol in certain applications [98, 99]. Formation of cyclodextrin inclusion complex (CD-IC) with menthol prevents the loss of menthol during storage and processing [100], and this will also provide higher water solubility for menthol [70]. There are recent studies including encapsulation of menthol by CDs to improve properties of menthol. In one of those studies, inclusion complex of menthol with hydroxypropyl-β-cyclodextrin (HPβCD) in powder form was produced [101] and the thermal stability enhancement of menthol was shown. In another recent study, β-CD grafted chitosan was used for entrapment of menthol molecules to analyse release profile of menthol [99].
In this study, highly concentrated aqueous solutions (160%, w/v) of menthol/CD-IC were prepared with two different CDs; hydroxypropyl-β-cyclodextrin (HPβCD) and hydroxypropyl-γ-cyclodextrin (HPγCD), with 1:1 M ratio (menthol:CD). Then, electrospinning of nanofibers (NFs) these two menthol/CD-IC systems (menthol/HPβCD-IC NFs and menthol/HPγCD-IC NFs) was successfully performed in order to obtain self-standing nanofibrous webs (Figure 5). The water-solubility, thermal stability and the release of menthol from menthol/CD-IC NFs was investigated.
13
Figure 5. (a) The chemical structure of HPβCD; the schematic representation of menthol/CD-IC formation, menthol/CD-IC aqueous solutions and (b) electrospinning of nanofibers.
2.1.2 Experimental
2.1.2.1 Materials
The hydroxypropyl-β-cyclodextrin (HPβCD, Cavasol®W7 HP Pharma) and hydroxypropyl-γ-cyclodextrin (HPγCD, Cavasol®W8 HP) were given as free-samples for research purpose by Wacker Chemie AG (Germany). Menthol (>99%, Sigma-Aldrich), deuterated dimethylsulfoxide (DMSO-d6, Merck) potassium bromide (KBr, FTIR grade, Sigma-Aldrich) were purchased. All the materials were
14
used as-received without any further purification process. The deionized water used in this study was obtained from Millipore Milli-Q ultrapure water system.
2.1.2.2 Preparation of electrospinning solutions
CDs can form aggregates via intermolecular hydrogen bonding in their highly concentrated solutions and therefore, electrospinning of nanofibers is possible from such highly concentrated CD solutions without the need of any fiber forming polymeric matrix [91]. In the study of Celebioglu and Uyar [91], bead-free and uniform CD nanofibers were electrospun from the optimized concentration (160% (w/v) of CD with respect to solution) of modified CDs (HPβCD and HPγCD) in water. Therefore, in this study, the same optimized concentration of CD was used to form menthol/CD-IC solutions for the electrospinning. For the preparation of menthol/CD-IC aqueous solutions, firstly, menthol was dispersed in water, then, HPβCD (160%, w/v) and HPγCD (160%, w/v) were separately added to these aqueous menthol dispersion systems. The amount of CD and menthol was adjusted in order to get 1:1 M ratio of menthol/HPβCD-IC and menthol/HPγCD-IC. These suspensions were stirred overnight at room temperature. To minimize the loss of menthol during stirring, the glass vial (5 mL) was sealed tightly. At the end, the aqueous solutions of menthol/HPβCD-IC and menthol/HPγCD-IC were obtained for the electrospinning (Figure 5a). For comparison, pure CD solutions (HPβCD and HPγCD) at a concentration of 160% (w/v) were prepared in water for the electrospinning.
15
2.1.2.3 Electrospinning of nanofibers
Each solution of CD (HPβCD and HPγCD) and menthol/CD-ICs (menthol/HPβCD-IC and menthol/HPγCD-(menthol/HPβCD-IC) was loaded into 1 mL syringe having a metallic needle (inner diameter = 0.4 mm) separately. The syringe was placed horizontally on the syringe pump (KD Scientific, KDS 101). High voltage at 10-15 kV was applied between tip of needle and the collector by the high voltage power supply (Spellman, SL Series). The distance between tip and collector was kept at 10-15 cm. The feed rate of the solutions was varied between 0,5 and 1 mL/h. Electrospun nanofibrous webs were collected on the metal collector which was covered by aluminum foil. Electrospinning was performed at 25 C and 35% relative humidity. Pure CD nanofibers (HPβCD NFs and HPγCD NFs) were electrospun for comparative studies with menthol/CD-IC NFs (menthol/HPβCD-IC NFs and menthol/HPγCD-IC NFs).
2.1.2.4 Measurements and characterizations
Phase solubility diagram was obtained according to the method reported by Higuchi and Connors (1965) [102]. An excess amount of menthol was added to aqueous solutions of HPβCD and HPγCD in capped vials which were shaken at room temperature in the dark for 48 h. After 48 h, solutions were filtered through a 0.45-µm membrane filter to remove undissolved part and the dissolved concentration of menthol was spectrophotometrically (Varian, Cary 100) determined. The experiment was carried out in triplicate and average of three measurements was taken. The apparent stability constant (Ks) of menthol/CD-IC was calculated from
the phase solubility diagram according to the following equation: Ks = slope/ S0 (1-slope)
16 where S0 is the intrinsic solubility of menthol.
Computational method was also used to study the inclusion complexation between menthol and two types of CD (HPβCD and HPγCD). The first-principles analysis depending on density functional theory (DFT) was performed [103-105]. The exchange-correlation functional was expressed by generalized gradient approximation [106] including van der Waals correction [107]. All the elements were described by pseudopotentials generated by projector augmented-wave method [108]. The energy cutoff for plane wave basis set was chosen as 520 eV. The initial structures of host cyclodextrin, guest molecule (menthol) and their inclusion complexes were relaxed by minimizing the total energy and reducing the forces on atoms below 0.01 eV/A. The Brillouin zone was sampled by single k-point at Gamma-k-point and supercell was generated such that there is at least 10 Å between periodic images to avoid spurious interactions. The solvent effect was examined by implementing implicit solvent method which uses continuum dielectric description to describe the solvent [109]. Complexation energy (Ecomp) of
the resulting complexes can be computed by using the following formula: Ecomp =ECD + Ementhol - EIC
where ECD, Ementhol and EIC is the total energy of host CD molecule (HPβCD or
HPγCD), the guest molecule (menthol), and their IC, respectively. The energies were calculated in vacuum and water separately considering 1:1 menthol:CD stoichiometry. The solvation energy (Esolv) of the considered structures and their IC
can be obtained by using calculated energies in vacuum and water by considering the formula below:
17
Esolv = Ewater - Evacuum
Ewater and Evacuum is the total energy of menthol, CD, or menthol/ CD-IC in water
and vacuum, respectively.
A rheometer (Anton Paar, Physica CR 301) equipped with a cone/ plate accessory (spindle type CP 20-4) was used to measure the rheological behavior of menthol/HPβCD-IC and menthol/HPγCD-IC solutions at a constant shear rate of 100 s-1 at 25 °C. The conductivity of the solutions was measured by a Multiparameter InoLab® Multi 720-WTW at room temperature.
The morphological analyses of the electrospun nanofibers were performed by using scanning electron microscope (SEM) (FEI Quanta 200 FEG) [41]. Samples were sputtered with 5 nm Au/Pd prior to SEM imaging by PECS-682 to minimize charging problem. The average fiber diameter (AFD) was determined from the SEM images, and around 100 fibers were analysed for each sample.
The infrared spectra for pure menthol, pure CD NFs, and menthol/CD-IC NFs were obtained by using a Fourier transform infrared spectrometer (FTIR) (Bruker-VERTEX 70). For measurement, the samples were blended with KBr and pressed as pellets. The 64 scans were recorded between 4000 cm-1 and 400 cm-1 at resolution of 4 cm-1 [93]. The X-ray diffraction (XRD) (PANalytical X'Pert powder diffractometer) data of the pure menthol, pure CD NFs and menthol/CD-IC NFs were recorded by using Cu Kα radiation in a range of 2θ = 5°-30° [93]. The molar ratio of menthol to CD in menthol/CD-IC NFs was determined by using proton nuclear magnetic resonance (1H NMR, Bruker D PX-400) system. The menthol/CD-IC NFs were dissolved in d6-DMSO at the 30 g L-1
18
concentration. The spectra were recorded at 400 MHz and at 16 total scan [92]. Thermogravimetric analyses (TGA, TA Q500, USA) were performed for pure menthol, pure CD NFs, and menthol/CD-IC NFs. The TGA were conducted under nitrogen atmosphere by heating the samples from 30 °C to 600 °C at the heating rate of 20 °C/min.
Headspace gas chromatography-mass spectrometry (HS GC-MS, Agilent Technologies 7890A gas chromatograph equipped with 5975C mass spectrometer) was used to determine the amount of menthol released from menthol/HPβCD-IC NF and menthol/HPγCD-IC NF for 150 min. The release experiments were carried out in triplicate and the results were reported as average ± standard deviation. The capillary column was HP-5MS (Hewlett-Packard, Avondale, PA) (30 m Х 0.25 mm i.d., 0.25 m film thickness). A 10 mg of menthol/HPβCD-IC NF and menthol/HPγCD-IC NF was separately placed in 20 mL headspace glass vials which was agitated by 500 rpm at 37 °C and 75 °C [41]. The syringe temperature was kept the same as the incubation temperature. The oven temperature was held at 60 °C for 1 min and increased to 165 °C at the rate of 10 °C/min and equilibrated at this temperature for 1 min. Helium was used as a carrier gas at a flow rate of 1.2 mL/ min. The menthol peak was identified by comparing its mass spectrum with that of menthol in the Search 2.0 and NIST MS libraries.
The fast-dissolving character and water-solubility enhancement were studied visually by the addition of water directly to the pure menthol and menthol/CD-IC NFs samples. The photos were taken in which, menthol powder (approximately the same amount found in menthol/CD-IC NFs) and the menthol/CD-IC NFs samples
19
were placed into petri dishes separately and then, 5 mL of water was added to these petri dishes.
2.1.3 Results and Discussion
2.1.3.1 Phase solubility studies
Phase solubility profiles of menthol/HPβCD-IC and menthol/ HPγCD-IC are given in Figure 6. The diagram of profiles corresponds to the AL type in which the
menthol concentration increased linearly by increasing CD concentration which confirmed the increment in solubility by inclusion complexation. Moreover, this linear trend was the indication of 1:1 M ratio inclusion complex formation tendency between menthol and CD molecules. Stability constant (Ks) values for
menthol/HPβCD-IC and menthol/HPγCD-IC were calculated to represent the binding strength between menthol and CDs. Ks values were calculated as 716 M-1
and 894 M-1 (R2 > 0.99) for menthol/HPβCD-IC and for menthol/HPγCD-IC, respectively, which demonstrated that menthol forms stable complexes with both CD types (HPβCD and HPγCD) with similar stabilities.
20
Figure 6. Phase solubility diagrams of menthol/HPβCD-IC and menthol/HPγCD-IC, (n = 3).
2.1.3.2 Computational modeling
The interaction of menthol and CD was examined at various sites for 1:1 stoichiometry and the lowest energy configurations for two vertical orientations of menthol (tail: the methyl group on the front, head: two methyl groups on the front) are illustrated in Figure 7. Our calculations suggested that menthol prefers head and tail orientation for HPβCD and HPγCD, respectively. In both cases, polar hydroxyl group of menthol remained inside the cavity and menthol was shifted towards the sides to enhance the interaction. Cavity of HPβCD and HPγCD is large enough to accommodate menthol in lateral orientation; however, the structure was deformed for HPβCD whereas lateral orientation was possible for HPγCD without deformation. The calculations were repeated in water for the most favourable
0 5 10 15 20 25 30 35 40 45 50 0 5 10 15 20 25 30 35 40 45 50 55 60 65
M
e
n
th
o
l C
o
n
ce
n
tr
at
io
n
[
mM
]
CD Concentration [mM]
Menthol/HPγCD-IC Menthol/HPβCD-IC21
geometries and similar structural pattern was obtained, only the complexation energies (Ecomp) changed. The results are summarized in Table 2.
Positive and high Ecomp for all cases indicates stable IC formation between menthol
and both CD types which was also confirmed by our phase solubility studies. For menthol/HPβCD-IC, the highest Ecomp was obtained with head orientation in
parallel with size matching while for menthol/HPγCD-IC, the highest Ecomp was obtained with tail orientation (Table 2). On the other hand, for both of the CDs, Ecomp decreased in water. Being menthol a polar molecule,
the decrease in Ecomp can be attributed to polar-polar interaction of
guest molecule and the solvent. As discussed above, menthol can also laterally fit into cavity of CD and Ecomp was calculated as 21.25 and 23.19 kcal/mol in vacuum
for HPβCD and HPγCD, respectively. This indicated that interaction of menthol was stronger in lateral orientation for HPγCD when compared to HPβCD. The energy for HPβCD-IC in lateral orientation was comparable with the energy in vertical orientation, suggesting the possibility of complexation in lateral orientation, as well.
The results for Esolv of menthol, CDs and their IC are given in
Table 2. Esolv of menthol was calculated as 2.89 kcal/mol indicating a low solubility
in water which is in agreement with the literature [99]. However, Esolv values were
high for both inclusion complexes, suggesting a substantial increase in solubility upon complexation and the higher Esolv was obtained for
menthol/HPγCD-IC (79.23 kcal/mol) when compared to menthol/HPβCD-IC (68.93 kcal/mol).
22
Figure 7. The optimized, lowest energy configurations of side views of ICs of (a) HPβCD and (b) HPγCD; and top view of ICs of (c) HPβCD and (d) HPγCD with menthol. The tail and head vertical orientation of menthol is shown by arrows. (Blue, pink, and light brown balls represent carbon, oxygen, and hydrogen atoms, respectively).
23
Table 2. Complexation and solvation energies of the menthol, CDs (HPβCD and HPγCD) and menthol within CDs at different orientations.
Host Guest Orientation
Ecomp (vacuum) kcal/mol Ecomp (water) kcal/mol Esolv kcal/mol HPβCD - - - - -71.17 HPβCD Menhtol Head 26.62 21.50 -68.93 HPβCD Menhtol Tail 23.24 - - HPβCD Menhtol Lateral 21.25 - - HPγCD - - - - -83.34 HPγCD Menthol Head 19.23 - - HPγCD Menthol Tail 23.71 16.72 -79.23 HPγCD Menthol Lateral 23.20 - - - Menthol - - - -2.89
2.1.3.3 Morphological analyses
The parameters of electrospinning process were optimized for the formation of the bead-free and uniform nanofibers. Highly concentrated (160% CD, w/v) menthol/HPβCD-IC and menthol/HPγCD-IC solutions were used for the electrospinning of nanofibers. The pictures of obtained electrospun nanofibrous webs are shown in Figure 8a-b with their representative SEM images (Figure 8c-d). The average fiber diameter (AFD) was 590 ± 230 nm for menthol/HPβCD-IC NFs and 1005 ± 285 nm for menthol/HPγCD-IC NFs (Table 3). The viscosity of menthol/HPγCD-IC solution was higher than menthol/HPβCD-IC solution and the solution conductivity of menthol/HPγCD-IC was lower than menthol/HPβCD-IC. Hence, the higher AFD of menthol/HPγCD-IC NF was due to its higher solution
24
viscosity and lower solution conductivity (Table 3) since it is well-known that higher solution viscosity and lower solution conductivity results in less stretching of the electrified jet that forms thicker fibers during electrospinning process [6, 12].
Figure 8. The photographs of (a) menthol/HPβCD-IC NFs and (b) menthol/HPγCD-IC NFs; SEM images of (c) menthol/HPβCD-menthol/HPγCD-IC NFs and (d) menthol/HPγCD-menthol/HPγCD-IC NFs; the fiber diameter distribution with average fiber diameter (AFD) of (e) menthol/HPβCD-IC NFs and (f) menthol/HPγCD-IC NFs.
25
Table 3. The properties of the solutions used for electrospinning and morphological characteristics of the resulting menthol/CD-IC NFs.
Solutions Average fiber diameter (nm) Fiber diameter range (nm) Viscosity (Pa∙s) Conductivity (μS/cm) Morphology
Menthol/HPβCD-IC (1:1) 590±230 210-1375 0.200±0.017 14.63±1.42 nanofibers Bead free
Menthol/HPγCD-IC (1:1) 1005±285 470-1905 0.300±0.015 5.42±0.10 Bead free nanofibers
26
2.1.3.4 Structural characterizations
The detailed characterizations of menthol/CD-IC NFs were done by using FTIR and XRD. These characterizations were also performed for pure menthol and pure CD NFs for comparison. The FTIR spectra of pure menthol, pure CD nanofibers, and menthol/CD-IC NFs are shown in Figure 9. The characteristic absorption bands of modified CDs are observed at around 3400 cm-1 (O-H stretching vibrations), 2932 cm-1 (C-H stretching vibrations), 1649 cm-1 (HO-H bending
vibrations) [110], 1155 cm-1 (asymmetric stretching vibration of C-O-C glycosidic bridge) 1032 and 1083 cm-1 (C-C, C-O stretching vibrations) [111].
The pure menthol spectrum showed the signature peaks at 3315 cm-1 (O-H stretching vibrations), 2850-2957 cm-1 (C-H stretching vibrations), 1025-1045 cm1 (C-O stretching vibrations) [99] and 1367 cm-1 corresponding to isopropyl group
[112]. The overlapping of absorption peaks for menthol and CD molecules made the identification of each compounds complicated for menthol/CD-IC NFs samples. Yet, the sharpest absorption peak of menthol at about 1367 cm-1 was present at the FTIR spectra of menthol/CD-IC NFs samples whereas this peak was absent for the pure CD NFs samples (Figure 9). This suggested the presence of menthol in menthol/HPβCD-IC NF and menthol/HPγCD-IC NF samples.
27
Figure 9. FTIR spectra of pure menthol, pure CD NFs and menthol/CD-IC NFs. The crystalline structures of menthol, pure CD NFs and menthol/ CD-IC NFs were investigated by XRD. The XRD patterns of menthol/CD-IC NFs webs were very similar to those of pure CD NFs webs having amorphous structure (Figure 10). Besides, they did not show any diffraction peaks of menthol suggesting that menthol molecules were possibly isolated from each other by entering into CD cavities and cannot form any crystalline aggregates [83, 90, 91, 93, 111]. In other words, XRD results suggested the IC formation between CD and menthol molecules in menthol/HPβCD-IC NFs and menthol/HPγCD-IC NFs samples.
4000 3500 3000 2500 2000 1500 1000 500 A b so rb an ce (a. u .) Wavelength(cm-1) Menthol HPβCD NF HPγCD NF Menthol/HPβCD-IC NF Menthol/HPγCD-IC NF
28
Figure 10. XRD patterns of pure menthol, pure CD NFs and menthol/CD-IC NFs.
2.1.3.5 The molar ratio of menthol in menthol/CD-IC NFs
1H NMR study was performed to validate the presence of menthol and to determine
the molar ratio between menthol and CD in menthol/CD-IC NFs by dissolving the samples in d6-DMSO. Initially, a 1H NMR study was performed to detect the
characteristic peaks corresponding to protons of CD NFs and pure menthol. The characteristic peaks of menthol were observed in the 1H NMR spectra of
IC NFs which confirmed the presence of menthol in the menthol/CD-IC NFs samples. The molar ratios were calculated by taking integration of menthol peak at around 1.85 ppm (H-e) and the CD peak at around 5.8 ppm (H-1) (Figure 11). It was calculated that the molar ratio of menthol to HPβCD and HPγCD was ~0.75:1.00 and ~0.70:1.00 in menthol/HPβCD-IC NFs and menthol/HPγCD-IC
10 20 30 In ten si ty (a. u .) 2 theta Menthol HPβCD NF HPγCD NF Menthol/HPβCD-IC NF Menthol/HPγCD-IC NF
29
NFs samples, respectively. The molar ratio found for menthol/CD-IC NFs samples was lower than the initial ratio (1.00:1.00) and this is probably because of some uncomplexed menthol in menthol/CD-IC systems; however, menthol was mostly preserved during electrospinning process and/or during storage. 1H NMR results
revealed that menthol/HPβCD-IC NFs shows a slightly higher molar ratio which means higher complexation efficiency than menthol/HPγCD-IC NFs. Encapsulation efficiency (EE%) of menthol for menthol/CD-IC NFs was also calculated from the results of 1H NMR. EE% was found as ~75% for menthol/HPβCD-IC and ~70% for menthol/HPγCD-IC NFs.
30
Figure 11. 1H NMR spectra of (a) menthol/HPβCD-IC NFs and (b) menthol/HPγCD-IC NFs dissolved in d6-DMSO.
2.1.3.6 Thermal characterization
The thermal properties and thermal stability of menthol in menthol/CD-IC NFs were investigated by TGA. The TGA studies of pure CD NFs and pure menthol were also performed for comparison. The TGA thermograms of pure CD NFs have
6.4 6.0 5.6 5.2 4.8 4.4 4.0 3.6 3.2 2.8 2.4 2.0 1.6 1.2 0.8 0.4 0.0 H1 e 6.4 6.0 5.6 5.2 4.8 4.4 4.0 3.6 3.2 2.8 2.4 2.0 1.6 1.2 0.8 0.4 0.0 H1 e R : CH2CHCH3OH 1 2 3 4 5 6 a b c d e f g i h j