4
Agriculture and trade
liberalization in the MENA
region
Dynamic impacts of future
.
*
scenanos
Ali H Bayar, Ghazi Ben-Ahmed, Paul de Boer,
Xinshen Diao, and A. Erinc Yeldan
1 Introduction
What would be the potential economic impact of a new World Trade Organization (WTO) trade round on the agricultural trade of the countries of the Middle East and North Africa (MENA) region? The answer to this question has to take into account not only the various liberalization scenarios one can meaningfully envis-age as a result of the current WTO negotiations, but also the ongoing reform efforts of the European Common Agricultural Policy (CAP), the enlargement of the European Union (EU) and the future of the Euro-Mediterranean Agreements (EMAs). A great number of divergent combinations of policies/scenarios can be envisaged and the implications of these diverse combinations are very different for the agricultural trade of the MENA countries.
For the MENA countries, agricultural production and trade is greatly affected by a variety of domestic policy interventions and other external trade and agri-cultural policies adopted by the region's main trading partner, the EU. The com-mitments that have resulted from the Uruguay Round, as well as the prospect of EU enlargement, will require further policy adjustments in the CAP in the years to come. The EU has pursued a policy of reform since 1992, based on two ele-ments: lowering the guaranteed prices for key products and offsetting the impact of these cuts on producer incomes by means of direct payments. An even more radical reform was undertaken in 1999 - the Agenda 2000 package - to prepare the EU for enlargement and in order to take an active role in the WTO negotia-tions on agriculture. In fact, the Doha meeting in November 2001 set a very challenging timetable. The WTO members will have to reach agreement on new rules in order to formulate fresh commitments by 31 March 2003, so they can then submit their offers at the 2003 WTO Ministerial Meeting in Mexico.
The value of preferences granted to the Mediterranean Countries (MCs: Algeria, Cyprus, Egypt, Israel, Jordan, Lebanon, Malta, Morocco, the Palestinian Authority, Syria, Tunisia, and Turkey) depends on the level of EU import barriers to Most Favoured Nation (MFN) suppliers as well as to the extent to which
Agriculture and trade liberalization in the MENA region 85 agriculture is liberalized in the existing Free Trade Agreements (FTAs) with Mexico and South Africa, and forthcoming ones between the EU and its partners. In the short run, therefore, negotiations on the extension of preferences remain an important issue for the MENA region, and in particular for the MCs, but also for the Gulf Cooperation Council ( GCC) countries, which will start negotiating an FTA with the EU in 2003. However, any benefits could be of a transitory nature, as these countries would be more exposed to competition by MFN suppliers than they are at present.
2 Current agricultural trade in the MENA region
MENA countries are highly diverse in terms of their economic and geographical size, natural resource endowments, and standards of living. This region is char-acterized by: (i) the limited extent to which member countries have been able to eliminate or streamline administrative procedures related to trade; (ii) the fact that many countries in the region have yet to accede to the WTO (Algeria, Lebanon, Oman, Saudi Arabia, and Yemen are in the process of acceding or have shown an interest in doing so); and (iii) the weakness of intra-regional trade and the high level of tariff and non-tariff barriers, the weak complementarities among these economies and of course political tension and conflict within the region. All these factors explain the limited nature of intra-MENA trade, which remains low by all accounts. In 1998, for instance, intra-Arab exports represented only 8.2 per cent of the region's total exports.
Notwithstanding the limited significance of total intra-regional trade, De Rosa (1997) finds that intra-MENA trade accounts for 30 per cent of total exports of agricultural products. Exceptionally high percentages are reported for some prominent categories of agricultural products: barley (96 per cent); rice (88 per cent); livestock, meats and dairy products (87 per cent); and cereals (47 per cent). Intra-regional trade accounts for only l O per cent of total agricultural imports, but, remarkably, 50 per cent for fruits and vegetables.
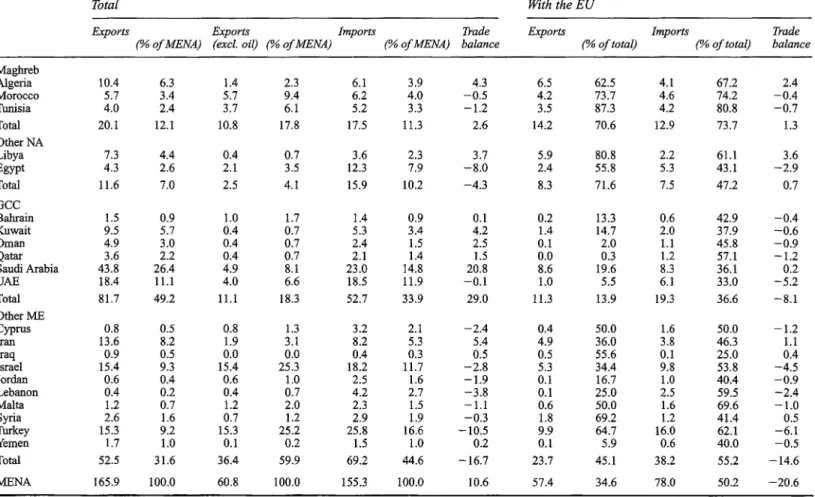
Table 4.1 provides average figures for total exports, exports excluding oil, total imports and the total trade balance, as well as the averages of the exchange of goods and the trade balances with the EU of the MENA countries over the period 1995-7 (excluding the Palestinian Authority for which we do not have data over the period covered). It also provides sub-regional totals for the Maghreb, other North African countries, the GCC and other countries in the Middle East.
It can be seen that total annual exports of the MENA region amount to 165.9 billion euros (€) on average over 1995-7. Saudi Arabia (€43.8 billion) and the United Arab Emirates ( € 18.4 billion) together account for more than one-third of this total. Total imports are €155.3 billion, one-third of which is accounted for by two countries: Turkey (€25.8 billion) and Saudi Arabia (€23.0 billion). The total trade balance shows an average surplus of€I0.6 billion: but with oil excluded, total exports of the MENA region drop by as much as €105.l billion to 60.8 billion! From Table 4.1 we can see that Israel and Turkey both account for a quarter of total exports excluding oil.
Table 4.1 MENA countries' volume and pattern of imports and exports (average figures for 1995-7 in billions of euros)
Total With the EU
Exports Exports Imports Trade Exports Imports Trade ("/oo/MENA) (excl. oil) (% of MENA) (%a/MENA) balance ("/o of total) (% of total) balance
Maghreb Algeria 10.4 6.3 1.4 2.3 6.1 3.9 4.3 6.5 62.5 4.1 67.2 2.4 Morocco 5.7 3.4 5.7 9.4 6.2 4.0 -0.5 4.2 73.7 4.6 74.2 -0.4 Twrisia 4.0 2.4 3.7 6.1 5.2 3.3 -1.2 3.5 87.3 4.2 80.8 -0.7 Total 20.1 12.1 10.8 17.8 17.5 11.3 2.6 14.2 70.6 12.9 73.7 1.3 Other NA Libya 7.3 4.4 0.4 0.7 3.6 2.3 3.7 5.9 80.8 2.2 61.l 3.6 Egypt 4.3 2.6 2.1 3.5 12.3 7.9 -8.0 2.4 55.8 5.3 43.l -2.9 Total 11.6 7.0 2.5 4.1 15.9 10.2 -4.3 8.3 71.6 7.5 47.2 0.7 GCC Bahrain 1.5 0.9 1.0 1.7 1.4 0.9 0.1 0.2 13.3 0.6 42.9 -0.4 Kuwait 9.5 5.7 0.4 0.7 5.3 3.4 4.2 1.4 14.7 2.0 37.9 -0.6 Oman 4.9 3.0 0.4 0.7 2.4 1.5 2.5 0.1 2.0 1.1 45.8 -0.9 Qatar 3.6 2.2 0.4 0.7 2.1 1.4 1.5 0.0 0.3 1.2 57.l -1.2 Saudi Arabia 43.8 26.4 4.9 8.1 23.0 14.8 20.8 8.6 19.6 8.3 36.1 0.2 UAE 18.4 11.1 4.0 6.6 18.5 11.9 -0.1 1.0 5.5 6.1 33.0 -5.2 Total 81.7 49.2 11.1 18.3 52.7 33.9 29.0 11.3 13.9 19.3 36.6 -8.1 Other ME Cyprus 0.8 0.5 0.8 1.3 3.2 2.1 -2.4 0.4 50.0 1.6 50.0 -1.2 Iran 13.6 8.2 1.9 3.1 8.2 5.3 5.4 4.9 36.0 3.8 46.3 1.1 Iraq 0.9 0.5 0.0 0.0 0.4 0.3 0.5 0.5 55.6 0.1 25.0 0.4 Israel 15.4 9.3 15.4 25.3 18.2 11.7 -2.8 5.3 34.4 9.8 53.8 -4.5 Jordan 0.6 0.4 0.6 1.0 2.5 1.6 -1.9 0.1 16.7 1.0 40.4 -0.9 Lebanon 0.4 0.2 0.4 0.7 4.2 2.7 -3.8 0.1 25.0 2.5 59.5 -2.4 Malta 1.2 0.7 1.2 2.0 2.3 1.5 -1.l 0.6 50.0 1.6 69.6 -1.0 Syria 2.6 1.6 0.7 1.2 2.9 1.9 -0.3 1.8 69.2 1.2 41.4 0.5 Turkey 15.3 9.2 15.3 25.2 25.8 16.6 -10.5 9.9 64.7 16.0 62.1 -6.l Yemen 1.7 1.0 0.1 0.2 1.5 1.0 0.2 0.1 5.9 0.6 40.0 -0.5 Total 52.5 31.6 36.4 59.9 69.2 44.6 -16.7 23.7 45.1 38.2 55.2 -14.6 MENA 165.9 100.0 60.8 100.0 155.3 100.0 10.6 57.4 34.6 78.0 50.2 -20.6
Agriculture and trade liberalization in the MENA region 87 Table 4.1 also presents data on MENA trade with the EU. For each country and for each group, it gives share of exports to and imports from the EU. The trade balance with the EU shows an average total deficit of€20.6 billion.
Viewed from the MENA perspective, trade with the EU is quite important: the share of the EU in MENA's total exports is on average 34.6 per cent. Moreover, slightly more than half of MENA's imports originate from the EU. For the Maghreb, these percentages are considerably higher: about 71 per cent of exports and 74 per cent of imports.
MENA's exports are highly concentrated in mineral fuels. Oil accounts, on average, for 63 .4 per cent of total exports; for the GCC countries this share is even higher at 86.4 per cent. Other important oil exporters are: Algeria, Egypt, Iran, Iraq, Libya, and Syria.
Notwithstanding the prominence of oil in the region, agriculture remains important to most economies in MENA: the agricultural and rural population still amounts to 40-60 per cent of the total population and the agricultural sector accounts for a substantial share of total employment. Agricultural products also account for a large share of the exports of several MENA countries. The EU is a net exporter of agricultural products to the MCs with an average surplus of around €300 million for the period 1994-8. However, for the three countries that were scheduled for agricultural re-negotiations in 2000, the EU is a net importer (with an average of €830 million over that period): agricultural trade with Morocco and Israel shows a clear deficit, while trade with Tunisia is close to balance.
2.1 Agricultural exports to the EU
The MCs contributed an average of7.3 percent to the total agricultural imports of the EU between 1994 and 1998. These originated mainly from six countries: Turkey, Morocco, and Israel were the three most important suppliers, followed by Tunisia, Egypt, and Cyprus. While Syria was a considerable cotton exporter, its other exports were low. Exports from Algeria, Lebanon, Jordan, Malta, and the Palestinian Authority to the EU were rather small: less than €30 million for the whole period. The Mediterranean countries are important suppliers to the EU, though far behind Latin America and the North American Free Trade Agreement (NAFTA), countries but ahead of Australia and New Zealand. The virtual absence of exports to the United States and Japan shows the concentration of MCs' exports to the EU. Grethe and Tangermann (1998) report that in 1995, nearly 70 per cent of farm exports from the MCs (Israel, Libya, Malta, Cyprus, and Turkey excluded) are oriented towards the EU. This concentration is the highest for Tunisia (83 per cent), Morocco (47 per cent), and Egypt (64 per cent).
Agricultural exports represent an essential proportion of total exports to the EU from the Palestinian Authority (more than 50 per cent), Morocco and Cyprus (22 per cent), and Turkey and Lebanon (around 15 per cent). For Israel and Tunisia, too, the share of farm exports is significant (12.5 and 9.4 per cent, respectively), while it is negligible for others.
88 Bayar et al.
Mediterranean exports are concentrated in a relatively restricted number of products: hazelnuts, citrus fruits (fresh or prepared) and olive oil. Together with grapes, potatoes, molluscs, dates, and flowers, these account for 50 per cent of all farm exports to the EU. This poor diversification of exports is representative of each single country.
An analysis of exports originating from each MC to the EU thus shows weak diversification, indicating a clear pattern of specialization. For example, two-thirds of Morocco's exports are made up of citrus fruits, tomatoes, and olives, as well as fishing products (tinned sardines and anchovies, squids and octopuses). Israel's main export goods are flowers, citrus fruits ( oranges, grapefruits), fruit juices, and dates, which total 50 per cent of her exports to Europe. Except for Turkey, whose exports are relatively diversified, other countries are highly specialized.
Weak diversification is not a problem
per se,
as a tendency towards specializa-tion in foreign trade is natural. However, heavy dependence on the European mar-kets may be risky: once CAP is revised or once liberalization progresses, exports that have benefited thus far from high and stable prices in the European markets will face serious competition. Moroccan citrus fruits of superior quality, for example, are exported to the EU precisely because of high market prices.2.2 Agricultural imports from the EU
MENA's agricultural imports are determined to a large extent by per capita income levels and population size. For instance, large volumes of livestock, meat and dairy products are imported by Saudi Arabia, Israel, and the United Arab Emirates and by populous countries such as Iran and Egypt.
The MCs represent an important market for European agricultural exports: on average I0.6 per cent of European exports are sold to the Mediterranean region (1994-8). Of the main EU exports, the MCs absorb 38 per cent of sugar, wheat, and flour, and 78 per cent of beef. Algeria and Egypt are among the EU's main clients, representing, respectively, the 14th and 15th largest export outlets in 1997 (European Commission 1998). Hence, the opening of these countries' markets to agricultural products is not without significance for Europe. The EU has a certain interest in achieving preferential access to these markets in order to partly compensate for the negative impact of the pending reforms aimed at reducing support measures to its agricultural sector (Uruguay Round and the restructuring of the CAP).
As with exports, imports of the MCs are concentrated in some products: more than 50 per cent of imports comprise nine product groups. Imports of sugar, wheat, milk, and flour make up one-third of total imports. It is noteworthy that certain sugar and flour imports compete with local produce in some countries (Egypt and Morocco). The structure of imports at a regional level comprises two product groups: on the one hand, produce and sub-produce of cereal origin (wheat, flour, and barley); on the other hand, produce and derived produce from bovine farming (milk, meat, livestock, and cheese). This concentration hints at a relatively similar structure of imports for the different countries of the region.
Agriculture and trade liberalization in the MENA region 89 Unsurprisingly, the most populated countries of the region are also the largest importers (Algeria, Egypt, and Turkey). Being a rich country, Israel also counts amongst the large importers. Algeria distinguishes itself from the rest of the MCs because of its very weak agricultural sector: as with Egypt, it has a significant trade deficit.
Examining each country in detail, it can be seen that their major imports are quite similar. Wheat (Morocco, Tunisia, Algeria, and Egypt, one of the world's biggest importers); sugar (Israel, Turkey, Algeria, and Tunisia); beef (Egypt, Turkey, and Morocco); and, to a lesser extent, milk (Algeria and Morocco), and wheat flour (Algeria and Libya) are the most important. This situation reflects a common characteristic of all these countries, namely their incapacity to satisfy domestic demand, due to a lack of arable lands, water resources, and modem production techniques.
3 Policy analysis
Our analytical model can be used to study alternatives for preferential trade agreement blocs among the countries of the MENA region, given their existing trade patterns with the EU. As a first step we study the customs union (CU) path followed by Turkey and the EU since 1995. As Turkey has already signed a CU with the EU, we trace the new policy environment beginning from Turkish-EU trade integration. The CU agreement between Turkey and the EU, which is currently in effect, covers mainly industrial commodity trade, with agriculture and services subject to a period of grace. In our next step, we extrapolate the ini-tial CU agreement to full trade liberalization between the two partners covering all sectors. Following that, we broaden our analysis to include issues of bilateral and coordinated trade liberalization between the MENA countries and the EU.
3.1 Overview of the analytical model
The model is based on dynamic macroeconomic theory with a multi-region and multi-sector specification, and in many ways draws upon the recent contributions of dynamic applied general equilibrium modelling by McKibbin (1993), Mercenier and Sampafo de Souza (1994), Mercenier and Yeldan (1997), Diao et al. (1999), and Diao and Somwaru (2000). The world economy is disaggre-gated into nine regions. In each region, there are nine production sectors, each of which produces a single commodity. All the regions are fully endogenous in terms of the economic behaviour of their producers and consumers. Furthermore, in a multi-region and multi-sector global model, commodity trade flows are tracked by their geographical and sectoral origin and destination. Countries are further linked by an Armington system so that sectoral commodities are differentiated in demand and supply by their geographical origin.
Firms in each region produce goods and conduct capital investment so as to maximize the firm's valuation. Households with infinite life spans consume domestically produced and imported goods to maximize an inter-temporal utility
90 Bayar et al.
function. Household income is consumed or saved in the form of equity in domestic firms or foreign bonds. Domestic firm equities and foreign bonds are assumed to be perfect substitutes. Through equity purchases by households, the world 'pool' of savings is channelled to profitable investment projects without regard to the national origin of savings. Technological change and population growth are exogenous and, because we could normalize all variables in per capita terms, they are assumed to be zero in the model. A full and detailed description of the model is given in Bayar et al. (2000) and is not reproduced here.
3.2 Simulation experiments
We organize our modelling analysis under two sets of issues. First, we look into country experiences in response to bilateral trade integration with the EU, given that Turkey has already signed a customs union with the EU. In this stage, we hypothesize trade liberalization in manufacturing commodity trade between the respective regions of MENA and the EU. Secondly, we envisage a policy envi-ronment where manufacturing trade is liberalized under a coordinated setting within the MENA. Here, we implement a free trade area within the MENA bloc, complemented by elimination of tariffs and tariff-like barriers vis-a-vis the EU manufacturing trade. We call the first policy environment the 'No-Coordination' scenario, and the second one the 'Coordinated FTA' scenario.
Given that most of the countries in the region have similar endowments and trade patterns with the EU, emphasis of a policy distinction between coordinated versus uncoordinated trade liberalization attempts will prove to be crucial. In our modelling analysis, we report both the static and dynamic effects of trade policy. Dynamic effects will be driven by consumers' optimization and inter-temporal consumption smoothing over a long-term horizon. In this setting, saving deci-sions of consumers will depend on inter-temporal macroeconomic prices such as the rate of interest and the (real) exchange rate. The saving-investment gap will be covered by the current account deficit in equilibrium, which in tum will induce optimal foreign borrowing plans for the indigenous region.
Theory suggests that the dynamic effects of both bilateral and coordinated trade liberalization attempts are subject to many factors. General equilibrium processes on the national and global level may yield conflicting forces, and the realized outcomes often depend on a host of technological factors, which are hard to account for within the context of an analytical model. In the standard Solow-Ramsey framework, transitional adjustments to long-run equilibrium are achieved solely by capital accumulation, which itself is subject to diminishing returns. Trade liberalization entails, on the other hand, adjustments that go beyond standard processes of capital accumulation. There is now increasing evidence that open economies capture significant gains in total factor productivity (TFP), espe-cially through intermediation of foreign R&D stocks by way of capital goods imports. Empirical studies in the growth literature as outlined in the seminal works of Levine and Renelt (1992) and Frankel and Romer (1999) underscore the TFP gains due to trade liberalization. Coe et al. (1997), on the other hand, provide
Agriculture and trade liberalization in the MENA region 91 estimates of foreign R&D elasticities obtained by way of intermediate imports. Early applications of trade-driven TFP gains were modelled in De Melo and Robinson (1992) and Yeldan et al. (1998). Diao et al. (1999), on the other hand, modelled the (endogenous) growth processes of R&D-driven technological change within the context of open trade regimes.
In the current study, we utilize the framework initially laid by the above mod-elling exercises and regard TFP generation as an endogenous function of the increase in imports in the aftermath of trade liberalization. Formally, we model such TFP gains as a positive shock on output and investment demand, which is sustained for eight periods following the trade policy implementation.
Thus, this specification leaves us with the following matrix of possible inter-actions of the policy environment with technological adjustments:
Policy environment
No coordination
Coordinated FTA within MENA
Technological adjustments Investment effects of K-accumulation N-C w/ Inv effects FTA w/ Inv effects
Investment plus TFPeffects N-C w/ INV+ TFP FTA w/ INV+ TFP
We implement our trade liberalization experiments in two steps: first, we induce the MENA countries to eliminate the existing tariffs on imports from the EU in their manufacturing sectors. This policy move can be envisaged as a com-pletely bilateral arrangement with the EU and the respective country or region. Yet, it can also be envisaged to be part of a wider policy where MENA countries take the additional step of liberalizing their trade regimes vis-a-vis each other by forming a free-trade area among themselves (the coordinated FTA scenario).
After this step, we extend our analysis to take account of trade liberalization in agricultural and services trade. We implement these new trade regimes both under the uncoordinated and coordinated FTA policy environments, and also with the distinction of investment versus investment-plus-TFP dynamic adjustments, as summarized in the policy and technology matrix above.
With the aid of these sets of policy simulations, we try to capture the individ-ual regional macroeconomic responses and welfare changes of each individindivid-ual region in response to bilateral trade liberalization with the EU. Our starting point is the macro general equilibrium of the global commodity and finance markets as of 1995. Our data come from a direct aggregation of the database of the Global Trade Analysis Project (GTAP), version 5. We implement our policy simulation experiments via parametric changes of the relevant policy parameters and trace the out-of-steady-state transitional dynamic adjustments towards a new steady state equilibrium. Thus, we rely on the laboratory characteristics of our analytical apparatus and implement these strategic policy options as discrete simulation experiments sequentially. Since our focus is mostly on the short to medium run, we choose to limit our analysis exclusively on the first 20 periods of the dynamic
92 Bayar et al.
adjustment; yet, in principle, one can extend this time horizon and portray the whole time path of the intertemporal equilibrium towards the steady state.
We first disturb the initial equilibrium configuration by implementing, ceteris paribus, tariff reductions for manufacturing imports from the EU. The social
wel-fare effects are tabulated in Tables 4.2 and 4.3. The social welwel-fare metric is the equivalent variation of income that the representative consumer is willing to forego against the implementation of the trade policy. We differentiate both the static (upon impact) welfare effects and the dynamic path.
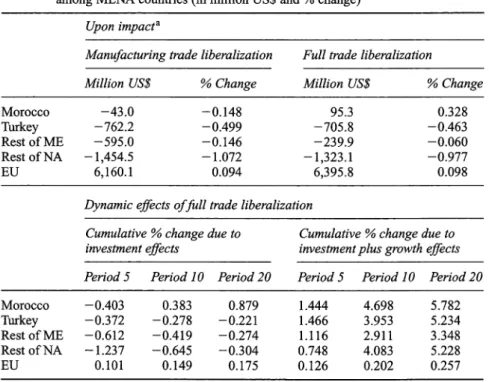
The interesting result is that manufacturing trade liberalization entails static welfare losses for the MENA region. Under no coordination within the MENA, bilateral trade liberalization brings a welfare loss of $43 million for Morocco, $762 million for Turkey, $595 million for the 'Rest of the ME region', and $1,454 million for the 'Rest ofNorthAfrica region'. The EU is expected to capture a wel-fare gain totalling $6, 160 million. Even though under the coordinated FTA attempts within the MENA bloc the welfare losses are somewhat smaller, they are still negative. Here, Morocco is observed to achieve almost a balance with a minor static welfare loss of 10 million. Turkey's loss is cut by one third, whereas the remaining two regions of the MENA bloc experience comparable outcomes as
Table 4.2 Changes in social welfare under bilateral trade liberalization with no-coordination
among MENA countries (in million US$ and % change)
Morocco Turkey Rest of ME Rest of NA EU Morocco Turkey Rest of ME RestofNA EU Note Upon impacta
Manufacturing trade liberalization Million US$ % Change
-43.0 -0.148 -762.2 -0.499
-595.0 -0.146
-1,454.5 -1.072 6,160.1 0.094
Full trade liberalization Million US$ 95.3 -705.8 -239.9 -1,323.1 6,395.8 % Change 0.328 -0.463 -0.060 -0.977 0.098
Dynamic effects of fall trade liberalization
Cumulative % change due to Cumulative % change due to investment effects investment plus growth effects Period 5 Period JO Period 20 Period 5 Period JO Period 20
-0.403 0.383 0.879 1.444 4.698 5.782 -0.372 -0.278 -0.221 1.466 3.953 5.234 -0.612 -0.419 -0.274 1.116 2.911 3.348 -1.237 -0.645 -0.304 0.748 4.083 5.228 0.101 0.149 0.175 0.126 0.202 0.257
a Without investment or growth effects: static welfare changes due only to reallocation of existing resources.
Agriculture and trade liberalization in the MENA region 93 Table 4.3 Changes in social welfare under bilateral trade liberalization with coordinated
FTA among MENA countries (in million US$ and% change)
Morocco Turkey Rest of ME RestofNA EU Morocco Turkey Rest of ME Rest of NA EU Note Upon
impact"-Manufacturing trade liberalization Million US$ % Change
-10.1 -0.035 -212.2 -0.139 -518.1 -0.127 -1398.1 -1.031 5,700.1 0.087
Full trade liberalization Million US$ 136.4 -82.8 -130.6 -1257.7 5,886.4 % Change 0.470 -0.054 -0.032 -0.927 0.090
Dynamic effects of full trade liberalization
Cumulative % change due to Cumulative % change due to investment effects investment plus growth effects Period 5 Period JO Period 20 Period 5 Period JO Period 20
-0.346 0.502 1.036 1.451 4.792 5.934 -0.273 0.012 0.163 3.389 8.402 10.947 -0.588 -0.383 -0.228 1.195 3.041 3.502 -1.250 -0.591 -0.211 0.450 3.486 4.581
0.094 0.142 0.168 0.125 0.203 0.264
a Without investment or growth effects: static welfare changes due only to reallocation of existing resources.
before. Thus, a coordinated FTA arrangement within the MENA seems to cush-ion the adjustment costs for Turkey and Morocco.
The downward adjustments of social welfare are the direct results of short-term (static) terms of trade effects. The initial impact of elimination of manufacturing import tariffs is a reduction in import costs and an overall deflation of the domes-tic price level in the MENA bloc. Thus, vis-a-vis the EU the real exchange rate, defined as the ratio of the domestic versus the EU consumer baskets, depreciates in all of the countries experiencing the tariff reduction (for an analytical exposi-tion of this point, see Obstfeld and Rogoff 1996: chapter 4). Along with domes-tic prices, export prices are relatively adversely affected in comparison with their import counterparts. The adverse terms of trade are of the order of0.2 per cent in Morocco; 0.8 per cent in Turkey; 0.5 per cent in the 'Rest of ME'; and 0.05 per cent in 'Rest of North Africa'. Under the coordinated FTAs, the adverse move-ments of the regional terms of trade effects are smaller; hence, the welfare losses are adjusted downwards.
When we expand our policy experiment to further trade liberalization in non-industrial sectors, Morocco experiences a welfare gain of $95 million under bilat-eral trade libbilat-eralization, and $136 million under the coordinated FTA scenario. Turkey experiences a worsening under no coordination, but coordinated FTA
94 Bayar et al.
seems to minimize Turkish welfare losses. Full trade liberalization under a coordinated FTA is associated with a relatively smaller welfare loss in the other two regions of the MENA, but nevertheless static effects of tariff reduction are obviously unfavourable for the region as a whole.
These results change significantly when we account for dynamic effects. Under the coordinated FTA regime, Morocco and Turkey experience a gain in social welfare starting from period 10. These standard capital accumulation effects are complemented by TFP gains, and under this technological adjustment, trade liberalization is observed to bring sizable gains to all countries in the region. The cumulative social welfare gain expected under trade liberalization by the end of period 20 is about $2 billion in Morocco; $19 billion in Turkey; $15 billion in the Rest of ME; and $7 billion in North Africa. Comparable welfare gains for the EU reach $18 billion.
Simulation results show that with no coordination envisaged, real GDP is expected to rise at the end of 20 periods in Morocco by 2.5 per cent; 0.1 per cent in Turkey; 1.2 per cent in the Rest of ME; and 1 per cent in the North African region, if only investment effects are considered. Consideration of TFP effects boosts such expected output gains significantly. In addition, implementing an enlarged FTA within the MENA maximizes such real GDP gains. In general, Morocco seems to gain the most from trade liberalization shocks.
The output responses of the experiment are diverse and it is hard to make gen-eralizations given the complexity of intertemporal general equilibrium effects. Yet, the surge in textiles and meat processing in Morocco and in textiles, heavy manu-facturing goods and high value-added services in Turkey are clearly visible. In the short term, Moroccan textiles production expands by 0.13 per cent, and meat pro-cessing expands by 0.01 per cent. Dynamic adjustments bring positive output responses in all sectors of the Moroccan economy. Even ifno FTP effects are mod-elled, investment demand due to reallocation of consumers' intertemporal prefer-ences leads to an expansion of all sectors exceeding 1 per cent by period 20.
Turkish output responses are also observed to be of a comparable nature. The strongest output response comes from textiles, followed by grains and the heavy manufacturing sectors. The weakest response was observed in services and light manufacturing. In drawing a comparison between the Turkish and Moroccan dynamic results, it is interesting to note that TFP-induced output gains are stronger in Turkey. The 'Rest of the ME region' also displays strong output responses in textiles. Other manufacturing industries expand in the short run, whereas services dwindle. In the long run, investment and TFP effects bring forth very significant expansion of both heavy manufacturing and light manufacturing as well as textiles.
It is interesting to note that manufacturing trade liberalization in all four MENA regions results in contraction of primary agriculture - grains and other crops - in the short run. The static output responses due to reallocation of resources clearly favour manufacturing with the move towards an open economy pricing system. Part of this expansion is due to efficiency gains in resource allo-cation after lowering average tariff protection, and part of it originates from the
Agriculture and trade liberalization in the MENA region 95 level effects of increased investment expenditures that lead to expansion of the capital stock. Both exports and imports expand in all regions following trade lib-eralization, yet the rate of expansion in the latter typically outweighs that of the former, and the trade deficit is expected to widen. The counterpart of this deficit is the rise in the investment-savings gap in the domestic economy.
Investment response is depicted by comparisons between whether trade liber-alization is conducted under coordination or no-coordination within the MENA. TFP-driven growth episodes, not surprisingly, provide strong resource pulls for capital investments. The rise in investment demand reaches 18 per cent at the end of period 20 in Morocco including TFP effects. Even in the absence of such TFP externalities, capital investments are observed to rise by 10 per cent under no coordination and by 12 per cent under the coordinated liberalization scenario. In Turkey, most of the surge in investment demand seems to be driven by TFP gains. Standard capital accumulation results in minor investment expansion. This result may be due to the fact that Turkey has already taken significant steps towards lib-eralizing its trade and the standard gains in intertemporal reallocation have already been realized. Thus, the expected gains from future trade reform are yet to be generated from technological adjustments via TFP shocks for the Turkish economy. The 'Rest of the ME region' also displays strong TFP-induced techno-logical gains, which do not seem to stabilize even after 20 periods. Pure invest-ment effects are also observed to be on a rising trend. In contrast, the North African regional response is an over-shooting in investment demand. The bang-bang1 behaviour in the 'Rest of North Africa' region is the result of the rapid intertemporal substitution that the households face in lieu of the trade shock.
Now we return to individual responses to EU trade patterns. Under the no-coordination episode, exports to EU rise fastest in Morocco, followed by Turkey, the 'Rest of North Africa' and the 'Rest of the ME'. A coordinated FTA stance does not change these results, yet the response of Turkish exports gets closer pro-portionally to the Moroccan performance over the medium term. A coordinated FTA within the MENA region clearly seems to be a superior strategy in trade liberalizing experiments vis-a-vis the EU.
4 Conclusions
Some caveats on the limitations of the study are necessary before we proceed with the summary of our main findings. First, it has to be clear that with this type of methodology, no definite conclusions can be drawn about the characterization of the future path of the economy based on 'calendar' dates. The policy experi-ments performed are basically of a comparative nature and are meaningful only in relation to each other rather than revealing forecasts for the future.
Second, both consumption and production activities of the economy are mod-elled in very aggregate terms. The idea of a representative national consumer, though a common device in modem macroeconomic thinking, precludes any analysis addressing income distribution questions and may seem implausible. This specification reflects, however, our main objective in focusing mostly on the
96 Bayar et al.
dynamics of adjustment of the macro aggregates along a transition path in response to broad policy shifts, and on processes of resource allocation, which reflect changes in production efficiency. Thus, as such, many of our insights derived from the simulation exercises do not depend on detailed considerations of heterogeneity of the private sector. In similar vein, government saving and invest-ment behaviour are not addressed and, hence, the spill-over effects of public con-sumption and investment in the private sector are not captured. In the absence of empirical evidence on the nature and causes of such spill-overs ( especially in the context of a developing country), we try to avoid forming arbitrary algebraic characterizations as much as possible, and avoid modelling the public sector as an optimizing agent.
Third, one has to note that the adjustment path as characterized by the simula-tion exercises reflect equilibrium relasimula-tionships on a smooth time horizon, mainly in the absence of rigidities and/or structural bottlenecks. Thus, the speed of tran-sitional adjustment of many variables to their respective equilibrium paths should not be taken as a measure of the global stability properties of the modelled economies, but rather as a direct outcome of the laboratory characteristics of a macroeconomic model with continuous, well-behaved functional forms. For these reasons, our results should be at best regarded as crude approximations of the long-run equilibrium effects of a variety of foreign trade policies on the current account, output, capital accumulation and the real exchange rate.
The model results reveal that the expected positive outcomes of the current CU agreement between the EU and Turkey very much depend on whether the non-tariff barriers can be eliminated and a move towards a more competitive environment be sustained. The simulation results suggest that expected gains from bilateral trade liberalizations with the EU depend crucially upon whether TFP externalities can be internalized over the dynamic adjustments towards equilibrium.
Across individual sectors, 'textiles and clothing' reveals itself as the leading exporting sector in all economies of the region that stands to have significant gains from the trade liberalization episodes. Our experiment results suggest that primary agriculture and intermediate goods utilize excessive resources in com-parison with the first-best open trade arrangements. According to our analysis of the patterns of macroeconomic adjustments in response to the elimination of tar-iff protection, trade deficits of the region's economies are likely to increase. This in turn raises the question of how feasible access to foreign resources can be in the longer term as a way of bridging the widening trade gap.
Clearly, many of these outcomes will depend upon a host of political factors, which we cannot address satisfactorily. There is a greater degree of uncertainty about the factors that will determine the impact of enlargement of trade liberal-ization, or extension of the Regional Trade Agreements (RTAs) in the Middle East and the North African economies. Moreover, these outcomes will also depend on many exogenous factors, and given the complexity of issues surrounding the trade liberalization initiatives, we need a coherent framework that can take all the fun-damental macrodynamic and microsectoral effects into account. We believe that the multi-region, multi-sector framework based on an intertemporal dynamic
Agriculture and trade liberalization in the MENA region 97 methodology presented here provides an initial step in understanding these fundamentals.
Notes
* This chapter draws in part on an early work of MEDATEAM in Brussels.
1 Bang-bang investment behaviour means that firms behave as extremists, trying to buy as much as possible or scrap as much as possible to reach their desired rate quickly. This type of behaviour makes investment highly volatile.
References
Bayar, A., X. Diao, and E. Yeldan (2000) 'An intertemporal, multi-region general equilibrium model of agricultural trade liberalization in the South-Mediterranean NICs, Turkey and the European Union', IFPRI TMD Discussion Paper, no. 56, Washington, DC: IFPRI. Coe, D., E. Helpman, and A. Hoffmeister (1997) 'North-South R&D spillovers', The
Economic Journal, 107(1): 134-149.
De Melo, J. and S. Robinson (1992) 'Productivity and externalities: models of export-led growth', Journal of International Trade and Economic Development, 1(1): 41-68. De Rosa, A. (1997) 'Agricultural trade and rural development in the MENA: recent
devel-opments and prospects', International Trade Division Policy Research Working Paper No. 1279, Washington, DC: World Bank.
Diao, X. and A. Somwaru (2000) 'An inquiry on general equilibrium effects of MER COS UR: an intertemporal world model', Journal of Policy Modelling, 22(5): 557-588.
Diao, X., T. Roe, and E. Yeldan (1999) 'How fiscal mis-management may impede trade reform: lessons from an intertemporal, multi-sector general equilibrium model for Turkey', The Developing Economies, 37(1): 59-88.
European Commission (1998) The Situation of Agriculture in the European Union 1998,
Brussels: European Commission.
Frankel, J. and D. Romer (1999) 'Does trade cause growth?', The American Economic Review, 89(3): 379-399.
Grethe, H. and S. Tangermann (1998) 'The new Euro-Mediterranean Agreements, an analysis of trade preferences in agriculture', mimeo, Gottingen: University ofGottingen. Levine, R. and D. Renelt ( 1992) 'A sensitivity analysis of cross-country regressions', The
American Economic Review, 82(4): 942-963.
McKibbin, W. J. (1993) 'Integrating Macroeconomic and Multi-Sector Computable General Equilibrium Models', Brooking Discussion Papers in International Economics No. 100, Washington, DC: The Brookings Institution.
Mercenier, J. and M. Sampaio De Souza (1994) 'Structural adjustment and growth in a highly indebted market economy: Brazil', in Mercenier, J. and T. Srinivasan (eds),
Applied General Equilibrium Analysis and Economic Development, Ann Arbor, MI: University of Michigan Press, pp. 281-310.
Mercenier, J. and E. Yeldan (1997) 'On Turkey's trade policy: is a customs union with Europe enough?', European Economic Review, 41(5): 871-880.
Obstfeld, M. and K. Rogoff (1996) Foundations of International Macroeconomics,
Cambridge, MA and London: MIT Press.
Yeldan, E., T. Roe, and S. Robinson (1998) 'Trade liberalization, accumulation and growth in an archetype model of Africa, South Asia, East Asia and Latin America', mimeo,