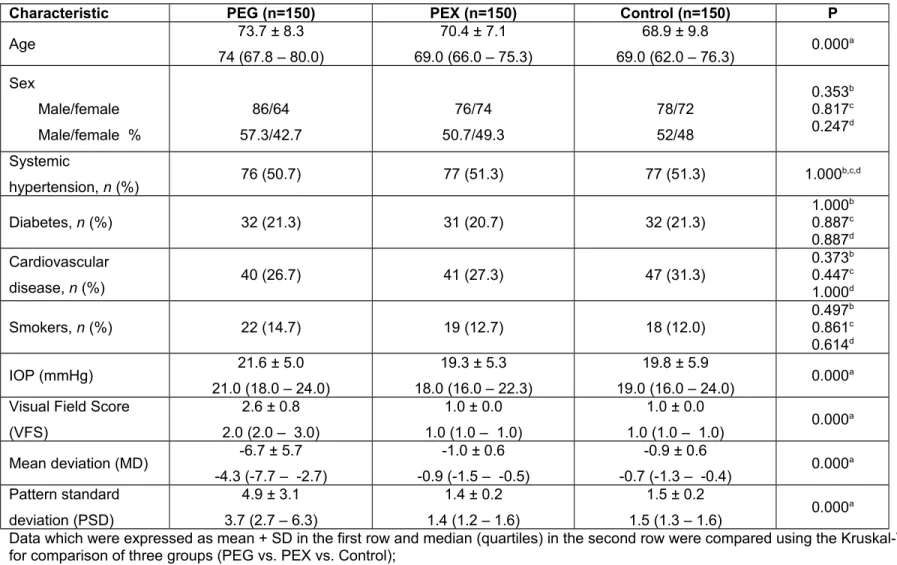
Table 1. Demographic and visual clinical characteristics of PEG and PEX patients and control subjects.
Characteristic PEG (n=150) PEX (n=150) Control (n=150) P
Age 73.7 ± 8.3 74 (67.8 – 80.0) 70.4 ± 7.1 69.0 (66.0 – 75.3) 68.9 ± 9.8 69.0 (62.0 – 76.3) 0.000 a Sex Male/female Male/female % 86/64 57.3/42.7 76/74 50.7/49.3 78/72 52/48 0.353b 0.817c 0.247d Systemic hypertension, n (%) 76 (50.7) 77 (51.3) 77 (51.3) 1.000 b,c,d Diabetes, n (%) 32 (21.3) 31 (20.7) 32 (21.3) 1.000 b 0.887c 0.887d Cardiovascular disease, n (%) 40 (26.7) 41 (27.3) 47 (31.3) 0.373b 0.447c 1.000d Smokers, n (%) 22 (14.7) 19 (12.7) 18 (12.0) 0.497 b 0.861c 0.614d IOP (mmHg) 21.6 ± 5.0 21.0 (18.0 – 24.0) 19.3 ± 5.3 18.0 (16.0 – 22.3) 19.8 ± 5.9 19.0 (16.0 – 24.0) 0.000 a
Visual Field Score (VFS) 2.6 ± 0.8 2.0 (2.0 – 3.0) 1.0 ± 0.0 1.0 (1.0 – 1.0) 1.0 ± 0.0 1.0 (1.0 – 1.0) 0.000 a Mean deviation (MD) -6.7 ± 5.7 -4.3 (-7.7 – -2.7) -1.0 ± 0.6 -0.9 (-1.5 – -0.5) -0.9 ± 0.6 -0.7 (-1.3 – -0.4) 0.000 a Pattern standard deviation (PSD) 4.9 ± 3.1 3.7 (2.7 – 6.3) 1.4 ± 0.2 1.4 (1.2 – 1.6) 1.5 ± 0.2 1.5 (1.3 – 1.6) 0.000 a
Data which were expressed as mean + SD in the first row and median (quartiles) in the second row were compared using the Kruskal-Wallis test; a P value is
for comparison of three groups (PEG vs. PEX vs. Control);
Data which were expressed as frequencies and percentages were compared using the chi-squared test; b PEG vs. control, c PEX vs. control, d PEG vs. PEX.
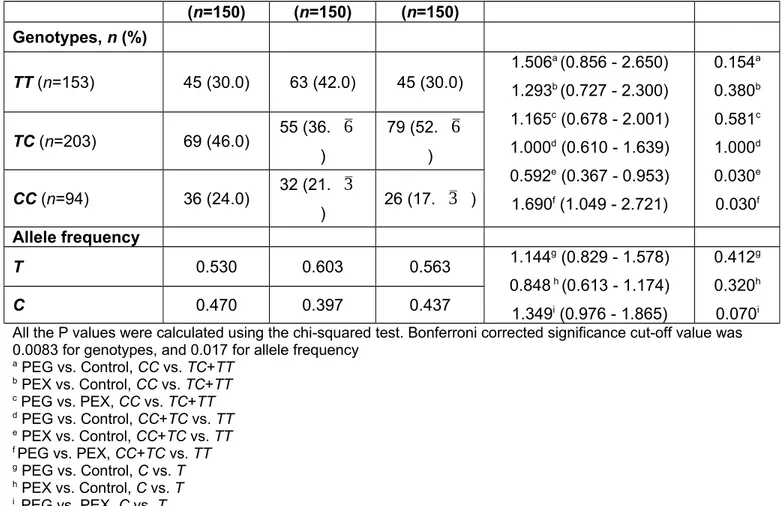
Table 2. PON1 −107T/C (rs705379) genotype and allele frequencies of PEG patients, PEX patients and controls
(n=150) (n=150) (n=150) Genotypes, n (%) TT (n=153) 45 (30.0) 63 (42.0) 45 (30.0) 1.506a (0.856 - 2.650) 1.293b (0.727 - 2.300) 1.165c (0.678 - 2.001) 1.000d (0.610 - 1.639) 0.592e (0.367 - 0.953) 1.690f (1.049 - 2.721) 0.154a 0.380b 0.581c 1.000d 0.030e 0.030f TC (n=203) 69 (46.0) 55 (36.
6
) 79 (52.6
) CC (n=94) 36 (24.0) 32 (21.3
) 26 (17.3
) Allele frequency T 0.530 0.603 0.563 1.144g (0.829 - 1.578) 0.848 h (0.613 - 1.174) 1.349i (0.976 - 1.865) 0.412g 0.320h 0.070i C 0.470 0.397 0.437All the P values were calculated using the chi-squared test. Bonferroni corrected significance cut-off value was 0.0083 for genotypes, and 0.017 for allele frequency
a PEG vs. Control, CC vs. TC+TT b PEX vs. Control, CC vs. TC+TT c PEG vs. PEX, CC vs. TC+TT d PEG vs. Control, CC+TC vs. TT e PEX vs. Control, CC+TC vs. TT f PEG vs. PEX, CC+TC vs. TT g PEG vs. Control, C vs. T h PEX vs. Control, C vs. T i PEG vs. PEX, C vs. T
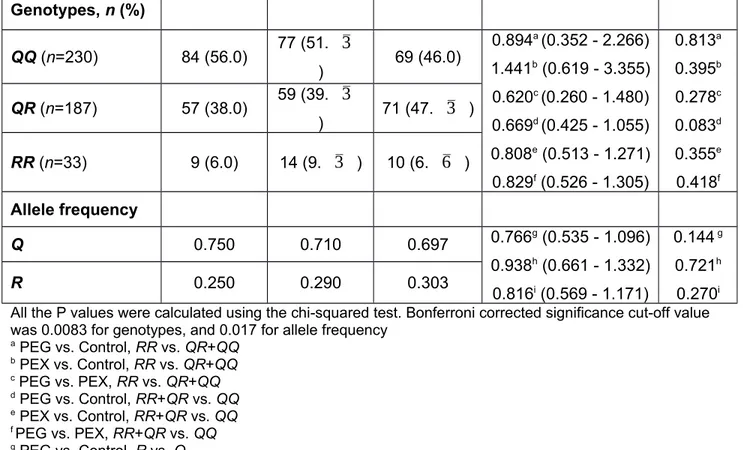
Table 3. PON1 192Q/R (rs662) genotype and allele frequencies of PEG patients, PEX patients and controls PEG (n=150) PEX (n=150) Control (n=150) OR (95% CI) P
Genotypes, n (%) QQ (n=230) 84 (56.0) 77 (51.
3
) 69 (46.0) 0.894a (0.352 - 2.266) 1.441b (0.619 - 3.355) 0.620c (0.260 - 1.480) 0.669d (0.425 - 1.055) 0.808e (0.513 - 1.271) 0.829f (0.526 - 1.305) 0.813a 0.395b 0.278c 0.083d 0.355e 0.418f QR (n=187) 57 (38.0) 59 (39.3
) 71 (47.3
) RR (n=33) 9 (6.0) 14 (9.3
) 10 (6.6
) Allele frequency Q 0.750 0.710 0.697 0.766g (0.535 - 1.096) 0.938h (0.661 - 1.332) 0.816i (0.569 - 1.171) 0.144 g 0.721h 0.270i R 0.250 0.290 0.303All the P values were calculated using the chi-squared test. Bonferroni corrected significance cut-off value was 0.0083 for genotypes, and 0.017 for allele frequency
a PEG vs. Control, RR vs. QR+QQ b PEX vs. Control, RR vs. QR+QQ c PEG vs. PEX, RR vs. QR+QQ d PEG vs. Control, RR+QR vs. QQ e PEX vs. Control, RR+QR vs. QQ f PEG vs. PEX, RR+QR vs. QQ g PEG vs. Control, R vs. Q h PEX vs. Control, R vs. Q i PEG vs. PEX, R vs. Q
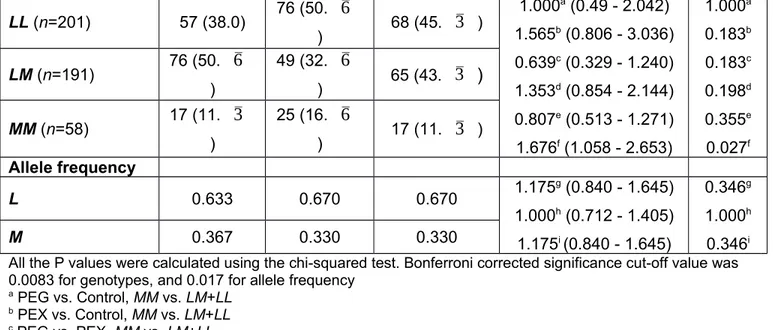
Table 4. PON1 55L/M (rs854560) genotype and allele frequencies of PEG patients, PEX patients and controls PEG (n=150) PEX (n=150) Control (n=150) OR (95% CI) P Genotypes, n (%)
LL (n=201) 57 (38.0) 76 (50.
6
) 68 (45.3
) 1.000a (0.49 - 2.042) 1.565b (0.806 - 3.036) 0.639c (0.329 - 1.240) 1.353d (0.854 - 2.144) 0.807e (0.513 - 1.271) 1.676f (1.058 - 2.653) 1.000a 0.183b 0.183c 0.198d 0.355e 0.027f LM (n=191) 76 (50.6
) 49 (32.6
) 65 (43.3
)
MM (n=58) 17 (11.3
) 25 (16.6
) 17 (11.3
) Allele frequency L 0.633 0.670 0.670 1.175 g (0.840 - 1.645) 1.000h (0.712 - 1.405) 1.175i (0.840 - 1.645) 0.346g 1.000h 0.346i M 0.367 0.330 0.330All the P values were calculated using the chi-squared test. Bonferroni corrected significance cut-off value was 0.0083 for genotypes, and 0.017 for allele frequency
a PEG vs. Control, MM vs. LM+LL b PEX vs. Control, MM vs. LM+LL c PEG vs. PEX, MM vs. LM+LL d PEG vs. Control, MM+LM vs. LL e PEX vs. Control, MM+LM vs. LL f PEG vs. PEX, MM+LM vs. LL g PEG vs. Control, M vs. L h PEX vs. Control, M vs. L i PEG vs. PEX, M vs. L
Table 5. Stratification of visual clinical characteristics of PEG, PEX and control groups with respect to PON1 −107T/C genotypes Clinical
characteristic
−107T/C Genotype
PEG PEX Control P
IOP (mmHg) TT 2.0 (18.0 – 25.0)21.2 ± 4.9 18.0 (16.0 – 23.0)19.6 ± 4.8 18.0 (14.0 – 22.0)19.1 ± 6.3 0.051a 0.016b 0.335c 0.100d TC + CC 21.8 ± 5.0 19.1 ± 5.6 20.1 ± 5.8 0.001a
21.0 (18.0 – 24.0) 18.0 (15.0 – 22.0) 19.0 (16.0 – 24.0) 0.011 b 0.168c 0.000d P* 0.654 0.335 0.172 VFS TT 2.0 (2.0 – 3.0)2.5 ± 0.8 1.0 (1.0 – 1.0)1.0 ± 0.0 1.0 (1.0 – 1.0)1.0 ± 0.0 0.000a 0.000b 1.000c 0.000d TC + CC 2.0 (2.0 – 3.0)2.7 ± 0.8 1.0 (1.0 – 1.0)1.0 ± 0.0 1.0 (1.0 – 1.0)1.0 ± 0.0 0.000a 0.000b 1.000c 0.000d P* 0.275 1.000 1.000 MD TT -3.6 (-7.5 – -2.3)-6.0 ± 5.9 -1,1 (-1.5 – -0.4)-1.0 ± 0.6 -0.8 (-1.5 – -0.6)-1.0 ± 0.6 0.000a 0.000b 0.963c 0.000d TC + CC -4.3 (-8.0 – -3.3)-7.0 ± 5.6 -0.8 (-1.4 – -0.6)-1.0 ± 0.5 -0.7 (-1.3 – -0.3)-0.8 ± 0.6 0.000a 0.000b 0.006c 0.000d P* 0.109 0.915 0.066 PSD TT 3.5 (2.3 – 6.2) 4.6 ± 3.0 1.3 (1.2 – 1.6) 1.4 ± 0.2 1.5 (1.2 – 1.6)1.5 ± 0.2 0.000a 0.000b 0.123c 0.000d TC + CC 3.8 (2.8 – 6.5)5.1 ± 3.1 1.5 (1.3 – 1.7)1.5 ± 0.2 1.4 (1.3 – 1.7)1.5 ± 0.2 0.000a 0.000b 0.591c 0.000d P* 0.273 0.038 0.908
Data given as mean ± SD in the first row, and as median and quartiles (first quartile-third quartile) in the second row.
a Comparison of three groups (PEG vs. PEX vs. Control) by Kruskal-Wallis test, b PEG vs. Control; c PEX vs. Control; d PEG vs. PEX by Conover’s formula.
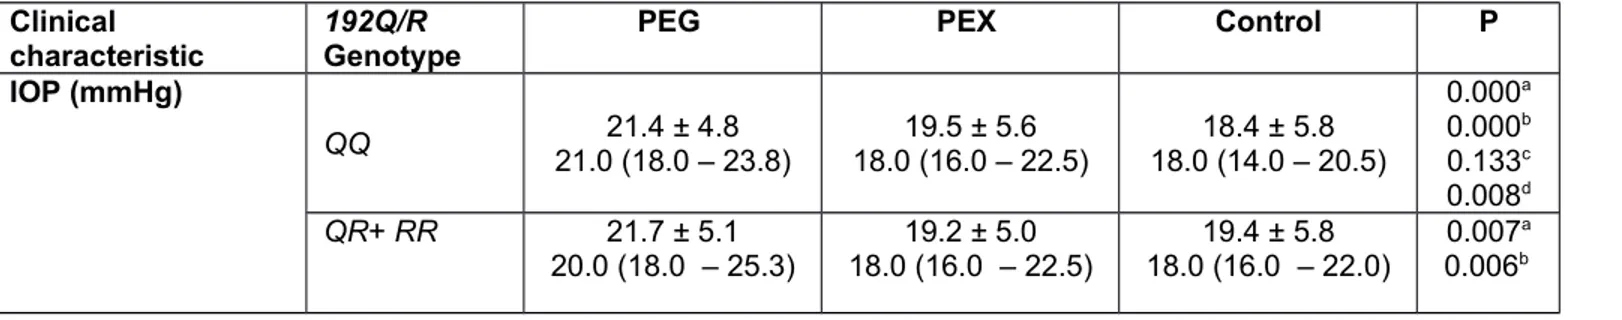
Table 6. Stratification of visual clinical characteristics of PEG, PEX and control groups with respect to PON1 192Q/R genotypes Clinical
characteristic 192Q/R Genotype PEG PEX Control P
IOP (mmHg) QQ 21.0 (18.0 – 23.8)21.4 ± 4.8 18.0 (16.0 – 22.5)19.5 ± 5.6 18.0 (14.0 – 20.5)18.4 ± 5.8 0.000a 0.000b 0.133c 0.008d QR+ RR 21.7 ± 5.1 20.0 (18.0 – 25.3) 18.0 (16.0 – 22.5)19.2 ± 5.0 18.0 (16.0 – 22.0)19.4 ± 5.8 0.007 a 0.006b
0.933c 0.005d P* 0.974 0.841 0.169 VFS QQ 2.0 (2.0 – 3.0)2.7 ± 0.8 1.0 (1.0 – 1.0)1.0 ± 0.0 1.0 (1.0 – 1.0)1.0 ± 0.0 0.000a 0.000b 1.000c 0.000d QR+ RR 2.0 (2.0 – 3.0)2.6 ± 0.8 1.0 (1.0 – 1.0)1.0 ± 0.0 1.0 (1.0 – 1.0)1.0 ± 0.0 0.000a 0.000b 1.000c 0.000d P* 0.375 1.000 1.000 MD QQ -4.5 (-8.1 – -3.1)-6.9 ± 5.5 -1.1 (-1.5 – -0.6)-1.0 ± 0.5 -0.7 (-1.3 – -0.4)-0.9 ± 0.6 0.000a 0.000b 0.051c 0.000d QR+ RR -3.7 (-7.3 – -2.4)-6.3 ± 6.0 -0.8 (-1.6 – -0.4)-1.0 ± 0.6 -0.8 (-1.4 – -0,4)-0.9 ± 0.6 0.000a 0.000b 0.393c 0.000d P* 0.148 0.644 0.547 PSD QQ 3.7 (2.8 – 6.2)4.8 ± 3.0 1.5 (1.3 – 1.7)1.5 ± 0.2 1.5 (1.3 – 1.7)1.5 ± 0.2 0.000a 0.000b 0.768c 0.000d QR+ RR 4.2 (2.5 – 6.5)5.0 ± 3.2 1.4 (1.2 – 1.6)1.4 ± 0.2 1.5 (1.3 – 1.6)1.6 ± 0.2 0.000a 0.000b 0.126c 0.000d P* 0.678 0.193 0.739
Data given as mean ± SD in the first row, and as median and quartiles (first quartile-third quartile) in the second row.
a Comparison of three groups (PEG vs. PEX vs. Control) by Kruskal-Wallis test, b PEG vs. Control; c PEX vs. Control; d PEG vs. PEX by Conover’s formula.
Table 7. Stratification of visual clinical characteristics of PEG. PEX and control groups with respect to PON1 55L/M genotypes Clinical
characteristic
55L/M Genotype
PEG PEX Control P
IOP (mmHg) LL 21.0 (18.0 –24.0)21.8 ± 5.2 19.0 (16.0 –23.0)19.7 ± 5.3 19.0 (15.5 –23.5)19.7 ±6.2 0.014a 0.008b 0.797c 0.012d LM + MM 21.4 ± 4.7 21.0 (18.0 –24.0) 18.6 ± 5.3 18.0 (14.5 –22.0) 17.7 ± 4.9 17.0 (14.0 –20.0) 0.000a 0.000b 0.330c 0.000d
P* 0.871 0.151 0.041 VFS LL 2.0 (2.0 – 3.0)2.6 ± 0.8 1.0 (1.0 –1.0)1.0 ± 0.0 1.0 (1.0 –1.0)1.0 ± 0.0 0.000a 0.000b 1.000c 0.000d LM + MM 3.0 (2.0 – 3.0)2.7 ± 0.8 1.0 (1.0 –1.0)1.0 ± 0.0 1.0 (1.0 –1.0)1.0 ± 0.0 0.000a 0.000b 1.000c 0.000d P* 0.267 1.000 1.000 MD LL -3.9 (-7.5 – -2.4)-6.3 ± 5.4 -0.9 (-1.5 – -0.6)-1.0 ± 0.6 -0.8 (-1.4 – -0.4)-0.9 ± 0.6 0.000a 0.000b 0.278c 0.000d LM + MM -6.3 (-7.8 – -2.9)-7.0 ± 6.0 -1.1 (-1.4 – -0.4)-1.0 ± 0.6 -0.7 (-1.3 – -0.4)-0.8 ± 0.5 0.000a 0.000b 0.110c 0.000d P* 0.186 0.838 0.408 PSD LL 3.7 (2.8 – 6.2)4.8 ± 3.1 1.4 (1.3 – 1.6)1.5 ± 0.2 1.5 (1.3 – 1.7)1.5 ± 0.2 0.000a 0.000b 0.172c 0.000d LM + MM 4.4 (2.7 –6.4)5.0 ± 3.0 1.4 (1.2 – 1.6)1.4 ± 0.2 1.4 (1.2 –1.7)1.4 ± 0.3 0.000a 0.000b 0.586c 0.000d P* 0.561 0.191 0.079
Data given as mean ± SD in the first row and as median and quartiles (first quartile-third quartile) in the second row.
a Comparison of three groups (PEG vs. PEX vs. Control) by Kruskal-Wallis test, b PEG vs. Control; c PEX vs. Control; d PEG vs. PEX by Conover’s formula.
Table 8 Distribution of PON1 -107T/C, 192Q/R and 55L/M minor allele frequencies in different visual field severity stages (VFS)
VFS Minor allele frequency
PON1 -107C PON1 192R PON1 55M
1 0.417 0.297 0.330
2 0.433 0.271 0.348
3 0.522 0.200 0.402
4 0.500 0.278 0.306
5 0.500 0.250 0.625
The highest and lowest frequencies were compared using the chi-squared test. None of the frequencies differed significantly across the VFS groups