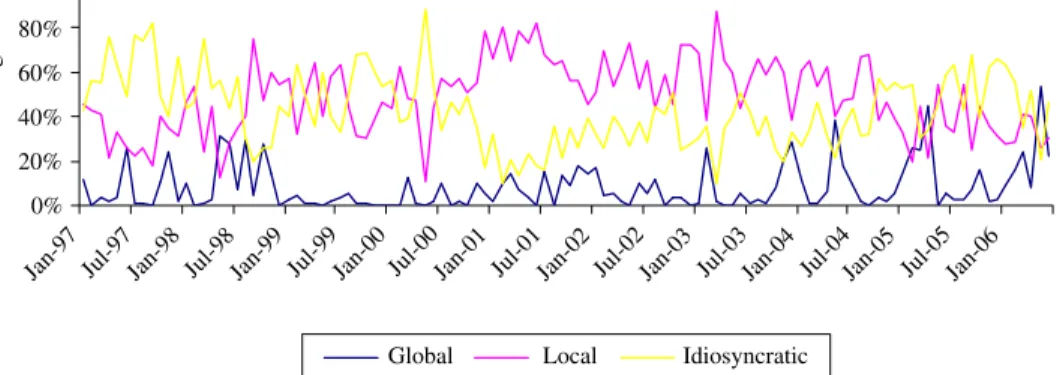
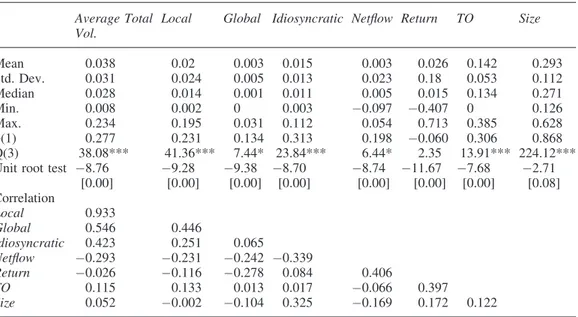
Foreign equity trading and average stock-return volatility
Tam metin
Şekil

Benzer Belgeler
Biyoloji öğretmen adaylarının nesli tükenen canlı kavramıyla ilgili bilişsel yapılarının çizme-yazma tekniği kullanılarak elde edilen verilerine ait çizimler
Bu proje çalışmasında, Emotiv EEG Neuroheadset cihazı kullanılarak kararlı durum görsel uyaranlar kullanılarak elde edilen EEG işaretlerinin doğru bir şekilde
Haberle yorumun ayrılması; haber - yorum denge sinin kurulması; muhabirlere ve habere bugün oldu ğundan çok daha fazla değer ve yer verilmesi, bası nın
Şiar Bey eserin yayınlanması için kuruma defalarca başvurmuş, ama tatmin edici cevap alamamıştı bir
[r]
İzalı y ap ılm a d ıkça, çok sesli müziği ta n ıtır ı yollar bulunm adıkça İl Radyosu bir pikaptan öteye
Ondalık gösterimlerle toplama ve çıkarma işlemi yapılırken, aynı basamakların alt alta gelme- si için virgüller alt alta getirilir.. /DersimisVideo ABONE
Okur, yazann zihninin işle yişine tanık olduğunu neden sonra anlar, aynca bilinçakışına tanık olduğu kişinin kim olduğunu da pek bilemez, çünkü yazar sadece kendi
