A PHARMACEUTICALS PRICING PROBLEM
The Institute of Economics and Social Sciences of
Bilkent University
by
ŞEBNEM KOLSARICI
In Partial Fulfillment of the Requirements for the Degree of MASTER OF ARTS
in
THE DEPARTMENT OF ECONOMICS BİLKENT UNIVERSITY
ANKARA
I certify that I have read this thesis and have found that it is fully adequate, in scope and in quality, as a thesis for the degree of Master of Arts in Economics.
--- Assist. Prof. Dr. Ümit Özlale Supervisor
I certify that I have read this thesis and have found that it is fully adequate, in scope and in quality, as a thesis for the degree of Master of Arts in Economics.
--- Associate Prof. Dr. Çağla Ökten Examining Committee Member
I certify that I have read this thesis and have found that it is fully adequate, in scope and in quality, as a thesis for the degree of Master of Arts in Economics.
--- Assist. Prof. Dr. Kasırga Yıldırak Examining Committee Member
Approval of the Institute of Economics and Social Sciences
--- Prof. Dr. Erdal Erel
iii
ABSTRACT
A PHARMACEUTICALS PRICING PROBLEM
Kolsarıcı , Şebnem M.A., Department of Economics Supervisor: Assist. Prof. Ümit Özlale
September 2009
Pharmaceuticals Market, both globally and in Turkey, is subject to a material tendency in curtailing health expenditures mainly through two instruments; generic drug utilization and policy changes regarding pricing and reimbursement. Although government agencies pay back ~90% of pharmaceuticals expenditures, as a result of policy changes and current market dynamics patients may face an out of pocket extra co-payment for brand-name drugs. In this challenging market, some important questions emerge regarding the extra co-payment such as how does demand change with the existence of an extra co-payment, how much do patients substitute to generics after facing extra co-payment, how do firms may set the prices optimally so manage the trade off between price and quantity sold. As the novelty of this thesis, we try to model the demand function through a simple application for an example drug, named Lipitor. According to the estimation for the demand function, we found that “extra co-payment” is a significant factor on the market share. The market share decreases with an increase in extra co-payment as patients do switch to generics. We also estimated the price elasticity. Then we solved the firm’s optimization problem which maximizes revenue subject to the firm’s only control variable, extra co-payment. A core finding is that firms should not necessarily minimize or zero extra co-payment as they do not compensate that loss with the corresponding increase in the market share. Instead firms should optimize the extra co-payment.
Key Words: Pharmaceuticals Market, Reimbursement, Pricing, Demand, Additional co-payment
iv ÖZET
İLAÇ SEKTÖRÜNDE BİR FİYATLANDIRMA PROBLEMİ Kolsarıcı, Şebnem
Yüksek Lisans, Ekonomi Bölümü Tez Yöneticisi: Doç. Dr. Ümit Özlale
Eylül 2009
Dünyada olduğu gibi Türkiye ilaç sektöründe de sağlık harcamalarının kısılması yönünde ciddi bir eğilim mevcut. Sağlık harcamaları iki en önemli araçla azaltılmak isteniyor; eşdeğer ilaç kullanımının arttırılması ve fiyatlandırma ve geri ödeme politikası değişiklikleri. İlaç harcamalarının yaklaşık %90’ının devlet tarafından geri ödenmesine rağmen, değişen politikalar ve güncel Pazar dinamikleri neticesinde hastalar orijinal ilaçlar için ceplerinden ödedikleri ek hasta katkı payıyla karşılaşabiliyorlar. Bu zorlayıcı pazarda, ek hasta katkı payıyla ilgili “Talep, ek hasta katkı payıyla nasıl değişmektedir?”, “Hastalar ek hasta katkı payı nedeniyle eşdeğer ilaçlara ne kadar değişim yapmaktadırlar?”, “İlaç firmaları satış ünitesi ve fiyat arasındaki dengeyi göz önünde bulundurarak en uygun fiyatı nasıl belirleyebilir?” gibi bazı sorular öne çıkmaktadır. Bu tezde Lipitor isimli ilaç üzerinde talep eğrisinin tahmini yapmaya çalıştık. Talep eğrisi tahminine göre ek hasta katkı payının ilacın Pazar payı üzerinde belirgin etkili değişkenlerden biri olduğunu bulduk. Ek hasta katkı payı arttıkça hastalar reçetelerini eşdeğer ilaca değiştirmekte ve buna bağlı olarak Pazar payı düşmektedir. Fiyat esnekliğini de tahmin ettik. Sonrasında ilaç şirketinin tek kontrol değişkeni olan fiyata göre gelir maksimizasyonu problemini çözdük. Önemli bulgumuz ise fiyattan kaybedilen geliri Pazar payındaki artışla telafi edemediklerinden şirketler ek hasta katkı payını azaltmamalıdırlar, bunun yerine geliri maksimize eden en uygun fiyatı tespit edebilirler.
v
ACKNOWLEDGMENTS
First and foremost, I would like to express my deepest gratitude to my supervisor Ümit Özlale for his guidance, support and cooperation. He provided me insights and encouragement to carry on research on this subject. At every step of the research, he led me with patience.
I would also like to express my sincere gratitude to my managers and colleagues at Pfizer. From the beginning, they gave me unconditional support to continue my thesis studies. My manager Hakan Ezber and my colleagues in Pfizer Dinçer Çetin, Can Aşkın, Sema Yavuz, Yasin Bakılan, Ürün Şavklı and Esat Oğuz always supported me and provided help whenever I need throughout the research.
I would also like to thank my dear friends Bengisu Vural and Zeynep Oğur for their support even in the hardest times.
Finally, a big thank you goes to Nuray and Özer Kolsarıcı, the best parents ever, and Ceren Kolsarıcı, the most brilliant sister of the world, for the motivation, love and understanding that they provided me at all times.
vi
TABLE OF CONTENTS
ABSTRACT ... iii
ÖZET ...iv
ACKNOWLEDGEMENTS...v
TABLE OF CONTENTS ... vi
LIST OF TABLES ... viii
LIST OF FIGURES ...ix
CHAPTER 1: INTRODUCTION ... 1
CHAPTER 2: PHARMACEUTICALS MARKET ... 6
2.1. Global Pharmaceuticals Market ... 6
2.2. Pharmaceuticals Market Turkey ... 10
2.3. Pricing and Reimbursement Policies in Turkey ... 14
2.3.1. Basic Notions ... 14
2.3.2. Pricing ... ....16
2.3.3. Reimbursment Policy Turkey ... ..18
CHAPTER 3: RELATED LITERATURE ... 21
CHAPTER 4: DATA ... 26
CHAPTER 5: MODELING FRAMEWORK ... 33
5.1. Assumptions regarding Demand and Supply Curves ... 35
5.2. Heteroscedasticity and Autocorrelation Tests ... 37
5.2.1. Testing for Autocorrelation ... ....38
5.2.2. Testing for Heteroscedasticity ... ..42
5.3. Unit Root Tests: ... 45
CHAPTER 6: EMPIRICAL ANALYSIS….………..48
6.1. Estimating the Demand curve ... 48
6.2. Finding the Optimal Price ... 49
6.3. Estimation & Empirical Results... 52
6.3.1. Lipitor 10 mg 30 tablet ... ....53
6.3.2. Lipitor 20 mg 30 tablet ... ....57
6.3.3. Lipitor 40 mg 30 tablet ... ....60
6.3.4. Lipitor 10 mg 90 tablet ... ....63
vii
6.3.6. Lipitor 80 mg 30 tablet ... ....66
6.3.7. Lipitor 40 mg 90 tablet ... ....71
6.3.8. Lipitor 80 mg 90 tablet ... ....73
6.3. Estimation the Price Elasticity ... ....74
CHAPTER 7: FINDINGS... 77 CHAPTER 8: CONCLUSION. ... 81 SELECT BIBLIOGRAPHY ... 83 APPENDICES ... 85 Appendix 1 ... 85 Appendix 2 ... 90 Appendix 3 ... 93
viii
LIST OF TABLES
Table 1: Sales in Launch Year and Launch performance ... 13
Table 2: Originals vs. Generics in the market in terms of value and Sales Unit ... 14
Table 3: Pricing of Pharmaceuticals; Original and Generic Products ... 17
Table 4: Wholesaler and Pharmacist Mark-ups ... 17
Table 5:Pharmacist Discounts ... 20
Table 6: Importer and manufacturer discount rates ... 20
Table 7: Correlation between independent variables ... 38
Table 8: Results for testing Positive Autocorrelation ... 40
Table 9: Results for Testing Negative Autocorrelation ... 41
Table 10: Results of White’s Heteroscedasticity Test ... 43
Table 11: Summary of Autocorrelation and Heteroscedasticity Tests ... 44
Table 12: Unit Root Test Results ... 46
Table 13: Regression Output for Lipitor 10 mg 30 Tablets ... 54
Table 14: Regression Output for Lipitor 20 mg 30 Tablets ... 57
Table 15: Regression Output for Lipitor 40 mg 30 tablets ... 61
Table 16: Regression Output for Lipitor 10 mg 90 tablets ... 64
Table 17: Regression Output for Lipitor 20 mg 90 tablets ... 66
Table 18: Regression Output for Lipitor 10 mg 90 tablets ... 69
Table 19: Regression Output for Lipitor 40 mg 90 tablets ... 71
Table 20: Regression Output for Lipitor 40 mg 90 tablets ... 73
Table 21: Summary of Results ... 78
Table 22: Summary of Results for Optimal Price ... 79
ix
LIST OF FIGURES
Figure 1: The Global Pharmaceuticals Market Size and Growth ... 6
Figure 2: Wave of Genericization and Patent losses ... 8
Figure 3: The declining number of new product launches ... 9
Figure 4: The Size of Turkish Pharmaceutical Market after Foam ... 10
Figure 5: The Size and Growth of Turkish Pharmaceutical Market ... 11
Figure 6: The Number of New Product Launches in Turkish Pharma Market ... 12
Figure 7: Increasing # of new products, # of new launches ... 12
Figure 8: Originals vs. Generics in the market ... 13
Figure 9: Lipitor Sales (TL) from 2005 to 2009(MAT) ... 28
Figure 10: Atorvastatin Market Size (TL) from 2005 to 2009(MAT) ... 29
Figure 11: Graph of Residuals and Regression for Lipitor 10 mg 30 Tablets ... 55
Figure 12: Graph of the Objective Function for Lipitor 10 mg 30 Tablets ... 56
Figure 13: Graph of Residuals, Actual and Fitted Line ... 58
Figure 14: Graph of the Objective Function for Lipitor 20 mg 30 Tablets ... 59
Figure 15: Graph of Residuals, Actual and Fitted Line ... 60
Figure 16: Graph of the objective function for Lipitor 20 mg 30 tablets ... 62
Figure 17: Graph of Residuals, Actual and Fitted Line ... 63
Figure 18: Graph of the objective function for Lipitor 10 mg 90 tablets ... 65
Figure 19: Graph of Residuals, Actual and Fitted Line ... 67
Figure 20: Graph of the objective function for Lipitor 20 mg 90 tablets ... 68
Figure 21: Graph of Residuals, Actual and Fitted Line ... 70
Figure 22: Graph of Residuals, Actual and Fitted Line ... 72
1
CHAPTER 1
INTRODUCTION
The pharmaceuticals industry which has a net value of $800 billion globally and a net value of $10 billion in Turkey, is a continuously growing industry with intense competition. Four major players in the Turkish pharmaceutical market can be identified. Of these, the first one is the payers constituting several government agencies which pay back 85% (Generic Drugs in Turkey, 2006: 6) of the market’s sales through various insurances despite having a restricted budget to a large extent. The second major player is the pharmaceutical companies which develop, produce and sell the drugs in the market. Wholesalers and pharmacies enable the distribution of drugs to the final player which is the patient. The largest buyer is different than the consumer in the pharmaceuticals market. The buyer – Government- also has a great role in the market conditions such as competition and all drug prices. The two facts that the biggest customer, the government, is no consumer at all and that the biggest customer sets the market conditions alone, make the economic dynamics appealing in terms of modeling.
2
The recent changes in the market dynamics and which will likely to continue in the following years, mainly the increasing trend in patent losses in the world, the declining trend in the number of new product launches, the fact that payers now require better evidence for new products, increasing safety issues, made competition more important than ever.
While the pharmaceuticals industry keeps growing all over the world and the competition in pharmaceuticals market increases; public payers suffering from increasing health and pharmaceutical expenditures leads the social security institutions to face bottlenecks. Consequently, national and international pharmaceutical policies started to change, the role of generic pharmaceutical applications and activities in parallel trade become more significant and pricing and the reimbursement policies become even more important all over the world.
Similarly, in Turkey, from the public payer’s point of view, in parallel with the increase in health expenditures, expenditures on pharmaceuticals have an increasing trend as well and it reached nearly 22% of health care costs (Generic Drugs in Turkey, 2006). This increasing trend has resulted in an attempt to constraint budget, to take saving measures and put the pharmaceutical expenditures under control in recent years using two major instruments; reference pricing and generic drug utilization.
On the other hand, the increase in the generic drugs use made brand-name drug firms suffer. In Turkey the patent law is late and protects the drugs only after 1999. Therefore many drugs, which have patent protection in the world, already have
3
generics in Turkey from the beginning of their sales. Besides the late patent law, considering the increasing trend towards generic drugs, which are less costly for the payer, made the situation more difficult for original drug firms. The competition between brand-name drugs and generics play an important role for firms, aiming to pursue a profitable growth.
Under the influence of the pricing system, patients face extra co-pay in the pharmacies. Although most of the drug costs are afforded by the insurers, as a result of the current pricing system the brand-name drugs may cost the consumers an out-of-pocket amount, which is called as “extra co-pay”. What we observe in real life is that consumers with a branded-drug prescription are likely to substitute generics at the purchase moment at the pharmacy, in order to avoid the “extra co-pay”. Given the power of pharmacists to assist consumers in generic drug substitution in case of an out-of-pocket payment, interesting questions emerge such as how much the consumers do substitute, how important the price elasticity is and how the consumer choices can be modeled.
Reference pricing is the key part of the regulatory environment in the Turkish Pharmaceuticals market. In the scope of the reference pricing application, the originator product can take up to 100% of the reference price and for generic medicines the ceiling price is set at 80% of the reference price. Whereas the Reference price is determined according to the lowest ex-factory price of the brand-name product among the selected 5 EU-members reference countries. Below the reference price, companies are free to set their own price for each drug. As we know that some consumers are reluctant to pay out-of-pocket if the extra co-pay amount is
4
high and that they switch to generics, then there is a trade off for the firms between market share and price. Firms can keep the price high and so keep the marginal utility higher per product but lose sales units as a result of the extra co-pay for customers. How should the company set the price optimally? Should extra co-pay be kept for maximum revenue or should it be minimized? Considering the fact that patent losses will keep increasing in the following years and generic drug utilization is encouraged by government for cutting health expenditures, the importance of the question is better realized for the brand-name companies.
Although reference pricing and the reimbursement policy is subject to an important debate in Turkey since its introduction in 2004, no studies have dealt empirically with the impact of the pricing and reimbursement system on the Turkish drug market, the switching behavior, consumer choice or firm’s pricing strategy in terms of competition.
In this study, we try to fulfill this gap with the use of a simple application. We try to model the demand function of an example drug, Lipitor, which has “extra co-pay”, using the observations in the last years. We estimate the price elasticity and then solve the firm’s optimization problem which maximizes revenue subject to the firm’s only control variable, extra co-pay.
The rest of the thesis is organized as follows. In chapter 2 we provide general information in the Pharmaceutical Market both globally and in Turkey and the current Turkish pricing system. Chapter 3 reviews the related literature on
5
Pharmaceuticals Pricing and Reimbursement policies. Chapter 4 provides a detailed description of the data, followed by the modeling approach and empirical analysis in chapter 5 and chapter 6. Chapter 7 explains the findings of the analysis. Finally Chapter 8 contains a summary and the conclusion from our study.
6
CHAPTER 2
PHARMACEUTICALS MARKET
2.1. Global Pharmaceuticals Market
The pharmaceuticals having a net value of $800 billion globally is a continuously growing industry; however the growth rate declines in recent years and likely to continue declining in the following years as a result of changes in the market dynamics. Figure 1 shows the market size and growth between 2004 and 2008.
Source: IMS Health, Market Prognosis International, Sep 2007 $619 $735-745 $695-705 $663 $578 5-6% 6-7% 7% 7% 8% $0 $100 $200 $300 $400 $500 $600 $700 $800 2004 2005 2006 2007 2008 0% 1% 2% 3% 4% 5% 6% 7% 8% 9%
Total world B$ Growth
7
Of the World Pharmaceutical Market, North America and Europe account for 40.3% and 32% respectively. The rest of the market is Asia/Africa/Australia with 11.8%, Japan with 9.9% and Latin America with 6% market share1. On the other hand, the
contributions of the biggest Pharmaceutical markets, which are U.S. and Europe, to the growth of the global market declined from 68% in 2002 to 47% in 2008.2 Whereas the contributions of Japan and so-called “Pharmerging” markets which are China, India, Brazil, Russia, Mexico, Turkey and S. Korea to growth increase 32% to 50% (IMS Health, Market Prognosis, 2007). Being one of the still growing “Pharmerging” markets, Turkey becomes critically important in the global pharmaceutical market.
Main changes giving way to the market dynamics globally are; • the increase in genericization
• the increase in Patent losses
• the decrease in new product launches
• payers’ attempts to cut health expenditures through policy changes in terms of reimbursement and reference pricing
• new safety issues
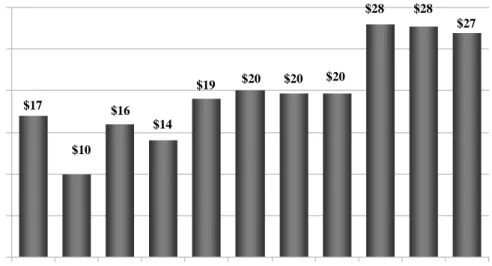
Figure 2 below presents the increase in patent losses from years 2002 to 2012. Generic drugs are emerging immediately after patent of the brand-name drug expires with a more economic price.
1 http://www.ieis.org.tr/
8
Source: IMS Health, MIDAS, New Market Segmentation, MAT Jun 2007
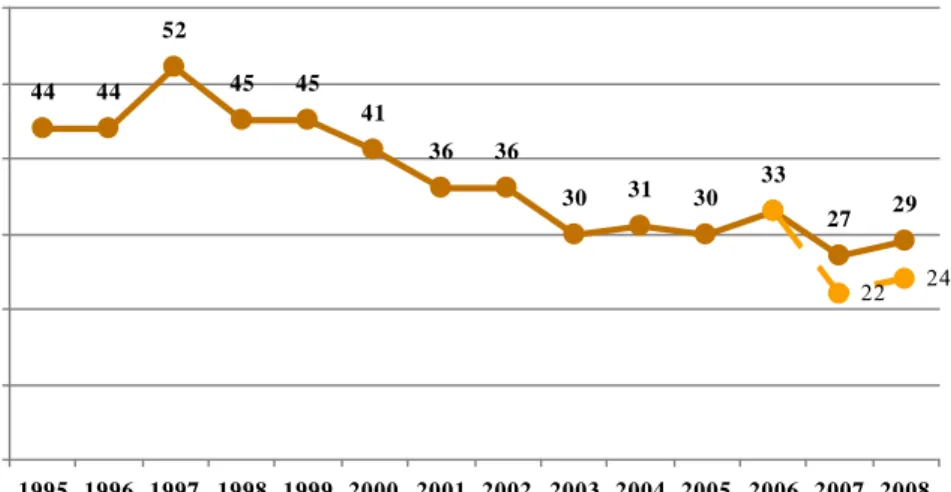
Besides, the patent losses are not compensated by new product launches. Figure 3 depicts the declination of the product launches. The reason why is that it gets harder to find a blockbuster molecule after billions of dollars clinical researches. Moreover payers now require better evidence for authorization of new products and for reimbursement due to the budget constraints. Therefore firms become more reluctant to spare money for discovering new products in this environment; instead they do invest in sales and marketing which makes competition more intense than before.
$27 $28 $28 $20 $20 $20 $19 $14 $16 $10 $17 0 5 10 15 20 25 30 2002 2003 2004 2005 2006 2007 2008 2009 2010 2011 2012 CO NS T A N T US $B
9
Source: IMS R&D Focus; Market Insights, Oct 2007
Another important change shaping the challenging market dynamics is that payers now require better evidence for authorization and reimbursement. A few examples from all over the world that it is now more difficult to convince government for new products are listed as follows;
• NICE refuses coverage for RA drug
• NICE refuses coverage of anti-dementia drugs for NHS patients with newly diagnosed mild Alzheimer’s
• Manufacturers in UK and France move to payment by results agreements for specific drugs where reimbursement is at issue
• CMS informs hospitals and physicians that future payment increases will be linked to improvements in clinical performance
44 44 52 45 45 41 36 36 30 31 30 33 27 29 22 24 0 10 20 30 40 50 60 1995 1996 1997 1998 1999 2000 2001 2002 2003 2004 2005 2006 2007 (f) 2008 (f) # o f ne w l a unc he s
10
• Continued expansion of reference pricing schemes in Germany, Italy and Spain demonstrate government is not differentiating value among therapy classes
Increasing safety issues are also an important change giving way to market dynamics globally.
2.2. Pharmaceuticals Market Turkey
Being one of Pharma emerging – so called “Pharmerging” markets, Turkey is a still growing and the 13th biggest Pharmaceuticals Market in the world.
The Turkish prescribed pharmaceutical market has reached 6,35 billion Euro and 1,38 billion units by volume in 2008. The growth rate of the market in terms of € is 2,2% and %5 by volume.3
Figure 4: The Size of Turkish Pharmaceutical Market after Foam
11
Figure 4 represents the real market size of Turkish Pharmaceuticals after discounts and free goods. Figure 5 shows the significant growth of the market between years 2001 to 2007 and the expected market size in 2012. The Turkish Pharmaceuticals is expected to be a 12 billion dollars market by 2012.
Figure 5: The Size and Growth of Turkish Pharmaceutical Market
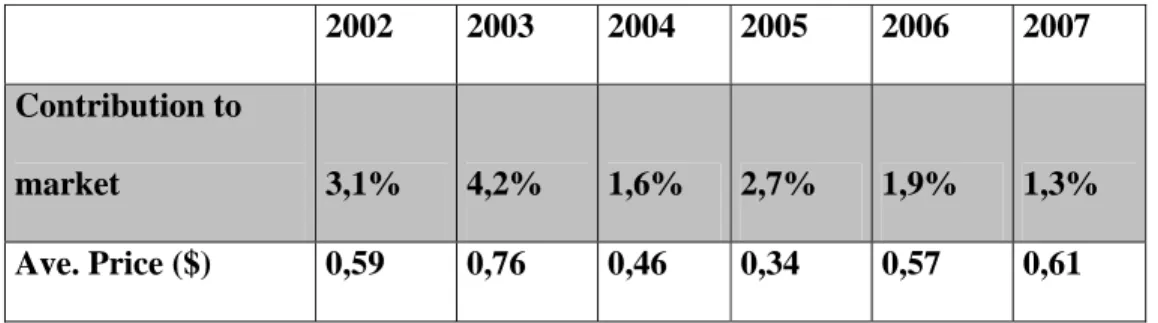
Similar to the trend worldwide, in this growing market in Turkey, new products constitute less in size. The number of new product launches and their declining contribution to the market are presented in Figure 6, Figure 7 and Table 1.
0 2.000 4.000 6.000 8.000 10.000 12.000 14.000 2001 2002 2003 2004 2005 2006 2007 2012 $ S ale s (M ) -20 -10 0 10 20 30 40 50 Gr ow th %
12 143 192 448 408 388 115 2002 2003 2004 2005 2006 2007 $176 $118 $128 $147 $78 $68 388 143 192 115 408 448 0 20 40 60 80 100 120 140 160 180 200 2002 2003 2004 2005 2006 2007 0 50 100 150 200 250 300 350 400 450 500 Figure 6: The Number of New Product Launches in Turkish Pharma Market
13
Table 1: Sales in Launch Year and Launch performance
2002 2003 2004 2005 2006 2007
Contribution to
market 3,1% 4,2% 1,6% 2,7% 1,9% 1,3%
Ave. Price ($) 0,59 0,76 0,46 0,34 0,57 0,61
Figure 8 and Table 2 are presenting the market in terms of generic and original drugs. 1,67 2,24 2,68 4,11 4,44 5,7 0,83 1,23 1,57 2,47 2,44 3,11 0 1 2 3 4 5 6 2002 2003 2004 2005 2006 2007 Sa le s $ B Original Generic
14
Table 2: Originals vs. Generics in the market in terms of value and Sales Unit
2002 2003 2004 2005 2006 2007
Original $ 67% 65% 63% 62% 65% 65%
Generic $ 33% 35% 37% 38% 35% 35%
Original SU 57% 56% 55% 54% 54% 54%
Generic SU 43% 44% 45% 46% 46% 46%
2.3. Pricing and Reimbursement Policies in Turkey
2.3.1. Basic Notions
Patent: Patent is a document that grants an inventor the right to exploit an invention for a given period of time. During this period the inventor has the right to produce, use and sell the invention without competition as the patent excludes others from making, using and selling the invention. In Turkey patent protection came into force in 1999. With the patent law, the products are covered with patent for 20 years. For products launched before 1999 in Turkish Pharmaceuticals Market, there exists no patent production.
Reference Drug: “A reference drug is the product that is licensed and marketed for the first time in the world”.4 “Branded drug” or “original product” can also be used
instead of “reference drug”. World Depending on a number of considerations, a company may apply for and be granted a patent for the drug, or the process of producing the drug, granting exclusivity rights typically for about 20 years.
15
However, only after rigorous study and testing, which takes 10 to 15 years on average, will governmental authorities grant permission for the company to market and sell the drug. Patent protection enables the owner of the patent to recover the costs of research and development through high profit margins for the branded drug.
Generic Drug: It is an equivalent of the reference drug. A generic drug is a drug which is produced and distributed without patent protection. The generic drug may still have a patent on the formulation but not on the active ingredient. It contains the same active substance with the reference product and is marketed after the extension of the protection period. When the patent protection for the drug expires, a generic drug is usually developed and sold by a competing company. It provides the same quality, safety and efficacy as the reference product, yet is more economically priced. Generic products do not repeat the pre-clinical tests and clinical trials performed by the reference drug producer. Instead, they do bioequivalence tests. Since generics do not repeat the pre-clinical and clinical tests, they are more economically priced than the reference products. In other words, the development and approval of generics is less expensive, allowing them to be sold at a lower price. Often the owner of the branded drug will introduce a generic version before the patent expires in order to get a head start in the generic market. A generic must contain the same active ingredients as the original formulation. Generics are identical in dose, strength, route of administration, safety, efficacy, and intended use. In most cases, generic products are available once the patent protections afforded to the original developer have expired. When generic products become available, the market competition often leads to substantially lower prices for both the original brand name product and the generic forms. The time it takes a generic drug to appear
16
on the market varies. In Turkey and in US, drug patents give twenty years of protection, but they are applied for before clinical trials begin, so the effective life of a drug patent tends to be between seven and twelve years.
2.3.2. Pricing
Reference price: The reference price of a licensed brand-name drug is the minimum of discounts excluded manufacturer’s prices (lowest ex-factory price); among the reference countries and the countries that the branded drug is produced and imported.
Reference countries: The reference countries are 5 EU member countries, France, Italy, Portugal, Spain and Greece until the end of 2007 and 2008, but the reference countries may change and the number of reference countries may increase up to 10, provided that prior notification is given before 4 months.
Pharmaceutical Pricing: The retail prices of pharmaceuticals are calculated by adding %8 VAT and the wholesaler and pharmacist mark-ups to the ex-factory price.
17
Table 3: Pricing of Pharmaceuticals; Original and Generic Products
Original Products Reference Price
+
Wholesaler and pharmacist mark-up + 8% VAT Generic Products 80% of the Reference Price
+
Wholesaler and pharmacist mark-up
+ 8% VAT
Table 4: Wholesaler and Pharmacist Mark-ups
of the wholesaler
sales price Wholesaler (%) Pharmacist (%)
Up to YTL 10 9 25
YTL 10 – 50 8 25
YTL 51 – 100 7 25
YTL 101 – 200 4 16
18
The General Directorate of Pharmaceuticals and Pharmacies (IEGM), which is part of the Ministry of Health, regulates and controls the Pharmaceutical prices in Turkey. “In the framework of the decree on the pricing of medicinal products for human use dated 30.06.2007 and numbered 2007/12325, the reference price of an original product is determined according to the lowest ex-factory price among 5 EU member countries which are France, Spain, Italy, Portugal and Greece until the end of 2007 and 2008, but the reference countries may change and the number of reference countries may increase up to 10, provided that prior notification is given before 4 months”.5 The prices of brand and generic drugs are determined by “the reference pricing method” and published in the IEGM web page. and stand for an explanation of the pricing system in the Turkish regulatory environment based on the reference price. According to the reference pricing, the price of a brand-name drug is allowed to be less than or equal to 100% of the reference price, whereas the price of a generic is allowed to be less than or equal to 80% of the reference price. For products more than twenty years old, reference pricing method is not applied. Below the ceiling price determined by the reference pricing, companies are free to determine the price of their own products.
2.3.3. Reimbursement Policy Turkey
In its broadest meaning, reimbursement is the payment of the whole or some part of the price of medical product or health care to the person/patient or to the institution that provided the service by insurance institution.
19
Within the framework of social security reform, a range of reimbursement policies have been followed since 2004. The Ministry of Labour and Social Security have been working on a new structure for the social security and the general health insurance system covering the whole population since 2004. Until May 2006, Turkey's social security system comprised three separate institutions which were Bağ-Kur, for self-employed workers and farmers; SSK, for private and public sector workers and Emekli Sandigi (ES) for the civil servants. For more than ten years, the system has been running deficits in spite of the very favorable demographics. These deficits have required increasingly large transfers from the general government budget, prompting several reform attempts. As a result, in the context of Social Security Reform, three public social security institutions were united under a new single body (Social Security Institution) in the second half of 2006.
Discussions on Social Security Reform are still going on. Two decrees on reimbursement for different layers of the population entered into force on 15 June 2007. Two positive lists, one covering green card holders, civil servants, military staff and the other covering self-employed workers and farmers, private and public sector workers and retired civil servants entered into force on 22 June 2007.
The reimbursement system is governed by the Reimbursement Commission, which is formed by officials representing the Ministry of Health, Ministry of Finance and Social Security Institution.
In the scope of reimbursement, medicines are reimbursed up to %22 above the cheapest medicine in the generic medicine list. Generic medicine concept started
20
with 77 active materials in 2005 and this number was expanded to 333 within the year. This number has reached 425 in 2008.6
Pharmacy discount rates in public medicine purchasing are determined by taking into account pharmacy sales revenue (VAT excluded). See Table 5 for pharmacist discount rates in regards to sales revenue. Table 6 presents importer and manufacturer discount rates.
Table 5:Pharmacist Discounts
Pharmacist discount related to annual sales revenue 2007 (VAT excluded)
%
Pharmacies up to 350.000 TL % 0
Pharmacies between 350.000 TL – 600.000 TL % 1,0 Pharmacies between 600.000 TL – 900.000 TL % 1,5
Pharmacies over than 900.000 TL % 2,5
Table 6: Importer and manufacturer discount rates
For generic and reference products over 6 year from
registration date % 11,0
For reference products less than 6 year from registration
date % 4,0
Extra Co-Pay: As the medicines are reimbursed up to 22% above the cheapest medicine in the generic medicine list, a drug is fully reimbursed only if the price is
21
less than the band which equals 1,22 times the price of the cheapest generic. If the price of a drug is not inside the reimbursement band of 22%, the excess amount over the band is paid by patients out of pocket, which is what we call “extra co-pay”. This is called “band system of 22%”.
The patients generally pay a 20% or a 10% of the price of the medicine out of pocket depending on their health insurance type (Emekli Sandığı, SSK or Bağ-kur). When the price of a drug is greater than the price that is reimbursed by SGK which was calculated through reference pricing method, the incremental part is paid directly by the patients. The amount that the patient pays over the natural 10% or 20% co-pay is what we call “extra co-pay”.
Switch in the Pharmacy: Regardless of the doctor’s recommendation and the medicine on the prescription, in Turkey pharmacist has the right to switch the medicine on a prescription with any of the generics. Therefore the patient can choose to buy a generic drug if he/she chooses not to pay extra co-pay. He has an alternative. In Turkey generic drugs usage is encouraged also by government due to economic reasons. In addition generics are usually more profitable for the pharmacists as they generally apply free goods and trade discounts. These are also some factors that make pharmacists tend to switch the original drug on a prescription to a more profitable generic.
22
CHAPTER 3
RELATED LITERATURE
There is a dense literature in pharmaceuticals economics examining the pharmaceutical pricing and the reimbursement policies globally. However, very few studies focus empirically on the impact of reference pricing on the drug market or switching behavior.
An example is Docteur et al (2008). She studied pharmaceutical pricing policies in the global market and presented information about pharmaceutical industry in terms of drug prices and government policies. Similarly, Vogler et al (2009) presented relevant pharmaceutical pricing and reimbursement information in a comparative analysis for twenty eight countries and also described the Spanish pricing and reimbursement system in details.
Strategic Overview of Pharmaceutical Pricing and Reimbursement in the Major Markets (2009) is another study on the performance of branded drugs under the influence of changes in the healthcare systems and the growing role of payers in some major markets; United States, France, Germany, Italy, Spain, United Kingdom and Japan. While economic concerns are prompting waves of changes and payers are increasingly balking at healthcare costs and seeking ways to contain expenditures.
23
The article is a talk on the major market authorities deploying various reforms and policies in different ways due to cost-consciousness in common. In parallel with the other literature, it is also underlined that the use of lower priced generics is a well-established cost-containment measure. The ways that countries are prompting increased use of generics and the effects of generics on the sales of branded pharmaceuticals are explained in detail for seven major markets. Moreover, in such a cost-conscious environment, the article gives information about the key pricing trends in the major markets and the ways to set and adjust prices, the strategies of healthcare authorities and pharmaceutical companies use in pricing negotiations.
Pharmaceutical Pricing and Reimbursement in China (2009) is a similar study on Chinese pharmaceutical market which is said to become the third largest in the world in 2011 with a growth rate of more than 20% per year. A radical healthcare reform package recently unveiled by the government that will more than double public healthcare expenditures from 2009 to 2011. The paper highlights that the performance of biopharmaceutical companies competing in China will significantly depend on the clear understanding of the implications of these reforms. The article is elaborating the most important government sponsored public health insurance programs comparatively and the role of hospitals as the most dominant distribution channel for prescription drugs in China. According to the paper, prices for international branded drugs in China are generally comparable to prices in some European markets. Chinese prices are compared to U.S. prices as a part of the study. The article gives a debate on the future pharmaceuticals applications. For example a drug’s reimbursement prospects are likely to depend heavily on inclusion in a new national essential medicines list in the future. The paper talks on how extensive will
24
the list likely to be and how will the healthcare system procure and use drugs on this list.
Different than the above literature, Custom Decision Support, Inc. (2004) is a study on pharmaceutical pricing and it approaches the pricing problem from the firm’s point of view which has the goal of maximizing the long-term earnings. The main motivation of this paper also is the increase in the healthcare costs which is much faster than the economy in general and as a result of this growth healthcare insurers being increasingly aggressive in curtailing costs. Considering this trend the regulators and the Government are likely to get involved sooner or later. This made the optimum pricing policies of firms more important. The existence of competitors, multiple products and segments makes the firm’s optimization problem complex. The study tries to understand the likely impact of market changes and to provide some type of “optimum” pricing policy. The core issue for obtaining an analytical view of pricing was of course customer demand. The reason why it is a problem to find the answer of the question of how much of a product would the “customer” purchase against a set of competing products at various prices, is in pharmaceuticals there are several individuals involved in the specification, selection, use, and payment of the product. In order to handle this difficulty, various purchase processes are divided into three groups; direct purchases (i.e. the drugs not covered by the insurers), hospital purchases, and outpatient purchases (i.e. obtaining ethical drugs by patients and paid by an insurer with co-pay by the patient). For each, a different model with different measures of customer demand is needed. For the simplest case, direct purchases, only focus is on customer. For outpatient purchases, it is needed to capture the competitive price sensitivity of the decision makers in setting the
25
formulary and on co-pay structure, sensitivity of the physicians to the formulary ranking and co-pay structure, and finally the co-pay price sensitivity of the patients.
Instead of a linear form, an S-shaped demand curve is used to estimate the optimum prices which depend on the knowledge of product price sensitivity that is, how market share or sales volume depend on price and the firm’s problem is solved accordingly for direct purchases. The study also gives a general idea and lists the main principles for optimum pricing policy for firms.
Stargardt (2009) studied the impact of reference pricing in switching behavior in the German statin market empirically. Monitoring the patients with prescriptions for statins for one year long after the inclusion of reference pricing, in January 2005, he investigated the effect of the policy change on the patients’ choices on different drugs under the influence of additional co-payments. He employed a logistic regression model to measure the effect on the patient’s choice. He found that the predicted probability to switch from atorvastatin to another statin was 0.88 for the average patient, patients from all income groups were clearly affected by the policy change.
Rizzo and Zeckhauser (2009) employed a logarithmic regression model to examine how the mix of consumer choices between generic and brand-name drugs might affect the average price of those brand-name drugs that are purchased which is an area that the prior literature was silent. The motivation of the study is also the increasing pharmaceuticals expenditure in recent decades and the rise in generic drug utilization (i.e. from 19% of scripts in 1984 to 47% in 2001, thus compensating
26
the growth in health expenditures through significant direct dollar savings. Using a nationally representative panel of data on drug utilization and costs for the years 1996-2001, he found that higher share of an individual’s prescriptions filled by generics results a lower average brand-name price to consumers, because consumers are more likely to substitute generics when brand-name drugs would cost them more. The substantial effect is that a 10% increase in consumer’s generic script share is associated with a 15.6% decline in the average price paid for brand-name drugs by consumers. Although the prior work indicated that brand-name producers do not lower their prices in the face of generic competition, the firms lower prices as a result of consumer choices valuing the cost savings from generic purchases more than any perceived quality premiums offered by brand-name drugs.
Reference pricing and the reimbursement policy is subject to an important debate also in Turkey since its introduction in 2004. Surprisingly no studies have dealt empirically with the impact of the pricing and reimbursement system on the Turkish drug market, consumer choice and the switching behavior or firm’s pricing strategy in terms of competition. This thesis tries to fulfill this gap.
27 CHAPTER 4
DATA
In order to investigate the optimal price for a branded drug in the Turkish pharmaceutical market under the existence of an “extra co-pay” possibility for the patient, we employ a national data set of a cholesterol reducing drug, Lipitor. The reason of choosing Lipitor in the analysis is mainly based on the fact that the brand suffers from intensive generic competition (i.e. 14) and high extra co-pay amounts (i.e. going up to 11 TL), both of which makes Lipitor possibly one of the best candidates for being switched for generic drugs.
Lipitor, a blockbuster cholesterol-lowering medication marketed by Pfizer, is the largest-selling drug in the world with 2006 sales of US$12.9 billion. With annual sales of ~$13 billion, it sells more than twice as much as its closest competitor. In Turkey, Lipitor sells ~70 million TL annually under intense generic competition different than the world7. Lipitor has been introduced in the Turkish market under 8
different forms: combinations of 4 types of dosages (i.e. 10, 20, 40 and 80 milligrams) and 2 types of tablet numbers (30 and 90).
28
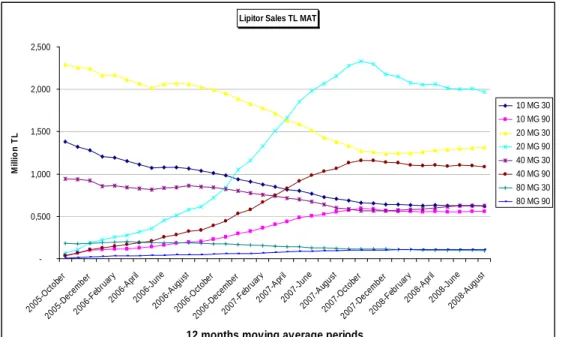
The data set includes monthly information on sales of all forms of Atorvastatin molecules (Lipitor and all its generic competitors) for the period September, 2005-July, 2009, a total of 47 observations. Figure 9 depicts unit sales for different drug forms. Reflecting sales in MAT, using a moving average of twelve months period of sales, enabled us to eliminate fluctuations and see the trend better.
Lipitor Sales TL MAT
-0,500 1,000 1,500 2,000 2,500 200 5-Oct obe r 20 05-Dec emb er 2006 -Feb ruar y 200 6-Ap ril 20 06-June 20 06-Augu st 200 6-O ctob er 200 6-De cem ber 2007 -Feb ruar y 200 7-Ap ril 20 07-June 2007 -Au gust 200 7-O ctob er 200 7-D ece mbe r 2008 -Feb ruar y 200 8-Ap ril 200 8-Jun e 200 8-Au gust
12 months moving average periods
M il li on TL 10 MG 30 10 MG 90 20 MG 30 20 MG 90 40 MG 30 40 MG 90 80 MG 30 80 MG 90
Figure 9: Lipitor Sales (TL) from 2005 to 2009(MAT)
The source of the sales data set is IMS, which is a global company functioning in more than 100 countries and provides reliable data about Pharmaceutical Market. The IMS sales data audit, Turkey Pharmaceutical Index (TPI) is the definitive measure of ethical product sales from the wholesalers to the retail pharmacies in
29
Turkey. IMS covers 99% of the pharmacies in Turkish Market and presents the most accurate daily data in company, brand and form detail.
Atorvastatin market size changes from a month to another and grows in time, as shown in Figure 10. The change in the market size may lead misreading the performance of drugs. Moreover different tablet forms tend to follow different trends, for example 90 tab forms tend to grow whereas 30 tab forms tend to lessen in time8
Atorvastatin Market Size TL
0,00 5.000.000,00 10.000.000,00 15.000.000,00 20.000.000,00 25.000.000,00 30.000.000,00 35.000.000,00 2005 -Sept embe r 2005 -Dec em ber 2006 -Mar ch 2006 -Jun e 2006 -Sept embe r 2006 -Dec em ber 2007 -Mar ch 2007 -Jun e 2007 -Sept embe r 2007 -Dec em ber 2008 -Mar ch 2008 -June 2008 -Sept embe r 2008 -De cem ber 2009 -Mar ch 2009 -June Period Pr oj ec te d T L Projected TL Projected TL MAT
Figure 10: Atorvastatin Market Size (TL) from 2005 to 2009(MAT)
An important part of our data set is the “extra co-pay” of Lipitor, which is the amount that the patients afford out of pocket, for the portion which is over the
30
reimbursed price. For 8 forms of Lipitor, we use the extra co-pay amounts at each month from September 2005 to July 2009. The amount of extra co-pay may change with the arrival of a new generic in the market or when the price of the cheapest generic changes. The changes in the band system, price changes in the reference countries or in the reimbursement policy of the government or the company’s decision to keep or decrease extra co-pay may reason with a change in the amount of extra co-pay. When a new generic arrive at the market, the extra co-pay amount rises as the price of the cheapest generic decrease (The reimbursed amount was 122% of the cheapest generic). Then tracking the sales of the product, at some point the firm may decide to lower or zero it and increase sales unit; or may decide to keep the additional co-pay. In the timeline we work on, the extra co-pay amount may vary or remain unchanged from one period to another.
The extra co-pay amounts are calculated according to the drug prices which are all available in the web site of Ministry of Health. Using the current band system information and the price of the cheapest generic at period t, extra co-pay amounts are calculated. If the extra co-pay amount has changed in a month once or more, we calculated the average for that month.
The market share of the product is undoubtedly related with the number of competitors in the market. Thus, the “Number of generics” in a period of sales is also included in our data set. In the time period we model, the number of generics increased from 5 to 14. The data of the “number of generics” are also based on IMS sales. Similar to the “extra co-pay”, we calculated the presence of a generic in the market in a month on average in case the generic comes out inside the month.
31
There are, of course, many other factors that may affect the market share of a drug. The price, the campaigns, the competitor moves, performance of the molecule, technologic improvements, health sector dynamics, reimbursement policies, changes in the field force are only a few of these. There should be no missing variable bias to estimate the demand curve of Lipitor and the data set should be sufficient to explain our dependent variable “Market Share”. On the other hand employing excess independent variables may complicate the model.
Of these, sales campaigns are another factor that may affect the performance of a drug. We also investigated the campaigns in the Atorvastatin market. Hence, the monthly campaigns are not widely applicable in this market. Instead the campaigns such as given free goods are generally like constant sales terms of competitors so that sales do not deviate from one month to another under the influence of campaigns. Lipitor also does not make sales campaign nor gives free goods; instead it applies a constant standard sales term. That is why we did not employ sales campaigns in the model.
Advertising may be treated as another factor on the performance of a drug in the world, yet it is not allowed in Turkey. Drugs are marketed only through detailing to doctors in Turkey. Therefore the “field force”, the number of sales agents studying Lipitor in the field, is also included to our data set to investigate the effect of the detailing on sales performance. Hence, we saw that “field force” is not a significant factor in the performance of Lipitor in terms of market share. Yet, it is significant when we take the dependent variable as “sales unit”. It can be interpreted that for
32
Lipitor, the changes in the field force may take place in parallel with the changes in the market size. Plus, the changes in the field force may be parallel with the field forces of competitors. So, these parallel changes may offset each other as we study the effects on “Market Share”. That’s why we do not employ field force to our model.
To sum up, we employed a set of data to understand the behavior of the market share of Lipitor with respect to the changes in two important factors; “extra co-pay” which is the amount afforded by patients out of pocket and “the number of generics” in the market. See APPENDIX 2 for summary statistics.
33
CHAPTER 5
MODELING FRAMEWORK
Our study first employed a multiple linear regression model with two independent variables. Market Share, MS, is the dependent variable, whereas extra co-pay, the number of generics in the market, X1 and X2 are the explanatory variables. The term,
ε, is a random disturbance, which is assumed to be normally distributed with zero mean and constant variance.
Demand equation Æ MS =β0 + β1*X1 + β2*X2 +…+ ε 9 The observed values of market share are;
msi,j =β0 + β1*x1,i,,j + β2*x2,i,j +…+ εi,j
As the dependent variable, we used “Market Share” instead of “Unit Sales” in order to eliminate the effect of the changes regarding the market trends. Using the monthly
IMS unit sales of all Atorvastatin molecules; the “monthly unit market share of Lipitor” is calculated for the observation period, from September 2005 to June 2009.
9 The dependent variable, Market Share, changes between 0 and 1 whereas the independent variables take values between 0 and ∞. Mathematically the function for market share could be mapped into another function whose range is also between 0 and ∞. But here in our study that transformation would not affect our model results with the current data set.
34
Using the sales unit of Lipitor and all other generics in Atorvastatin market, the monthly unit market share of Lipitor is defined as follows;
MSi,j,t=Lipitor SUi,j,t / ∑ Atorvastatin SUi,j,t Æ i forms, j milligrams, at period t.
Instead of daily frequency, using a monthly frequency in the model enabled us to see the most accurate results as the targets of the field force in the Pharmaceuticals industry are given on a monthly base. The sales may vary from day to day for various reasons. For example on Saturdays the sales are approximately one forth of weekdays and on Saturdays there is no considerable sale. Monthly frequency gives the best idea on the performance of a product in the Pharmaceutical Market. In other words, using a monthly frequency saved the model from high frequency problems.
The three independent variables which we employ in our model are the “monthly extra co-pay on average” and the “monthly number of generics on average in the market”.
Before employing a multiple linear regression model, we have to question our data set in terms of the validity of the assumptions the Classical Linear Regression Model, which depend heavily on the assumption of independence. According to those, the model searches for a linear relationship with a number of observations which we know that has a full rank. We also assume the exogeneity of the regressors and the exogenous data generation. It is also necessary to show the disturbance is homoscedastic and nonautocorrelated before using a multiple linear regression model.
35
See Appendix 3 for the assumptions of the Classical Linear Regression Model.
5.1. Assumptions regarding Demand and Supply Curves
In this thesis we mainly try to estimate the demand curve depicting the relationship between the price of a certain product and the amount of it that consumers are willing and able to purchase at that given price. In microeconomic theory, demand is defined as the willingness and ability of a consumer to purchase a given product in a given frame of time.
The demand curve for all consumers together is composed of the aggregation of demand curve of every individual consumer: the individual demands at each price are added together. Some consumers are ready to pay the extra co-pay whereas some prefer to substitute to generics.
Main assumptions that this thesis is based on regarding the demand and supply curves are as follows:
¾ Our observations at each period are on the demand curve ¾ The observations are not necessarily on the equilibrium levels ¾ Demand curve does not shift in the time period we study ¾ Supply curve is perfectly elastic
¾ There exist no shifts in supply in the time period we study
The reasons for the above assumptions depend heavily on the market dynamics that we observe. First of all we assume that when the extra co-pay amount changes the quantity demanded changes accordingly through a movement along the demand curve. From the point of microeconomics it is important to distinguish between
36
movement along the demand curve, and a shift in the demand curve. A shift would result in a new demand curve. The reason why we assume that no shift takes place in the demand curve is that there is no change in the relationship between quantity and price that is brought about by a change in any of the factors influencing demand except price. The main factors that may shift the demand curve which we assume to remain unchanged for our observation time period are the income level of the patients, the treatment preferences, the penetration of cholesterol disease, the prices of substitutes and complements, changes in population etc.
Another assumption is that the observations each period, price and market share pairs are on the demand curve depicting the changes in the choices of patients under the influence of out of pocket extra co-payment levels. As we want to find the optimum price for the firm which maximizes the revenue, the observations are not necessarily on the equilibrium levels, but points move along the demand curve.
A change in supply also affects the price and quantity of the product. It is also assumed that there is no shift in supply curve. The factors that would shift the supply curve are mainly the rises (or falls) in the prices of productive resources, changes in technology, changes in cost of production, etc. In this thesis the changes in these factors are assumed to be negligible. The efficiency improvements may take place since 2005; however these improvements in production costs are calculated not to be significant in shifting supply curve for our analysis.
Another assumption in this model is that supply is perfectly elastic that the firm produces the demanded amount of products at each price level that the supply curve is a horizontal line. The changes in extra co-pay do not affect the firms’ production
37
decisions; instead firms meet the demand at each price level. Perfectly elastic supply occurs, in theory, when sellers are able to switch resources among a large number of perfect substitutes-in-production.
Through our study we fare forth with these assumptions which are undoubtedly subject to discussion. Considering the market dynamics and observations in real life regarding firms and patients the assumptions seem rational. We leave the study of challenging each assumption for future work.
5.2 Heteroscedasticity and Autocorrelation Tests
The interpretation of the results of a classical regression analysis, depend heavily on the homoscedasticity and nonautocorrelation of the disturbances. Thus, heteroscedasticity and autocorrelation tests are applied to ensure the efficiency of the OLS estimator. Moreover, it is necessary to make sure the response and the predictor variables are stationary and do not have a trend. For that we applied the Unit Root Tests.
We mainly analyzed the residual plots, checked the correlation matrix between the predictor variables and performed the necessary autocorrelation, heteroscedasticity and unit root tests in order to investigate if there is a trend in the data or relation between disturbances. See Appendix 1 for Plot of Residuals to detect the existence of heteroscedasticity and autocorrelation.
38
First of all, to investigate a possible multicollinearity, we check the correlation between two explanatory variables. If there were a model specification error, an omitted variable bias, the independent variables would move parallel under the influence of another significant but missing variable. Here in the Table 7 below, the correlation between predictor variables are available.
Table 7: Correlation between independent variables
Correlation between Price and # Generics
MS 10 MG 30 76% MS 20 MG 30 15% MS 40 MG 30 51% MS 80 MG 30 51% MS 10 MG 90 -43% MS 20 MG 90 29% MS 40 MG 90 -27% MS 80 MG 90 22%
Except for one form, 10 mg 30 tablets, low correlation coefficients indicate that the independent variables do not behave parallel, which is an evidence that there is no spurious regression in general.
5.2.1 Testing for Autocorrelation
As we are working with a time series data with a monthly frequency, we have to make sure that the residuals are not autocorrelated. Autocorrelated residuals can lead to inefficient estimates, which mean that minimum variance assumption is not attained.
39
Durbin-Watson test: Besides the examination of the plot of residuals, one approach that is frequently used to determine if serial correlation is present is the Durbin-Watson test. It is the first formal procedure developed for testing for autocorrelation using the least squares residuals. The Durbin-Watson test looks directly at the first order autocorrelation of the residuals. High R2, t-values, F-value and a low D-W statistics might be a clue for the existence of an autocorrelation in the model data.
The autocorrelation parameter is ρ, εt = ρ.εt-1 + vt.
For positive autocorrelation, the hypotheses to be tested are; H0= ρ = 0 Æ there is no positive autocorrelation
H1= ρ > 0 Æ there is positive autocorrelation
Whereas; for negative autocorrelation, the hypotheses to be tested are; H0= ρ = 0 Æ there is no negative autocorrelation
H1= ρ < 0 Æ there is negative autocorrelation
The result of the Durbin-Watson test for both positive and negative serial autocorrelation is as follows;
40
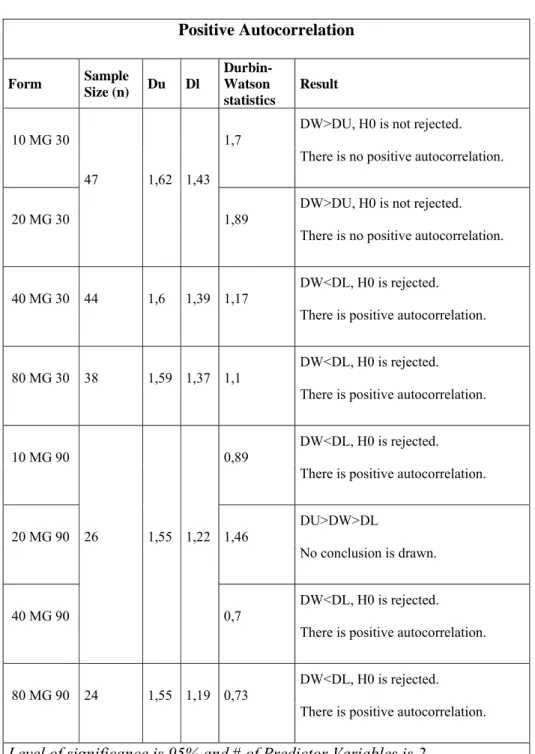
Table 8: Results for testing Positive Autocorrelation
Positive Autocorrelation Form Sample Size (n) Du Dl Durbin-Watson statistics Result 10 MG 30 47 1,62 1,43 1,7
DW>DU, H0 is not rejected. There is no positive autocorrelation.
20 MG 30 1,89 DW>DU, H0 is not rejected. There is no positive autocorrelation.
40 MG 30 44 1,6 1,39 1,17 DW<DL, H0 is rejected. There is positive autocorrelation.
80 MG 30 38 1,59 1,37 1,1
DW<DL, H0 is rejected. There is positive autocorrelation.
10 MG 90
26 1,55 1,22
0,89 DW<DL, H0 is rejected. There is positive autocorrelation.
20 MG 90 1,46 DU>DW>DL
No conclusion is drawn.
40 MG 90 0,7
DW<DL, H0 is rejected. There is positive autocorrelation.
80 MG 90 24 1,55 1,19 0,73 DW<DL, H0 is rejected. There is positive autocorrelation. Level of significance is 95% and # of Predictor Variables is 2.
41
Table 9: Results for Testing Negative Autocorrelation
Negative Auto Correlation
Form Sample Size (n) 4 - Dl 4 - Du Durbin-Watson statistics Result 10 MG 30 47 2,57 2,38
1,7 DW<4-DU, H0 is not rejected. No negative autocorrelation.
20 MG 30 1,89 DW<4-DU, H0 is not rejected. No negative autocorrelation.
40 MG 30 1,41
DW<4-DU, H0 is not rejected. No negative autocorrelation.
80 MG 30 38 2,63 2,41 1,1 DW<4-DU, H0 is not rejected. No negative autocorrelation.
10 MG 90
26 2,78 2,45
0,89 DW<4-DU, H0 is not rejected. No negative autocorrelation.
20 MG 90 1,25
DW<4-DU, H0 is not rejected. No negative autocorrelation.
40 MG 90 0,7 DW<4-DU, H0 is not rejected.
No negative autocorrelation.
80 MG 90 24 2,81 2,45 0,73 DW<4-DU, H0 is not rejected. No negative autocorrelation. Level of significance is 95% and # of Predictor Variables is 2.
42
According to D-W test, four forms of Lipitor, 80mg 30 tabs, 10mg 90 tabs, 40mg 90 tabs and 80mg 90 tabs, are positively autocorrelated which means the usual multiple linear regression assumptions do not hold, whereas for the other four forms as we have no evidence. Thus for the forms that the disturbances are detected to be autocorrelated, Newey-West estimator should be used to estimate the parameters. See Appendix 2 for Plot of Residuals of each form of Lipitor.
5.2.2 Testing for Heteroscedasticity
To employ a multiple linear regression model, it is also compulsory to test if the variance of the disturbances, σ2, is constant. In a regression framework, heteroscedasticity occurs if the variance of the error term, ε, is not constant across observations.
White’s General Test: A simple operational version of the White’s Test is carried out by obtaining n.R2 in the regression of e
i2 on a constant, all unique independent
variables and all the squares and cross products of the independent variables. The statistic is asymptotically distributed as chi-square with P-1 degrees of freedom where P is the number of regressors in the equation, including the constant. The hypotheses are of the form;
H0 : σi2 = σ2 for all i,
H1 : Not H0.
For testing heteroscedasticity through White’s General Test, ordinary least squares residuals are regressed on a constant, P (extra co-pay), G (# of generics), P2, G2 and
43
P*G for each form of Lipitor. Using the results of the regression, White’s test statistics is calculated. The results of the White’s test are as follows;
Table 10: Results of White’s Heteroscedasticity Test Heteroscedasticity Form R2 Sample Size (n) White's Test (n*R2) Critical Value of Chi-Squared Result 10 MG 30 14,647% 47 6,884 5,99 Hypothesis of homoscedasticity is rejected. 20 MG 30 7,509% 47 3,529 5,99 Hypothesis of homoscedasticity is NOT rejected. 40 MG 30 15,583% 44 6,856 5,99 Hypothesis of homoscedasticity is rejected. 80 MG 30 7,836% 38 2,978 5,99 Hypothesis of homoscedasticity is NOT rejected. 10 MG 90 6,961% 26 1,810 5,99 Hypothesis of homoscedasticity is NOT rejected. 20 MG 90 33,401% 23 7,682 5,99 Hypothesis of homoscedasticity is rejected. 40 MG 90 46,277% 26 12,032 5,99 Hypothesis of homoscedasticity is rejected. 80 MG 90 24,119% 24 5,789 5,99 Hypothesis of homoscedasticity is NOT rejected. Level of significance is 95% and Degrees of Freedom (k-1) is 2.
44
According to White’s Test, four forms which are 20 mg 30 tablets, 80 mg 30 tablets, 10 mg 90 tablets and 80 mg 30 tablets are said to be homoscedastic. The results of the White’s Test are consistent with our previous findings on the plot of residuals.
In the presence of heteroscedasticity, the least squares estimator is still unbiased, consistent and asymptotically normally distributed. However, OLS is inefficient with certainty which is usually unknown, only then the OLS estimator is undesirable; we should use generalized least squares instead. If the heteroscedasticity is not correlated with the variables in the model, then at least in large samples, the ordinary least squares computations, although not the optimal way to use the data, will not be misleading. Thus, we have to use White heteroscedasticity consistent estimator where we have heteroscedasticity. See Appendix 2 for the Plot of Residuals.
Table 11: Summary of Autocorrelation and Heteroscedasticity Tests
Lipitor Forms
Sample
Size Disturbances Estimator
10 mg 30 tab 47 H/SC White Heteroskedasticity-Consistent Estimator
20 mg 30 tab 47 - Classical Linear Regression 40 mg 30 tab 44 H/SC&A/C Newey-West Estimator 80 mg 30 tab 38 A/C Newey-West Estimator 10 mg 90 tab 26 A/C Newey-West Estimator 20 mg 90 tab 23 - Classical Linear Regression 40 mg 90 tab 26 H/SC&A/C Newey-West Estimator 80 mg 90 tab 24 A/C Newey-West Estimator
45
To sum up, the presence of autocorrelation and heteroscedasticity makes classical linear regression model non-applicable to the data. However using Newey West estimator where we have autocorrelation and using White estimator where we have heteroscedasticty will be appropriate.
5.3. Unit Root Tests:
The purpose of unit root tests is to determine whether the time series is stationary or not. A unit root test tests whether a time series variable is non-stationary using an autoregressive model. The most famous test is the Dickey–Fuller test.
Augmented Dickey–Fuller test:
In the Dickey-Fuller test, the existence of a unit root is tested. The null hypothesis claims that there is no unit root, the data is stationary. For five forms which are 40 mg 30 tablets, 80 mg 30 tablets, 10 mg 90 tablets, 20 mg 90 tablets and 40 mg 90 tablets we cannot reject the null hypothesis that is a unit root exists. For the other forms, 10 mg 30 tablet, 20 mg 30 tablets and 80 mg 90 tablets we reject the existence of a unit root at 10% significance level.
The Augmented Dickey-Fuller test statistics are below zero for all forms and the probabilities are no greater than 50%, which can be interpreted as non-stationarity is not strong for any form.
46
Table 12: Unit Root Test Results
Form Augmented Dickey-Fuller test statistic
Test critical values Probability Result
1% level 5% level 10% level
10 mg 30 tab -2,683337 -3,58474 -2,92814 -2,60223 0,068 Stationary 20 mg 30 tab -2,622274 -3,58474 -2,92814 -2,60223 0,0827 Stationary 40 mg 30 tab -2,426483 -3,58115 -2,92662 -2,60142 0,1403 Non-stationary 80 mg 30 tab -1,926221 -3,62678 -2,94584 -2,61153 0,317 Non-stationary 10 mg 90 tab -1,661712 -3,72407 -2,98623 -2,6326 0,4376 Non-stationary 20 mg 90 tab -1,609764 -3,72407 -2,98623 -2,6326 0,463 Non-stationary 40 mg 90 tab -1,646813 -3,72407 -2,98623 -2,6326 0,4448 Non-stationary 80 mg 90 tab -3,234768 -3,95915 -3,081 -2,68133 0,038 Stationary
For the forms that we cannot reject the hypothesis that there is a unit root, we also tried to add a new independent variable, the value of market share in the previous month. However, the independent variable of lagged market share was not significant.
Interpretation of Heteroscedasticity and Autocorrelation:
Autocorrelation can be interpreted in two ways. First of all, the forms which we have evidence for autocorrelation according to Durbin-Watson test, are the ones that have poor variability in price. Having the strongest evidence for autocorrelation, extra co-pay amount do not vary and may remain same for up to seven consecutive periods in