EFFECTIVE TAX AND SHADOW PRICE CALCULATIONS
FOR TURKEY
A THESIS PRESENTED BY KUZEY YILMAZ
TO THE INSTITUTE OF
ECONOMICS AND SOCIAL SCIENCES
IN PARTIAL FULFILLMENT OF
THE REQUIRIMENTS FOR THE DEGREE OF
MASTER OF ECONOMICS
BILKENT UNIVERSITY
JULY, 1997
Н С
I certify that I have read this thesis and that in my opinion it is fully adequate, in
scope and in quality, as a thesis for the degree of Master of Economics.
Assoc. Prof. O sm ai\Jaim (Supervisor)
I certify that I have read this thesis and that in my opinion it is fully adequate, in
scope and in quality, as a thesis for the degree of Master of Economics.
H
oJ L
v> ^
Assist. Prof. Nader Habibi
I certify that I have read this thesis and that in my opinion it is fully adequate, in
scope and in quality, as a thesis for the d e g re e ^ Master of Economics.
Assoc. Prof. Syed F. Mahmud
Approved by the Institute of Economics and Social Sciences
Director:
ABSTRACT
EFFECTIVE TAX AND SHADOW PRICE CALCULATIONS
FOR TURKEY
Kuzey Yilmaz
MASTER OF ECONOMICS
Supervisor: Assoc. Prof. Osman Zaim
July,1997
When Turkish government imposes taxes on commodities, particularly
import duties and excise taxes, their burden will also fall on inputs. In this thesis,
we have two main objectives.
First one is to develop a model for Turkish
Economy so as to find a set of taxes for Turkey, which we call effective taxes, so
that an increase in the effective tax corresponds to an increase in the price of the
final good. And then, we will calculate the values of effective taxes for the
sectors of Turkish Economy. One also want to know whether a sector of Turkish
Economy is socially profitable or not. To answer this question, we have to know
shadow prices. My second objective is to calculate social profitability, so that we
can classify each sector of Turkish Economy as socially profitable or not, by
using Shadow Prices.
Keywords:
Effective tax. Accounting Ratio, Standard Conversion Factor,
Shadow Price, Shadow Profit, Social profitability
ÖZET
TÜRKİYE İÇİN
ETKİN VERGİ VE GÖLGE FİYAT HESAPLAMALARI
Kuzey Yılmaz
Yüksek Lisans Tezi, İktisat Bölümü
Tez Y öneticisi: Yrd. Doç. Dr. ösm an Zaim
Temmuz, 1997
Türk hükümeti mamülleri özellikle ithalat ve satış vergileriyle vergilendirdiği zaman,
bunun yükü ham maddelerde de görülecektir. Bu tezde, iki temel amacımız vardır.
Birincisi, etkin vergi diye adlandırdığımız bazı vergileri bulmak amacıyla Türkiye
ekonomisi için bir model geliştirmektir. Etkin vergideki artış son ürünün fiyatında artışa
sebeb olacaktır. Ve sonra, Türkiye ekonomisindeki sektörler için etkin vergi değerlerini
hesaplayacağız. Bazı insanlar Türkiye ekonomisindeki sektörlerin sosyal olarak faydalı
olup olmadığmı öğrenmek isteyebilirler. Bu soruya cevap verebilmek için gölge fiyatları
bilmek zorundayız.
İkinci amacım, Türkiye ekonomisindeki sektörleri faydalı veya
faydasız diye sınıflandırabılmek için gölge fiyatlan kullanarak sosyal karlılığı
hesaplamaktır.
Anahtar kelimeler : Etkin Vergi, Muhasebe Oranı, Standart Çevirim Çarpanı, Gölge
Fiyat, Gölge Kar, Sosyal Karlılık
ACKNOWLEDGEMENT
I would like to express my special thanks to my supervisor, Dr. Osman Zaim, for
his guide, contributions and comments throughout my thesis. I also would like to
express my gratitude to Dr. Nader Habibi and Dr. Syed F. Mahmud for their
valuable feedback and evaluations. Finally, I appreciate the help of Dr. Subidey
Togan.
Contents
1. In tro d u c tio n
1
Literature review...3
2. Effective Taxes
7
Model o f Closed Economy... 7
Model o f Open Economy...8
D ata...10
The Effective-tax Calculation... 13
3. Shadow Prices
17
Data and Some Key Parameters...20
Shadow Price Estimates For Turkey... 23
4. C onclusion
26
5. A ppendix (Tables)
27
I. Effective Taxes on Imports... 27
II. Domestic Effective Taxes... 33
III. Total Effective Taxes...39
IV. Non-traded Sectors... 45
V. Value o f Imports and c.i.f. Values... 46
VI. Shadow Prices o f Goods... 48
VII. Breakdown o f Value Added... 49
VIII. Non-traded Accounting Ratios... 51
IX. Social profitability...52
X. The most socially non-profitable sectors... 54
XII. The most socially profitable sectors... 55
6. B ibliography
56
IN T R O D U C T IO N
When Turkish government imposes taxes on commodities, particularly
import duties and excise taxes, their burden will also fall on inputs. In this thesis,
we have two main objectives.
First one is to develop a model for Turkish
Economy so as to find a set o f taxes t® for Turkey, which we call effective taxes,
so that an increase in the effective tax corresponds to an increase in the price of
the final good.
In other words, the effective tax t® is the amount by which
government revenue would increase if there were a unit increase in final demand
for the good. And then, we will calculate the values of effective taxes for each
sector in the input-output table of Turkish Economy.
One also want to know whether a sector in the input-output table of
Turkish Economy is socially profitable or not. To answer this question, we have
to know shadow prices. My second objective is to calculate social profitability, so
that we can classify each sector in the input-output table of Turkish Economy as
socially profitable or not, by using Shadow Prices.
A policy-maker in Turkey may want to find a measurement instrument for
Turkey, which shows total amount of taxes paid until it reaches consumer, as a
percentage of purchaser prices so that he could get an idea about the extent of
taxation for each sector in the input-output table o f Turkish Economy. This
measurement instrument can be effective taxes. Effective taxes would be a
useful summary of statistic for the complicated tax system of Turkish Economy.
If this policy-maker were to impose new taxes, or introduce a tax reform for
Turkish Economy, effective taxes would be a useful tool for policy-maker. The
model, that is used for finding an expression for effective taxes, will be a simple
input-output model of open economy, which is based upon the model of Ahmad
and Stern (1991).
One may ask the following questions;
‘Which sectors in Turkey are
socially profitable?. In which sectors, should output be increased or decreased?'.
To do this, we have to know shadow prices in Turkey. In principle, shadow
prices take into account the full general equilibrium consequences of an extra
unit of demand on the system including the effect o f changes in government
actions. Since shadow prices embody the full effects on social welfare of the
extra supply of the good, their calculation requires a general equilibrium model of
economy.
Since data availability is generally limited, this model should be
simple and essentially based on input-output information. We will use the method
proposed by Little and Mirriees (1974), which is based mainly on the information
about production to calculate shadow price systems for Turkey. Then, we will
use shadow prices to calculate shadow profits, which is defined as shadow value
of outputs minus shadow value of inputs (including factors of production). And
then. We will try to calculate social profitability, that is the ratio of shadow profit to
shadow value of output. Social Profitability is used to determine whether a
sector in the input-output table is socially profitable for Turkey or not. So, it will
be useful in the analysis of policy at sectoral level. Shadow prices will also be of
value for broad classes of inputs in the analysis of particular investment projects.
The arrangement of thesis will be as follows;
In section 2,
we will
develop a model for Turkish Economy to find an expression for effective taxes
and then calculate the value of effective taxes for each sector in the input-output
table of Turkish Economy. In section 3, we will give information on shadow
prices and show how to calculate them. And then, we will calculate shadow
prices and social profitability for Turkish Economy.
Finally, we will state our
conclusion in section 4.
Literature Review
Ahmad and Stern’ (1991) presented a set of general principles and
methods for the analysis o f tax reform in developing countries and examined
possible strategies for reform of the tax system in Pakistan. They explored the
structure of taxation in Pakistan, reviewed and developed the basic principle of
taxation. They also discussed effective taxes and shadow prices in Pakistan.
This publication was among important publications in the effective tax literature.
' The detailed work in this book was found in the following papers: Ahmad, Barret and Coady (1985) ‘Input-output
matrices for Pakistan 1980-1’; Ahmad and Stem (1984) ‘the theory of tax reform and Indian indirect taxes’, Ahmad
and Stem (1986) ’Tax reform for Pakistan: Overview and Effective taxes for 1975-76’ and Ahmad and Stem (1990)
Metzler (1951), tried to see net effect of taxes in a Leontiefs input -output
model and showed that the price of taxed goods rises by more than that of
untaxed goods. Radhu (1965) tried to see the effect o f indirect taxation on
prices for Pakistan. Hoffman (1972) tried to see the effect of tax on welfare.
Atkinson and Sutherland (1988) use tax-benefit models for optimum taxation.
Newbery (1986), advises that if we could not tax some good even though
it must be taxed for optimum taxation, one would want to consider taxing inputs
into those goods as a surrogate for taxing final goods. Gersovitz (1987) tried to
see the effect o f taxes on foreign private investment.
Little and Mirrlees(1974), in their work, advised a method for calculating
shadow prices of tradable, non-tradable goods. They used accounting ratios
instead of shadow prices and used them to appraise projects.
Ahmad, Coady and Stern (1985), used Little Mirriees (1974) rule to
calculate shadow prices for Pakistan.
Squire and van derT ak (1975), proposed methods to appraise projects. In
their work, they mention about investment criteria, distributional weights, the
social discount rate, the shadow wage rate, shadow prices for traded and non-
traded goods and the standard conversion factor and shadow exchange rate.
Dreze and Stern (1987), has shown how shadow prices can be used to
detect welfare improvements arising from
a project in an economy with
imperfections of various kinds. The analysis provides a framework for the
discussion o f marginal changes in the government policy in general and shadow
prices for investment planning are linked closely to the choice of government
policies elsewhere, particularly concerning taxes, trade and the regulation of
industry. Dreze and Stern (1990), also tried to find an answer to the question,
‘How should public projects and policy reforms be assessed when market prices
give misleading signals?’.
Revenues and costs at market prices then give
distorted measures of social gains and losses and one’s appraisal should use
social opportunity costs or ‘Shadow Prices’. The authors show how shadow
prices may be integrated into an analysis of policy reform, demonstrate the
critical dependence of these prices on government policy, and analyze their
relations with market prices.
In Dixit and Stern (1974), the view of agriculture as facilitating the growth
of other sectors was not confined to finance and labour, but included the
provision o f food to the growing industrial workforce, and the problem of
marketed surplus was emphasized. This was among an early analysis of policy
models of marketed surplus cooperated with shadow prices.
Heckman (1974) and King (1983) gives an idea about econometric
calculation of shadow prices and how those affect welfare of households. Heady
and Mitra (1987) shows how shadow pricing can be employed for optimal
taxation.
Squire, Little and Durdag (1979) looks at shadow pricing as a
macroeconomic policy for Pakistan. Stern (1987) shows how to use shadow
prices as a tool for tax reform.
2.EFFECTIVE TAXES
Closed Economy, fixed coefficients; one factor
We begin this section with the simple, static closed-economy Leontieff
model, and then turn to open economy.
All purchasers of a good pay a price with tax included. The purchasers’
price vector q is defined as the price paid by consumers and is also paid by
producers for the purchase of inputs. The producers’ price vector p represents
the price received by producers for sales. Consider the simple input-output
model of production with fixed input-output matrix A, gross output vector Y, and
net output vector Z. Then inputs are AY, and
Z = Y-AY = ( I - A) Y
(1
)Competitive price conditions for this model are
where primes denote row vectors and v is the vector of per unit value added by
industry. ( For the moment , assume it to be fixed- You may think of it as the
vector o f labor requirements x the wage )
If t denotes the tax v e c to r, then
q = p + t
(
3)
and from equations (2) and (3), we have
q’ = t’ x ( l - A ) - ’ + v ’ x ( I - A ) · ’
(
4)
In this model, the effective tax vector t® is,
t®‘ = t’ x ( l - A ) - ’
(
5)
Open Economy, fixed coefficients; one factor
Let us Introduce exports and imports into our model. Furthermore, let
superscripts m and d refer to imported and domestic goods respectively. Unless
otherwise stated, all imports are assumed to be complementary:
that is,
production of good j at unit level requires aij*“ of good i produced domestically and
aij"’ of imported good i.
In the absence of taxes, the competitive pricing
conditions for domestically produced goods becomes
q’ = q’ A“ + v’
(6
)where A*“ is a matrix of input-output coefficients for domestic flows. The foreign
exchange costs (Pn,’A„, where p„, stands for import prices) of imported inputs have
been included in the vector of value added, v, and there are assumed to be no
import quotas for these inputs. If we allow for the imposition of excise taxes on
domestic production t“* (per unit), and for the import duties r ( p e r unit), the pricing
equation becomes
q- = t<i’ X ( I -A^ )■' + 1"” X A-" X ( I -A“ )-’ + v’ x ( I - A ^)’’ (7)
where A"" is the matrix with the ijth element a^. Thus, the effective taxes t®’, are
given by
t«’= t"’ X ( 1 -A“ )·’ + r ’ X A*" X ( I -A“ )-'
(8
)In this formulation, the contribution of excise taxes, which fall only on
domestic production, to effective taxes is given by t'’’ x ( I -A'' )■’ and that of import
duties t"” X A*" X ( I -A'* ) ’ . Note that in this model the tax effects are additive.
Here, we see domestic and imported inputs as different goods.
Hence, we
cannot add
and A*" to get an aggregate input-output matrix. The effects of
sales tax levied on total commodity flows, may also be given by equation (8).
There, we can see sales taxes as affecting prices o f domestically produced
goods in part through domestic inputs. In the discussion of effective taxes, we
will ignore the income tax.
Finally, we can take into account the taxation of goods which arises
through the capital stocks required in their production.
By replacing A“ by
( A” + r K*“ ) and A*" by ( A"* + r K·" ) where K"* is the matrix of stocks of domestic
goods required as capital for the production o f domestic goods, K*" the matrix of
stocks of imported capital goods for domestic production, and r a real rate of
interest^, we can modify formula (8) in a steady state framework. The steady
state assumption is necessary since otherwise we would have to consider
carefully the time pattern o f accumulation, taxes and rates of interest in the
determination of prices.
Data
In this study, we needed information on revenue collections for the indirect
taxes, and tables of input-output coefficients for absorptions of domestic and
’ See Ahmad and Stem (1991)
imported goods and services. At the time of my study, the latest available tablé
was for the year 1990.
We assume exports not to enter into the domestic production circuit. Thus
export duties do not affect the calculation of effective taxes. However, if world
prices are fixed, then export taxes would be shifted backwards onto factors of
production. During our reference period, export duties in Turkey were completely
lifted .
Data on import and indirect tax collections for the year 1990 have been
obtained from the input-output table of the same year. It is a known fact that
excise taxes also applied to imported goods. Proportion of imports to total
commodities is given by national accounts. This information can be used to find
the part of indirect taxes received from imported commodities. Remaining part of
total indirect taxes will be total tax collections from domestically produced
commodities. Adding the indirect taxes collected from imported commodities to
import duties yields tax revenues o f imported goods. The nominal tax rates for
domestically produced t^ and imported goods r will be found as follows: Dividing
revenues for each good by flows of the good, we derive the implicit rate of tax,
which we call the nominal rate. This way of calculating nominal rates,
circumvents the problem of evasion associated with the use of announced
statutory changes. Moreover actual collections provide a weighted average of
the implicit tax rates for any commodity group.
The input-output matrix used in this fieldwork was obtained from the State
Institute of Statistics. It was an 64-sector matrix of domestic and import flows at
purchaser prices. We know proportion of imports to total commodity in
circulation. Thus, we have estimates for both imported and domestic coefficient
matrices, A"’ and A” .
Finally, we need a data set to estimate a capital stock matrix. Investment
data was also available in input-output table. Assume that all assets depreciate
by a fraction p per year and that a fraction a of the current investment ( a matrix )
is used for replacem ent, then K = ( a/p ) x I and r x K = r x ( a/p ) x I. We have
to take into account the resources, a x I , used for replacement. We assume that
these are not captured in the input-output matrix. Hence we must augment A by
[ r X ( a/p ) + a ] times the investment matrix. If there were no information on a
and p, we would have taken this factor to be unity. One case consistent with this
assumption is r = p and a = Vi. By taking the investment for each sector and
allocating it across the various investment sectors using the proportions given by
the national accounts, we constructed investment matrix. The resulting matrix is
divided into assets which are imported and those which have been domestically
produced using the proportions o f the absorption of imports and domestic goods
in 1990. Real interest rate for the year 1990 was negative. (-3.9) It would be
insensible to use this value as a real interest rate, since one may expect that
using capital should have some cost to the user. One may propose different
methods to obtain real interest rate. One method was to take average of last 20
years real interest rate, which would turn out to be about 3%. Another method
was to take the average of last 20 years growth rates, which would turn out to be
approximately 4.8%. ( note that in growth theory, in long run golden rule holds,
which says growth rate = real interest rate ). We will experiment with 3%, 4%
and 5% values of real interest rate.
The Effective-tax Calculation
We can divide the effective-tax estimates for the year 1990 into the
component domestic t*^e. arising from domestic sources , and imported sources
T e . arising from inputs of imported goods into domestic production as shown in
equation (8).
t^ ‘ = t'" X [ I - A** ]■’
(
9)
Te'
= r ‘ XA·"
X[I - A“· ]■'
(10
)These are modified as we consider the tax element in price attributable to
the taxation o f capital assets. So modified components of effective taxes will be
as follows;
t V = t “'‘ x [ l - A '’ ]·'
(
9’)
t'"e‘ = t"” x A ^ x i l - A'*]-’
( 10’)
where S ' " , A " are the matrices of imported good requiremerits modified by the
capital inputs and the capital-augmented domestic good matrix, respectively. We
define t'"e‘ and t V to be the effective taxes on domestic goods arising from
import taxation and domestic taxation,
respectively. The total effective tax
including the effects arising from assets is
t e = t “e+ t-"e
(11
)In table 1.1, 1.2, and 1.3, you will see estimates of Te and t ""e which arises
from the taxation of imported inputs into domestic production for the real interest
3%, 4% and 5%, respectively. All comments are made for the real interest rate
4%.
All domestic commodities except public services are affected by the
taxation o f imported inputs. It is below 3% of purchaser price for most of the
commodities. It can be noted that the highest imported sources of effective-
taxes, at around 6% of purchaser prices, is observed for Manufacture of Land
Transport Vehicles and Equipment, Manufacture of Petroleum and Coal
Products, and Manufacture of Plastic Products.
When the taxation of the
imported capital stock is taken into account, there is change in the imported
source of effective taxes and t^^ is less than r , , for most of the commodity
groups. The taxation arising through imported g o o d s(t"’e - r« ) subtracts less
than 1% from purchaser prices of most items. The most affected sectors by
taxation o f capital stock were
Manufacture of Other Transport Equipment
(9.3)%, Other Construction (8%) and Building Construction (7.9%). We may
move on to next table by saying that the taxation of imported capital goods form
a significant contribution to the to the value of t " ’e for all goods except Public
Services, which was already untaxed.
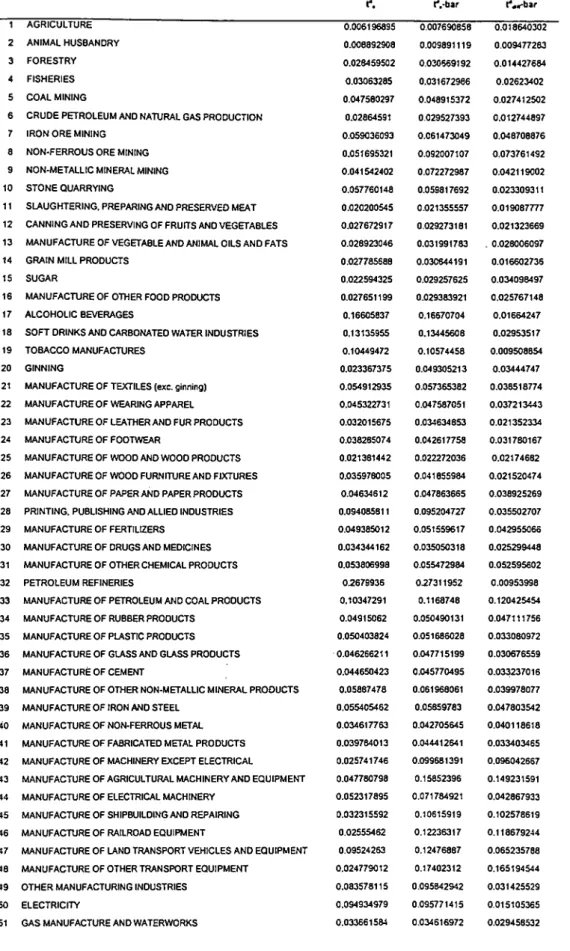
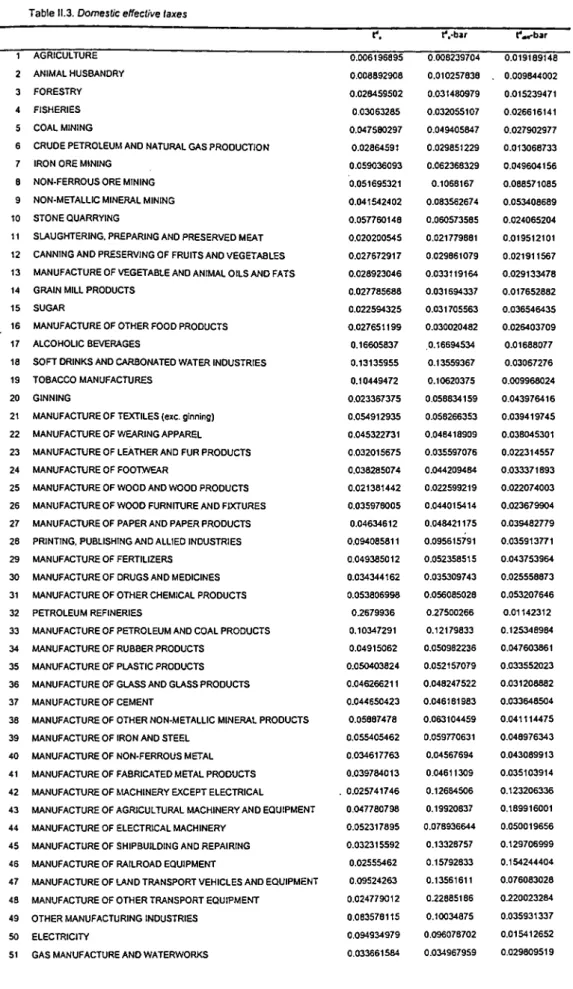
We are also interested in the part of taxation arising through domestic
intermediate inputs (Table ll’s ) and this is measured by the divergence
between the domestic effective tax t‘'e and nominal tax on domestic production
diff *· e (
12
)It is, generally, between 0.75 and 24% of purchaser prices for most of
commodities, 0 for Public Services. It is above 10 % of purchaser prices for
Other Construction (24), Building Construction (21%), Manufacture of Other
Transport Equipment (17%), Manufacture of Agricultural Machinery and
Equipment (15%), Manufacture of Petroleum and Coal Products (12.8%),
Manufacture o f Railroad Equipment (12%), Manufacture of Shipbuilding and
Repairing(IO)
The overall effective tax, from both domestic and imported sources, is
shown in Table Ill’s, t'’ in the first column stands for nominal tax on domestic
production. In columns 2 and 3, the effective taxes with and without the effects of
taxation of the capital stock , tg and tg are shown respectively. All commodity
groups except public services are affected by the structure o f indirect taxes. In
some cases, effective taxes are quite high, as fo r Other Construction, for which
the effective tax as a proportion o f purchaser prices is around 35%. High
effective taxes may reflect high nominal taxes, and Petroleum Refineries is a
case in this point. It is the difference between effective and nominal taxes, t ¿¡
b,
which reflects taxation arising through other commodities and assets, and which
may sometimes be a unintended consequence o f a government policy. In case
of Other Construction, td« is actually around 35%
o f purchaser prices. For
Building Construction, it is about 31% o f purchaser prices. For Railway
Transport, it was about 11.5% of purchaser prices. In reality, the only subsidized
sector is Railway Transport, for which t g was about -8%. The case o f Other
Construction is a good example of seeing effect o f taxes falling over taxes. In
agriculture. Sugar, Manufacture of Petroleum and other Coal products, and
Water transport, we observed effective taxes to be positive even though they
seem to be subsidized. The inclusion of taxation o f capital stock has had a small,
insignificant impact on producer prices except fo r the Public Services. For most
of the commodities, t g - tg is smaller than 1% o f purchaser prices
3.SHAD0W PRICES
Let us first describe the basic elements of the shadow price system. There
are two main elements.
(i) For traded goods, relative shadow prices should be equal to relative world
prices.
(ii) for non-traded goods, the shadow price is the marginal cost o f production
evaluated at shadow prices.
Basically, world prices represents the net benefits on the margin
associated with an adjustment to production or consumption of traded good. For
example, if a good is traded at fixed prices, the effect o f an expansion in the
production is not to change prices and the welfare o f the households directly, but
simply to save imports or increase exports. Therefore, all that matters is the
foreign exchange earnings or savings. These foreign exchange earnings may
have a different value from that given by the official exchange rate, but relative
values of goods are given by their relative world prices.
Another point is the desirability of public sector efficiency. Given that the
public sector should be efficient, the marginal rates o f transformation between a
pair of goods should be the same wherever those goods are transformed one
into the other. When economy becomes an open economy, the marginal rates of
transformation in that activity becomes equal to the relative ’.vorld prices.
Therefore, these should be the marginal rates of transformation elsewhere anrj
thus the relative shadov/ prices to be used for evaluating projects.
We now turn to non-traded goods. The Little-Mirriees rule is that the
shadow price is the marginal cost of production at shadow prices. Let w, stand for
the shadow value of domestic factors used directly in the production of good ]
and Pj for the shadow value of the tradable inputs which are direct inputs into
good j. Then, for the m non-tradable goods, indexed by j=1... m, we have
Vj =Z V
ka^j + Wj + pj
(13)
where Vj is the shadow price of non-tradable good j and a,, is the marginal
amount of good k required for the production of a unit of good j. In matrix
notation, we have
v' = v' X A + w' +p’
(14)
and
v ’ = ( w ’ + p ’ ) X ( I - A )■'
(14·)
where a prime denotes a row vector and A is the matrix (
). Note that theory
required us to know the shadow values w of the domestic factors used in the
production.
When we employ labour on a project, it is diverted from another activity
where it was producing and consuming. We must examine how its withdrawal
from other activities will affect output and incomes elsewhere, while considering
its opportunity cost. Suppose we employ a labourer at a wage c in a public
company and that labourer was earning m (his marginal product) in the previous
occupation. Then, the consequence of extra employment is that the labour has
an extra income ( c-m ) and the public sector loses the wage it has paid c. Then,
the social cost of employing the labourer, or the shadow wage rate is
SWR = c - X x ( c - m )
(15)
where X is the value of the extra income to the labourer as seen by the
government.
Consider another aspect of shadow wage which is that the shadow prices
for the marginal product (m) elsewhere may not be equal to market prices and
the value of c at market prices will not be the same as its value at shadow prices.
Hence, we need to convert c and m into shadow prices. To do this, we multiply
each of c and m by a different standard conversion factor or SCF. This converts
market prices into shadow prices for a bundle of goods. The make-up of the
bundle depends on the problem on the discussion. For m, we would want a
bundle relevant to the quantities that worker would have produced if he had been
working elsewhere. For c, we need a bundle corresponding to the consumption
of the worker. We call the ratio of shadow price to market price, the accounting
ratio, and SCF is an appropriate weighted average o f accounting ratios. If SCF to
be applied to m is 0.75, this says that the shadow prices of goods which would
have been produced by the worker elsewhere are 75% o f market price, i.e. for
traded goods, if these are what would have been produced, the market price is
four-thirds o f the world price. Then, the reciprocal o f the shadow wage rate is like
a shadow exchange rate.
Typically, the data for the cost of production will include some element of
profit or payment to capital. But, we assume profits to be zero in our fieldwork.
Notice that we also have to multiply parts o f value added pertaining to capital
and land by an appropriate SCF.
Data and some key parameters
Our calculations are based on 64-sector input-output table, the table used
for the effective tax calculations. The 64 sectors must be classified into traded
and non-traded activities. In the literature, first 49 items in the input-output table
for the Turkish Economy is behaved as tradable and the rest is behaved as non
tradable. For tradable goods, we have to classify them also as exported and
imported goods. If the volume of exports ( imports ) are larger than imports
(exports), this commodity group is classified as exported ( imported ). The non-
traded sectors are shown in Table IV.
Once we have obtained information on inputs, outputs and taxes, and
classified sectors into tradable and non-tradable sectors, we can find shadow
price estimates for Turkey. We consider shadow prices for exportables,
importables and non-traded goods in that order. In Table VI, the formulas of
shadow prices for non-traded and imported goods is presented. Writing them in
matrix form will make life simpler to calculate shadow prices. After writing them
in matrix form, you will have two equations and two unknowns. Thus, we will
have shadow price estimates for imported and non-traded goods.
We express a shadow price in terms of its accounting ratio ( AR ) which is
the shadow price divided by the market price. For exported goods, this is the
ratio of value of exports without taxes to value of exports with export taxes
included. So, accounting ratios are 1 for the goods which do not have export
taxes. For the year 1990, there were no export taxes or subsidies for exported
commodities in Turkey. Thus, accounting ratio is 1 for all exported commodities
throughout this fieldwork. The input-output table for the 1990 has data on gross
absorptions. In case of imports, subtracting taxes, trade and transport margins
from value of imports, we derive the c.i.f. values. The P;"' values for importables
are shown in Table V.
The calculation of shadow prices requires estimates of the breakdown of
the payments to different factor inputs. Such a breakdown can be done by using
input-output table. From input-output table, we can find contribution of labour in
the value added. The remaining part is due to capital and land. For most of
commodity groups, we will assume the share o f land to be 0.3. But in some
cases, it is different from 0.3. This is done so as to prevent the share o f capital
from being negative.
To calculate the accounting ratios for non-traded activities, we need those
for traded goods and disaggregated value-added terms. For land, we assume
throughout an accounting ratio of 0.9. This is somehow a weighted average of
accounting ratio for agriculture ( exported commodity) and Pj°^ value, since one
can regard the marginal product of land as being in terms of agricultural goods.
For the employment accounting ratio, we experiment with values including 0.9,
0.75 and 0.5. We refer to those ratios as the wage conversation factors ( WCF ).
Lower ARs would correspond to cases where we assume relative abundance of
labour.
In a similar manner, an AR for the asset may be generated. We refer to
this AR as the asset conversation factor, or ACF. Actual cost of $1 investment is
1+r, r is real interest rate, where nominal cost is 1+n, n is nominal interest rate.
So, we can refer to ( 1 + r ) / ( 1+n ) as AR for capital. This value is calculated for
the year 1990 and referred as AR for capital.
Shadow price estimates for Turkey
The accounting ratios for non-traded goods corresponding to each
combination of ARs for labour and assets are presented in Table VIII. Some
ARs are, however, greatly affected by the ARs o f major inputs. Also notice that
activities with high labour coefficients are most sensitive to the wage conversion
factor chosen - for example, (63) ‘ Public Services '. Similarly, one must expect
that those which have high capital coefficients are most sensitive to the asset
conversion factor chosen.
One minus the accounting ratio for a sector can be interpreted a shadow
subsidy on output in that sector, since it measures the extent to which producers
are paid more than the shadow price of their product. It provides a direct
commentary on the incentives which have been provided. Another commentary
on sectoral priorities and incentives is provided by the analysis in terms o f social
profitability which involves an examination of the social profitability of expanding
exports or domestic productions or imports.
Shadow profits or loses are derived by evaluating the inputs and outputs
of each sector at shadow prices. We expect non-traded sectors to have a normal
profit at shadow prices, because shadow price is the shadow marginal cost
which we have assumed equal to shadow average cost. The classification into
traded and non-traded is therefore crucial in interpreting results on social
profitability. Recall that there are 49 non-traded sectors.
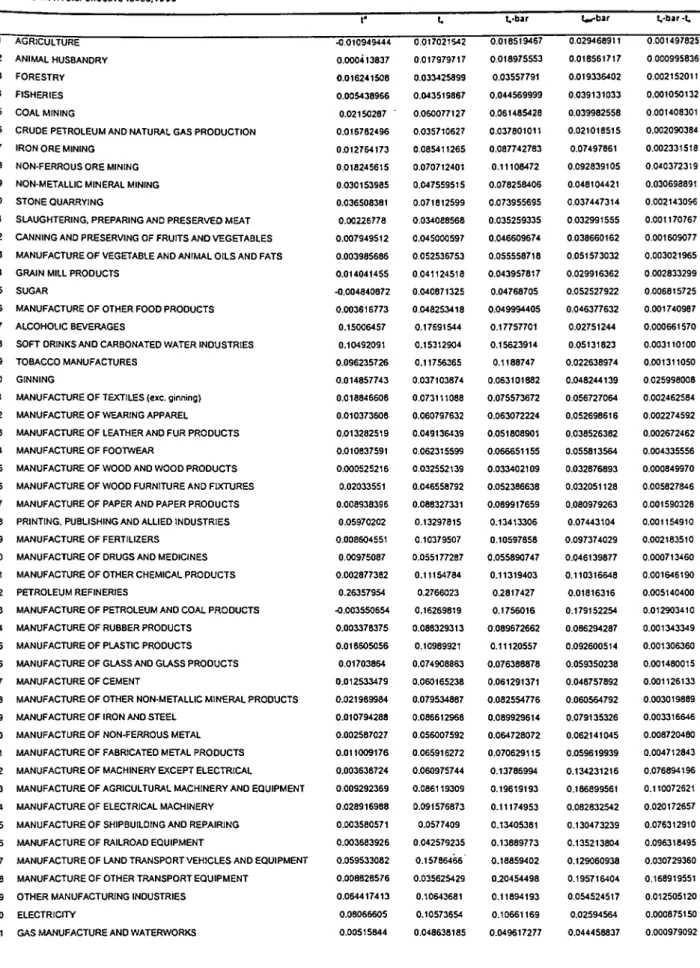
In Table IX, we present the social profitability ( shadow profit or loss as a
proportion o f the shadow value o f output ). In this table, we present the
sensitivity of the social profitability to ARs for labour ranging from 0.9 to 0.5 for
given AR=0.62 for the assets.
The list of most socially profitable and non-profitable traded sectors are
presented in Table X and XI. Among imported sectors, the most socially
profitable sectors are Ginning and Sugar. Canning and Preserving of Fruits and
Vegetables are the most socially profitable exported sectors. Petroleum
Refineries and Manufacture o f Fabricated Metal Products were the most socially
non-profitable exported and imported sectors, respectively Expanding Imports
(exports) in imported (exported) sectors, is socially profitable for the Turkish
Economy.
For non-tradable goods, the policy interest in the calculations for these
sectors lies in examining the shadow marginal cost. For example, we could ask
whether there would be any benefit in the relaxation of import restrictions ( if this
is the reason why it is non-traded ) by comparing the shadow price with the
import price. If there appear to be particularly beneficial domestic uses o f the
non-traded output, we could try to calculate a shadow value for these uses ( for
example, extra electricity supply ). If the shadow value of the use exceeds the
shadow marginal cost, then one might argue the output should be expanded and
directed towards the beneficial use.
One expects that activities whose outputs have relatively low ARs will
exhibit negative social profitability. In our case with a conversion factor for labour
of 0.9 and for capital of 0.62, our results suggests, this expectation did not turn
out to be true. All commodity groups, showing negative social profitability, except
Petroleum Refineries have large ARs. One reason for this situation might be that
inputs used in the production o f those commodities have large AR ’s. Note that
Animal Husbandry and Manufacture o f Fabricated Metal Products, showed
positive social profitability as we decreased the conversion factor for labour.
4.CONCLUSION
In this fieldwork, we have presented the calculation of two basic policy
tools; Effective taxes and Shadow prices.
We have observed that the ‘ Effective tax ‘ differs greatly from the nominal
tax. This study may be of use to policy-makers in helping them understand the
effects of a complex system, especially when some o f these may be unintended
consequences of a tax policy. Notice that Effective taxes could be used to
provide a quantification of the direct and indirect taxation involved in the
domestic production of goods for export.
While calculating shadow prices, we had difficulty in data. Overall, under
some assumptions we calculated shadow prices fo r Turkey. And then, we used
them to calculate social profitability for each sector in the input-output table. We
have used the shadow price calculations to comment on sectoral policy where
shadow prices can be employed to characterize socially profitable activities.
5.APPENDIX;
Table 1.1 Effective taxes on imports into domestic production
r. r.-bar 0.010824747 0.011290670 0.009086809 0.009393171 0.004966397 0.005592155 0.012087017 0.013210718 0.01249683 0.012902982 0.007064717 0.008546253 0.026375172 0.027023462 0.01901708 0.031545674 0.006017113 0.015490108 0.014052451 0.014774303 0.013888023 0.014261013 0.01732768 0.01783144 0.023613708 0.024516067 0.01333883 0.014197735 0.018277 0.020490322 0.020602219 0.021146399 0.010857062 0.011070599 0.02176949 0.022740794 0.013068932 0.013516686 0.013736499 0.021819004 0.018198153 0.018966809 0.015474901 0.016105506 0.017120764 0.017984136 0.024030525 0.025373456 0.011170697 0.011405526 0.010580787 0.012340659 0.04198121 0.042523356 0.038892337 0.039274402 0.054410055 0.055091544 0.020833126 0.021058837 0.057740843 0.058236315 0.008608696 0.010200583 0.059225275 0.062871083 0.039170693 0.039596829 0.059495386 0.059916114 0.028642652 0.029121838 0.015514816 0.015867303 0.020660107 0.021543438 0.031207506 0.032319154 0.021389829 0.024523935 0.026132259 0.027648066 0.035233998 0.061057398 0.038338511 0.07191981 0.039258979 0.045905579 0.025425308 0.050733769 0.017024615 0.046476556 0.062622027 0.072957344 0.010846417 0.076681693 0.022850696 0.026892383 1 AGRICULTURE 2 ANIMAL HUSBANDRY 3 FORESTRY 4 FISHERIES 5 COAL MINING
6 CRUDE PETROLEUM AND NATURAL GAS PRODUCTION 7 IRON ORE MINING
8 NON-FERROUS ORE MINING 9 NON-METALLIC MINERAL MINING 10 STONE QUARRYING
11 SLAUGHTERING. PREPARING AND PRESERVED MEAT 12 CANNING AND PRESERVING OF FRUITS AND VEGETABLES 13 MANUFACTURE OF VEGETABLE AND ANIMAL OILS AND FATS 14 GRAIN MILL PRODUCTS
15 SUGAR
16 MANUFACTURE OF OTHER FOOD PRODUCTS 17 ALCOHOLIC BEVERAGES
18 SOFT DRINKS AND CARBONATED WATER INDUSTRIES 19 TOBACCO MANUFACTURES
20 GINNING
21 MANUFACTURE OF TEXTILES (exc. ginning) 22 MANUFACTURE OF WEARING APPAREL 23 MANUFACTURE OF LEATHER AND FUR PRODUCTS 24 MANUFACTURE OF FOOTWEAR
25 MANUFACTURE OF WOOD AND WOOD PRODUCTS 26 MANUFACTURE OF WOOD FURNITURE AND FIXTURES 27 MANUFACTURE OF PAPER AND PAPER PRODUCTS 28 PRINTING. PUBLISHING AND ALLIED INDUSTRIES 29 MANUFACTURE OF FERTILIZERS
30 MANUFACTURE OF DRUGS AND MEDICINES 31 MANUFACTURE OF OTHER CHEMICAL PRODUCTS 32 PETROLEUM REFINERIES
33 MANUFACTURE OF PETROLEUM AND COAL PRODUCTS 34 MANUFACTURE OF RUBBER PRODUCTS
35 MANUFACTURE OF PLASTIC PRODUCTS 36 MANUFACTURE OF GLASS AND GUSS PRODUCTS 37 MANUFACTURE OF CEMENT
38 MANUFACTURE OF OTHER NON-METALLIC MINERAL PRODUCTS 39 MANUFACTURE OF IRON AND STEEL
40 MANUFACTURE OF NON-FERROUS METAL 41 MANUFACTURE OF FABRICATED METAL PRODUCTS 42 MANUFACTURE OF MACHINERY EXCEPT ELECTRICAL
43 MANUFACTURE OF AGRICULTURAL MACHINERY AND EQUIPMENT 44 MANUFACTURE OF ELECTRICAL MACHINERY
45 MANUFACTURE OF SHIPBUILDING AND REPAIRING 46 MANUFACTURE OF RAILROAD EQUIPMENT
47 MANUFACTURE OF LAND TRANSPORT VEHICLES AND EQUIPMENT 48 MANUFACTURE OF OTHER TRANSPORT EQUIPMENT
49 OTHER MANUFACTURING INDUSTRIES
r . r.-bar
50 ELECTRICITY 0.010001564 0.011098974
51 GAS MANUFACTURE AND WATERWORKS 0.014976601 0.015295790 52 BUILDING CONSTRUCTION 0.020490602 0.074266980
53 OTHER CONSTRUCTION 0.028670064 0.003027653
54 WHOLESALE AND RETAIL TRADE 0.005268889 0.006025207 55 RESTAURANTS AND HOTELS 0.014320375 0.014666353
56 RAILWAY TRANSPORT 0.033029998 0.035231315
57 OTHER LAND TRANSPORT 0.028000173 0.028707666
56 WATER TRANSPORT 0.023938593 0.024864055
59 AIR TRANSPORT 0.017403639 0.017004971
60 COMMUNICATION 0.020992682 0.021690991
61 FINANCIAL INSTITUTIONS AND INSURANCE 0.004514181 0.004606055 62 PERSONAL AND PROFESSIONAL SERVICES 0.023028422 0.023498841
63 PUBLIC SERVICES 0 0 64 OWNERSHIP OF DWELLINGS 0.004278664 0.004333689 Notes: r = 3% r , ‘ = r ' x A " ’ x[|.A<’ ]·' r , - = r ‘ xA"’ x [l-A " ] ·' 28
Table 1.2 Effective taxes on imports into domestic production 1 AGRICULTURE 2 ANIMAL HUSBANDRY 3 FORESTRY 4 FISHERIES 5 COAL MINING
6 CRUDE PETROLEUM AND NATURAL GAS PRODUCTION 7 IRON ORE MINING
8 NON-FERROUS ORE MINING 9 NON-METALLIC MINERAL MINING 10 STONE QUARRYING
11 SLAUGHTERING. PREPARING AND PRESERVED MEAT 12 CANNING AND PRESERVING OF FRUITS AND VEGETABLES 13 MANUFACTURE OF VEGETABLE AND ANIMAL OILS AND FATS 14 GRAIN MILL PRODUCTS
15 SUGAR
16 MANUFACTURE OF OTHER FOOD PRODUCTS 17 ALCOHOLIC BEVERAGES
18 SOFT DRINKS AND CARBONATED WATER INDUSTRIES 19 TOBACCO MANUFACTURES
20 GINNING
21 MANUFACTURE OF TEXTILES {exc. ginning) 22 MANUFACTURE OF WEARING APPAREL 23 MANUFACTURE OF LEATHER AND FUR PRODUCTS 24 MANUFACTURE OF FOOTWEAR
25 MANUFACTURE OF WOOD AND WOOD PRODUCTS 26 MANUFACTURE OF WOOD FURNITURE AND FIXTURES 27 MANUFACTURE OF PAPER AND PAPER PRODUCTS 28 PRINTING. PUBLISHING AND ALLIED INDUSTRIES 29 MANUFACTURE OF FERTILIZERS
30 MANUFACTURE OF DRUGS AND MEDICINES 31 MANUFACTURE OF OTHER CHEMICAL PRODUCTS 32 PETROLEUM REFINERIES
33 MANUFACTURE OF PETROLEUM AND COAL PRODUCTS 34 MANUFACTURE OF RUBBER PRODUCTS
35 MANUFACTURE OF PLASTIC PRODUCTS 36 MANUFACTURE OF GLASS AND GLASS PRODUCTS 37 MANUFACTURE OF CEMENT
38 MANUFACTURE OF OTHER NON-METALLIC MINERAL PRODUCTS 39 MANUFACTURE OF IRON AND STEEL
40 MANUFACTURE OF NON-FERROUS METAL 41 MANUFACTURE OF FABRICATED METAL PRODUCTS 42 MANUFACTURE OF MACHINERY EXCEPT ELECTRICAL
43 MANUFACTURE OF AGRICULTURAL MACHINERY AND EQUIPMENT 44 MANUFACTURE OF ELECTRICAL MACHINERY
45 MANUFACTURE OF SHIPBUILDING AND REPAIRING 46 MANUFACTURE OF RAILROAD EQUIPMENT
47 MANUFACTURE OF LAND TRANSPORT VEHICLES AND EQUIPMENT 48 MANUFACTURE OF OTHER TRANSPORT EQUIPMENT
49 OTHER MANUFACTURING INDUSTRIES 50 ELECTRICITY
51 GAS MANUFACTURE AND WATERWORKS
r. r.-bar 0.010824747 0.011502488 0.009086809 0.009533043 0.004966397 0.005884309 0.012887017 0.013368621 0.01249683 0.013195524 0.007064717 0.009073435 0.026375172 0.027331721 0.01901708 0.037246417 0.006017113 0.019809968 0.014052451 0.015092841 0.013888023 0.014429024 0.01732768 0.01805988 0.023613708 0.02493291 0.01333883 0.014592142 0.018277 0.021480095 0.020602219 0.021393322 0.010857062 0.011166309 0.02176949 0.02318167 0.013068932 0.013713205 0.013736499 0.025494111 0.018198153 0.019315776 0.015474901 0.016508009 0.017120764 0.018370981 0.024030525 0.025984957 0.011170697 0.011517483 0.010580787 0.013160248 0.04198121 0.042761463 0.038892337 0.039444073 0.054410055 0.055400948 0.020833126 0.02116078 0.057740843 0.058464479 0.008608696 0.010935735 0.059225275 0.064594263 0.039178693 0.039786866 0.059495386 0.060104849 0.028642652 0.029336366 0.015514816 0.016027159 0.020660107 0.021954866 0.031207506 0.032810435 0.021389829 0.025874511 0.026132259 0.028328385 0.035233998 0.07246151 0.038338511 0.087301755 0.039258979 0.048963999 0.025425308 0.061962602 0.017024615 0.059955057 0.062622027 0.077519098 0.010846417 0.10427102 0.022858696 0.028700787 0.010801564 0.011229743 0.014976601 0.015438328 29
r . r.-bar 52 BUILDING CONSTRUCTION 0.020490602 0.099014218
53 OTHER CONSTRUCTION 0.028670064 0.10919846
54 WHOLESALE AND RETAIL TRADE 0.005288889 0.006363071 55 RESTAURANTS AND HOTELS 0.014320375 0.014823824
56 F^ILWAY TRANSPORT 0.033029998 0.036231036
57 OTHER LAND TRANSPORT 0.028000173 0.029143266
58 WATER TRANSPORT 0.023938593 0.025277766
59 AIRTRANSPORT 0.017403639 0.017981434
60 COMMUNICATION 0.020992682 0.022001543
61 FINANCIAL INSTITUTIONS AND INSURANCE 0.004514181 0.004647154 62 PERSONAL AND PROFESSIONAL SERVICES 0.023028422 0.023709058
63 PUBLIC SERVICES 0 0 64 OWNERSHIP OF DWELLINGS 0.004278664 0.004358559 Notes: r = 4%
r.'
= r x A ' " x { l - A ' ' ] · ' r , ‘ = r x ^ r x [ l - A " ] · ’ 30Table 1.3 Effective taxes on imports into domestic production AGRICULTURE ANIMAL HUSBANDRY FORESTRY FISHERIES COAL MINING
6 CRUDE PETROLEUM AND NATURAL GAS PRODUCTION 7 IRON ORE MINING
8 NON-FERROUS ORE MINING 9 NON-METALLIC MINERAL MINING 10 STONE QUARRYING
11 SLAUGHTERING. PREPARING AND PRESERVED MEAT 12 CANNING AND PRESERVING OF FRUITS AND VEGETABLES 13 MANUFACTURE OF VEGETABLE AND ANIMAL OILS AND FATS 14 GRAIN MILL PRODUCTS
15 SUGAR
16 MANUFACTURE OF OTHER FOOD PRODUCTS 17 ALCOHOLIC BEVERAGES
18 SOFT DRINKS AND CARBONATED WATER INDUSTRIES 19 TOBACCO MANUFACTURES
20 GINNING
21 MANUFACTURE OF TEXTILES (exc. ginning) 22 MANUFACTURE OF WEARING APPAREL 23 MANUFACTURE OF LEATHER AND FUR PRODUCTS 24 MANUFACTURE OF FOOTWEAR
25 MANUFACTURE OF WOOD AND WOOD PRODUCTS 26 MANUFACTURE OF WOOD FURNITURE AND FIXTURES 27 MANUFACTURE OF PAPER AND PAPER PRODUCTS 28 PRINTING. PUBLISHING AND ALLIED INDUSTRIES 29 MANUFACTURE OF FERTILIZERS
30 MANUFACTURE OF DRUGS AND MEDICINES 31 MANUFACTURE OF OTHER CHEMICAL PRODUCTS 32 PETROLEUM REFINERIES
33 MANUFACTURE OF PETROLEUM AND COAL PRODUCTS 34 MANUFACTURE OF RUBBER PRODUCTS
35 MANUFACTURE OF PLASTIC PRODUCTS 36 MANUFACTURE OF GLASS AND GLASS PRODUCTS 37 MANUFACTURE OF CEMENT
38 MANUFACTURE OF OTHER NON-METALLIC MINERAL PRODUCTS 39 MANUFACTURE OF IRON AND STEEL
40 MANUFACTURE OF NON-FERROUS METAL 41 MANUFACTURE OF FABRICATED METAL PRODUCTS 42 MANUFACTURE OF MACHINERY EXCEPT ELECTRICAL
43 MANUFACTURE OF AGRICULTURAL MACHINERY AND EQUIPMENT 44 MANUFACTURE OF ELECTRICAL MACHINERY
45 MANUFACTURE OF SHIPBUILDING AND REPAIRING 46 MANUFACTURE OF RAILROAD EQUIPMENT
47 MANUFACTURE OF LAND TRANSPORT VEHICLES AND EQUIPMENT 48 MANUFACTURE OF OTHER TRANSPORT EQUIPMENT
49 OTHER MANUFACTURING INDUSTRIES 50 ELECTRICITY
51 GAS MANUFACTURE AND WATERWORKS
r . r.-bar 0.010824747 0.011755812 0.009086809 0.009700653 0.004966397 0.006237865 0.012887017 0.013547428 0.01249683 0.013445164 0.007064717 0.009625111 0.026375172 0.027707698 0.01901708 0.044067323 0.006017113 0.024983754 0.014052451 0.015468473 0.013888023 0.01462913 0.01732768 0.018332787 0.023613708 0.025435025 0.01333883 0.01506598 0.018277 0.022655024 0.020602219 0.021688392 0.010857062 0.011280044 0.02176949 0.02370859 0.013068932 0.013944455 0.013736499 0.029889966 0.018198153 0.019732891 0.015474901 0.016893431 0.017120764 0.018830606 0.024030525 0.026716852 0.011170697 0.011654188 0.010580787 0.014135171 0.04198121 0.043041739 0.038892337 0.039644836 0.054410055 0.055770779 0.020833126 0.021282345 0.057740843 0.058738935 0.008608696 0.011805324 0.059225275 0.066689048 0.039178693 0.040014125 0.059495386 0.060329213 0.028642652 0.029591157 0.015514816 0.016218139 0.020660107 0.022452248 0.031207506 0.033390424 0.021389829 0.02744983 0.026132259 0.029137321 0.035233998 0.08592022 0.038338511 0.10576098 0.039258979 0.052483359 0.025425308 0.075243363 0.017024615 0.076123626 0.062622027 0.082901312 0.010846417 0.13600748 0.022858696 0.03085 0.010801564 0.011383755 0.014976601 0.015607407 31
r . r.-bar 52 BUILDING CONSTRUCTION 0.020490602 0.12877376
53 OTHER CONSTRUCTION 0.028670064 0.13970146
54 WHOLESALE AND RETAIL TRADE 0.005288889 0.006768845 55 RESTAURANTS AND HOTELS 0.014320375 0.01501226
56 RAILWAY TRANSPORT 0.033029998 0.037426164
57 OTHER LAND TRANSPORT 0.028000173 0.029567275
58 WATER TRANSPORT 0.023938593 0.025767206
59 AIR TRANSPORT 0.017403639 0.01818926
60 COMMUNICATION 0.020992682 0.022369247
61 FINANCIAL INSTITUTIONS AND INSURANCE 0.004514181 0.004695949 62 PERSONAL AND PROFESSIONAL SERVICES 0.023028422 0.02395852
63 PUBLIC SERVICES 0 0 64 OWNERSHIP OF DWELLINGS 0.004278654 0.004388224 Notes: r = 5% r . ‘ = r xA"’ x[l-A '*]·' > ,· = r ‘ X A" X [I - A* ]·’ 32
Table 11.1. Domestic effective taxes 1 AGRICULTURE ANIMAL HUSBANDRY FORESTRY FISHERIES COAL MINING
6 CRUDE PETROLEUM AND NATURAL GAS PRODUCTION 7 IRON ORE MINING
8 NON-FERROUS ORE MINING 9 NON-METALLIC MINERAL MINING 10 STONE QUARRYING
11 SLAUGHTERING. PREPARING AND PRESERVED MEAT 12 CANNING AND PRESERVING OF FRUITS AND VEGETABLES 13 MANUFACTURE OF VEGETABLE AND ANIMAL OILS AND FATS 14 GRAIN MILL PRODUCTS
15 SUGAR
16 MANUFACTURE OF OTHER FOOD PRODUCTS 17 ALCOHOLIC BEVERAGES
18 SOFT DRINKS AND CARBONATED WATER INDUSTRIES 19 TOBACCO MANUFACTURES
20 GINNING
21 MANUFACTURE OF TEXTILES (exc. ginning) 22 MANUFACTURE OF WEARING APPAREL 23 MANUFACTURE OF LEATHER AND FUR PRODUCTS 24 MANUFACTURE OF FOOTWEAR
25 MANUFACTURE OF WOOD AND WOOD PRODUCTS 26 MANUFACTURE OF WOOD FURNITURE AND FIXTURES 27 MANUFACTURE OF PAPER AND PAPER PRODUCTS 28 PRINTING. PUBLISHING AND ALLIED INDUSTRIES 29 MANUFACTURE OF FERTILIZERS
30 MANUFACTURE OF DRUGS AND MEDICINES 31 MANUFACTURE OF OTHER CHEMICAL PRODUCTS 32 PETROLEUM REFINERIES
33 MANUFACTURE OF PETROLEUM AND COAL PRODUCTS 34 MANUFACTURE OF RUBBER PRODUCTS
35 MANUFACTURE OF PLASTIC PRODUCTS 36 MANUFACTURE OF GLASS AND GLASS PRODUCTS 37 MANUFACTURE OF CEMENT
38 MANUFACTURE OF OTHER NON-METALLIC MINERAL PRODUCTS 39 MANUFACTURE OF IRON AND STEEL
40 MANUFACTURE OF NON-FERROUS METAL 41 MANUFACTURE OF FABRICATED METAL PRODUCTS 42 MANUFACTURE OF MACHINERY EXCEPT ELECTRICAL
43 MANUFACTURE OF AGRICULTURAL MACHINERY AND EQUIPMENT 44 MANUFACTURE OF ELECTRICAL MACHINERY
45 MANUFACTURE OF SHIPBUILDING AND REPAIRING 46 MANUFACTURE OF RAILROAD EQUIPMENT
47 MANUFACTURE OF LAND TRANSPORT VEHICLES AND EQUIPMENT 48 MANUFACTURE OF OTHER TRANSPORT EQUIPMENT
49 OTHER MANUFACTURING INDUSTRIES 50 ELECTRICITY
51 GAS MANUFACTURE AND WATERWORKS
t-. t'.-bar f^bar 0.006196895 0.007228789 0.018178233 0.008892908 0.009582382 0.009168545 0.028459502 0.029985755 0.013744247 0.03063285 0.031351281 0.025912315 0.047580297 0.048502446 0.026999576 0.02864591 0.029254758 0.012472262 0.059036093 0.060719321 0.047955148 0.051695321 0.079539042 0.061293427 0.041542402 0.062768299 0.032614314 0.057760148 0.059181313 0.022672932 0.020200545 0.020998322 0.018730542 0.027672917 0.028778234 0.020828722 0.028923046 0.031042651 0.027056965 0.027785688 0.029760082 0.015718627 0.022594325 0.027196727 0.032037599 0.027651199 0.028848006 0.025231233 0.16605837 0.16650641 0.01644184 0.13135955 0.13349835 0.02857744 0.10449472 0.10535801 0.009122284 0.023367375 0.041282878 0.026425135 0.054912935 0.056606863 0.037760255 0.045322731 0.046886718 0.03651311 0.032015675 0.033824765 0.020542246 0.038285074 0.041277699 0.030440108 0.021381442 0.021996584 0.021471368 0.035978005 0.040037979 0.019702469 0.04634612 0.047394302 0.038455906 0.094085811 0.094858657 0.035156637 0.049385012 0.050887032 0.042282481 0.034344162 0.03483191 0.02508104 0.053806998 0.05495771 0.052080328 0.2679936 0.27153412 0.00795458 0.10347291 0.11272972 0.116280374 0.04915062 0.050075833 0.046697458 0.050403824 0.051289454 0.032684398 0.046266211 0.04726704 0.0302284 0.044650423 0.045424067 0.032890588 0.05887478 0.061011338 0.039021354 0.055405462 0.05761046 0.046816172 0.034617763 0.040204137 0.03761711 0.039784013 0.042981049 0.031971873 0.025741746 0.076812538 0.073173814 0.047780798 0.12427212 0.114979751 0.052317895 0.065763948 0.03684696 0.032315592 0.083320041 0.07973947 0.02555462 0.092421174 0.088737248 0.09524263 0.11563668 0.056103598 0.024779012 0.12786329 0.119034714 0.083578115 0.092049543 0.02763213 0.094934979 0.095512713 0.014846663 0.033661584 0.034321479 0.029163039 33
t-· f-Mi-bar 52 BUILDING CONSTRUCTION 0.04732319 0.1719134 0.150523581 53 OTHER CONSTRUCTION 0.058346561 0.18591688 0.181593383 54 WHOLESALE AND RETAIL TRADE 0.032045277 0.033733283 0.021519445 55 RESTAURANTS AND HOTELS 0.049923944 0.050693655 0.028953251 56 RAILWAY TRANSPORT ^.12353147 -0.11867428 0.07674197 57 OTHER LAND TRANSPORT 0.054773333 0.056473732 0.048782513 58 WATER TRANSPORT 0.046991829 0.048894102 0.050555883
59 AIRTRANSPORT 0.043508817 0.044288417 0.038149959
60 COMMUNICATION 0.11134406 0.11276466 • 0.01575441
61 FINANCIAL INSTITUTIONS AND INSURANCE 0.12681 0.1270013 0.02272772 62 PERSONAL AND PROFESSIONAL SERVICES 0.11757583 0.11855131 0.023720813
63 PUBLIC SERVICES 0 0 0 64 OWNERSHIP OF DWELLINGS 0.081100629 0.081219844 0.007686767 Notes: r = 3% t^ ,‘ = r " x I l- A " ] · ' ‘ r ' d « 34
Table 11.2. Domestic effective taxes 1 AGRICULTURE 2 ANIMAL HUSBANDRY 3 FORESTRY 4 FISHERIES 5 COAL MINING
6 CRUDE PETROLEUM AND NATURAL GAS PRODUCTION 7 IRON ORE MINING
8 NON-FERROUS ORE MINING 9 NON-METALLIC MINERAL MINING 10 STONE QUARRYING
11 SLAUGHTERING. PREPARING AND PRESERVED MEAT 12 CANNING AND PRESERVING OF FRUITS AND VEGETABLES 13 MANUFACTURE OF VEGETABLE AND ANIMAL OILS AND FATS 14 GRAIN MILL PRODUCTS
15 SUGAR
16 MANUFACTURE OF OTHER FOOD PRODUCTS 17 ALCOHOLIC BEVERAGES
1 a SOFT DRINKS AND CARBONATED WATER INDUSTRIES 19 TOBACCO MANUFACTURES
20 GINNING
21 MANUFACTURE OF TEXTILES (exc. ginning) 22 MANUFACTURE OF WEARING APPAREL 23 MANUFACTURE OF LEATHER AND FUR PRODUCTS 24 MANUFACTURE OF FOOTWEAR
25 MANUFACTURE OF WOOD AND WOOD PRODUCTS 26 MANUFACTURE OF WOOD FURNITURE AND FIXTURES 27 MANUFACTURE OF PAPER AND PAPER PRODUCTS 28 PRINTING. PUBLISHING AND ALLIED INDUSTRIES 29 MANUFACTURE OF FERTILIZERS
30 MANUFACTURE OF DRUGS AND MEDICINES 31 MANUFACTURE OF OTHER CHEMICAL PRODUCTS 32 PETROLEUM REFINERIES
33 MANUFACTURE OF PETROLEUM AND COAL PRODUCTS 34 MANUFACTURE OF RUBBER PRODUCTS
35 MANUFACTURE OF PLASTIC PRODUCTS 36 MANUFACTURE OF GLASS AND GLASS PRODUCTS 37 MANUFACTURÉ OF CEMENT
38 MANUFACTURE OF OTHER NON-METALLIC MINERAL PRODUCTS 39 MANUFACTURE OF IRON AND STEEL
40 MANUFACTURE OF NON-FERROUS METAL 41 MANUFACTURE OF FABRICATED METAL PRODUCTS 42 MANUFACTURE OF MACHINERY EXCEPT ELECTRICAL
43 MANUFACTURE OF AGRICULTURAL MACHINERY AND EQUIPMENT 44 MANUFACTURE OF ELECTRICAL MACHINERY
45 MANUFACTURE OF SHIPBUILDING AND REPAIRING 46 MANUFACTURE OF RAILROAD EQUIPMENT
47 MANUFACTURE OF LAND TRANSPORT VEHICLES AND EQUIPMENT 48 MANUFACTURE OF OTHER TRANSPORT EQUIPMENT
49 OTHER MANUFACTURING INDUSTRIES 50 ELECTRICITY
51 GAS MANUFACTURE AND WATERWORKS
t-. r*.-bar l^#<bar 0.006196895 0.007690858 0.018640302 0.008892908 0.009891119 0.009477283 0.028459502 0.030669192 0.014427684 0.03063285 0.031672986 0.02623402 0.047580297 0.048915372 0.027412502 0.02864591 0.029527393 0.012744897 0.059036093 0.061473049 0.048708876 0.051695321 0.092007107 0.073761492 0.041542402 0.072272987 0.042119002 0.057760148 0.059817692 0.023309311 0.020200545 0.021355557 0.019087777 0.027672917 0.029273181 0.021323669 0.028923046 0.031991783 . 0.028006097 0.027785688 0.030644491 0.016602736 0.022594325 0.029257625 0.034098497 0.027651199 0.029383921 0.025767148 0.16605837 0.16670704 0.01654247 0.13135955 0.13445608 0.02953517 0.10449472 0.10574458 0.009508854 0.023367375 0.049305213 0.03444747 0.054912935 0.057365382 0.038518774 0.045322731 0.047587051 0.037213443 0.032015675 0.034634853 0.021352334 0.038285074 0.042617758 0.031780167 0.021381442 0.022272036 0.02174682 0.035978005 0.041855984 0.021520474 0.04634612 0.047863665 0.038925269 0.094085811 0.095204727 0.035502707 0.049385012 0.051559617 0.042955066 0.034344162 0.035050318 0.025299448 0.053806998 0.055472984 0.052595602 0.2679936 0.27311952 0.00953998 0.10347291 0.1168748 0.120425454 0.04915062 0.050490131 0.047111756 0.050403824 0.051686028 0.033080972 0.046266211 0.047715199 0.030676559 0.044650423 0.045770495 0.033237016 0.05887478 0.061968061 0.039978077 0.055405462 0.05859783 0.047803542 0.034617763 0.042705645 0.040118618 0.039784013 0.044412641 0.033403465 0.025741746 0.099681391 0.096042667 0.047780798 0.15852396 0.149231591 0.052317895 0.071784921 0.042867933 0.032315592 0.10615919 0.102578619 0.02555462 0.12236317 0.118679244 0.09524263 0.12476887 0.065235788 0.024779012 0.17402312 0.165194544 0.083578115 0.095842942 0.031425529 0.094934979 0.095771415 0.015105365 0.033661584 0.034616972 0.029458532 35
t-. t^.-bar f-ffbar 52 BUILDING CONSTRUCTION 0.04732319 0.22770332 0.206313501 #53 OTHER CONSTRUCTION 0.058346561 0.24304125 0.238717753 54 WHOLESALE AND RETAIL TRADE 0.032045277 0.034489151 0.022275313 55 RESTAURANTS AND HOTELS 0.049923944 0.051038322 0.029297918 56 RAILWAY TRANSPORT -0.12353147 •0.11649929 0.07891696 57 OTHER LAND TRANSPORT 0.054773333 0.05723515 0.049543931 58 WATER TRANSPORT 0.046991829 0.049745916 0.051407697
59 AIR TRANSPORT 0.043508817 0.044637511 0.038499053
60 COMMUNICATION 0.11134406 0.11340078 0.01639053
61 FINANCIAL INSTITUTIONS AND INSURANCE 0.12681 0.12708696 0.02281338 62 PERSONAL AND PROFESSIONAL SERVICES 0.11757583 0.11898811 0.024157613
63 PUBLIC SERVICES 0 0 0
64 OWNERSHIP OF DWELLINGS 0.081100629 0.081273227 0.00774015
Notes; r = 4%
t " . ‘ = t^'x [ l - A " ] · ’
Table 11.3. Domestic effective taxes AGRICULTURE ANIMAL HUSBANDRY FORESTRY FISHERIES COAL MINING
6 CRUDE PETROLEUM AND NATURAL GAS PRODUCTION 7 IRON ORE MINING
8 NON-FERROUS ORE MINING 9 NON-METALLIC MINERAL MINING 10 STONE QUARRYING
11 SLAUGHTERING. PREPARING AND PRESERVED MEAT 12 CANNING AND PRESERVING OF FRUITS AND VEGETABLES 13 MANUFACTURE OF VEGETABLE AND ANIMAL OILS AND FATS 14 GRAIN MILL PRODUCTS
15 SUGAR
16 MANUFACTURE OF OTHER FOOD PRODUCTS 17 ALCOHOLIC BEVERAGES
18 SOFT DRINKS AND CARBONATED WATER INDUSTRIES 19 TOBACCO MANUFACTURES
20 GINNING
21 MANUFACTURE OF TEXTILES (exc. ginning) 22 MANUFACTURE OF WEARING APPAREL 23 MANUFACTURE OF LEATHER AND FUR PRODUCTS 24 MANUFACTURE OF FOOTWEAR
25 MANUFACTURE OF WOOD AND WOOD PRODUCTS 26 MANUFACTURE OF WOOD FURNITURE AND FIXTURES 27 MANUFACTURE OF PAPER AND PAPER PRODUCTS 28 PRINTING. PUBLISHING AND ALLIED INDUSTRIES 29 MANUFACTURE OF FERTILIZERS
30 MANUFACTURE OF DRUGS AND MEDICINES 31 MANUFACTURE OF OTHER CHEMICAL PRODUCTS 32 PETROLEUM REFINERIES
33 MANUFACTURE OF PETROLEUM AND COAL PRODUCTS 34 MANUFACTURE OF RUBBER PRODUCTS
35 MANUFACTURE OF PLASTIC PRODUCTS 36 MANUFACTURE OF GLASS AND GLASS PRODUCTS 37 MANUFACTURE OF CEMENT
38 MANUFACTURE OF OTHER NON-METALLIC MINERAL PRODUCTS 39 MANUFACTURE OF IRON AND STEEL
40 MANUFACTURE OF NON-FERROUS METAL 41 MANUFACTURE OF FABRICATED METAL PRODUCTS 42 MANUFACTURE OF MACHINERY EXCEPT ELECTRICAL
43 MANUFACTURE OF AGRICULTURAL MACHINERY AND EQUIPMENT 44 MANUFACTURE OF ELECTRICAL MACHINERY
45 MANUFACTURE OF SHIPBUILDING AND REPAIRING 46 MANUFACTURE OF RAILROAD EQUIPMENT
47 MANUFACTURE OF LAND TRANSPORT VEHICLES AND EQUIPMENT 48 MANUFACTURE OF OTHER TRANSPORT EQUIPMENT
49 OTHER MANUFACTURING INDUSTRIES 50 ELECTRICITY
51 GAS MANUFACTURE AND WATERWORKS
t-. t^,-bar I'-Mrbar 0.006196895 0.008239704 0.019189148 0.008892908 0.010257838 . 0.009844002 0.028459502 0.031480979 0.015239471 0.03063285 0.032055107 0.026616141 0.047580297 0.049405847 0.027902977 0.02864591 0.029851229 0.013068733 0.059036093 0.062368329 0.049604156 0.051695321 0.1068167 0.088571085 0.041542402 0.083562674 0.053408689 0.057760148 0.060573585 0.024065204 0.020200545 0.021779881 0.019512101 0.027672917 0.029861079 0.021911567 0.028923046 0.033119164 0.029133478 0.027785688 0.031694337 0.017652882 0.022594325 0.031705563 0.036546435 0.027651199 0.030020482 0.026403709 0.16605837 .0.16694534 0.01688077 0.13135955 0.13559367 0.03067276 0.10449472 0.10620375 0.009968024 0.023367375 0.058834159 0.043976416 0.054912935 0.058266353 0.039419745 0.045322731 0.048418909 0.038045301 0.032015675 0.035597076 0.022314557 0.038285074 0.044209484 0.033371893 0.021381442 0.022599219 0.022074003 0.035978005 0.044015414 0.023679904 0.04634612 0.048421175 0.039482779 0.094085811 0.095615791 0.035913771 0.049385012 0.052358515 0.043753964 0.034344162 0.035309743 0.025558873 0.053806998 0.056085028 0.053207646 0.2679936 0.27500266 0.01142312 0.10347291 0.12179833 0.125348984 0.04915062 0.050982236 0.047603861 0.050403824 0.052157079 0.033552023 0.046266211 0.048247522 0.031208882 0.044650423 0.046181983 0.033648504 0.05887478 0.063104459 0.041114475 0.055405462 0.059770631 0.048976343 0.034617763 0.04567694 0.043089913 0.039784013 0.04611309 0.035103914 0.025741746 0.12684506 0.123206336 0.047780798 0.19920837 0.189916001 0.052317895 0.078936644 0.050019656 0.032315592 0.13328757 0.129706999 0.02555462 0.15792833 0.154244404 0.09524263 0.13561611 0.076083028 0.024779012 0.22885186 0.220023284 0.083578115 0.10034875 0.035931337 0.094934979 0.096078702 0.015412652 0.033661584 0.034967959 0.029809519 37
f.-bar f^rbar 52 BUILDING CONSTRUCTION 0.04732319 0.29397069 0.272580871 53 OTHER CONSTRUCTION 0.058346561 0.3108937 0.306570203 54 WHOLESALE AND RETAIL TRADE 0.032045277 0.035386973 0.023173135 55 RESTAURANTS AND HOTELS 0.049923944 0.051447719 0.029707315 56 RAILWAY TRANSPORT -0.12353147 •0.11391584 0.08150041 57 OTHER LAND TRANSPORT 0.054773333 0.058139563 0.050448344
58 WATER TRANSPORT 0.046991829 0.050757702 0.052419483
59 AIR TRANSPORT 0.043508817 0.045052167 0.038913709
60 COMMUNICATION 0.11134406 0.11415637 0.01714612
61 FINANCIAL INSTITUTIONS AND INSURANCE 0.12681 0.12718871 0.02291513 62 PERSONAL AND PROFESSIONAL SERVICES 0.11757583 0.11950695 0.024676453
63 PUBLIC SERVICES 0 0 0
64 OWNERSHIP OF DWELLINGS 0.081100629 0.081336635 0.007803558
Notes; r = 5%