Algorithms for Direct Volume Rendering
on Distributed-Memory Multicomputers
Egemen Tanin, Tahsin M. Kurd, Cevdet Aykanat, Biilent C)zgii~ Dept. of Computer Eng. and Information Sci.
Bilkent University, Bilkent 06533, Ankara - TURKEY
A b s t r a c t . Direct Volume Rendering (DVR) is a powerful technique for visualizing volumetric data sets. However, it involves intensive computa- tions. In addition, most of the volumetric data sets consist of large num- ber of 3D sampling points. Therefore, visualization of such data sets also requires large computer memory space. Hence, DVR is a good candidate for parallelization on distributed-memory multicomputers. In this work, image-space paraJ]elization of Raycasting based DVR for unstructured grids on distributed-memory multicomputers is presented and discussed. In order to visualize unstructured volumetric datasets where grid points of the dataset are irregularly distributed over the 3D space, the underly- ing algorithms should resolve the point location and view sort problems of the 3D grid points. In this paper, these problems are solved using a Scanline Z-buffer based algorithm. Two image space subdivision heuris- tics, namely horizontal and recursive rectangular subdivision heuristics, are utilized to distribute the computations evenly among the processors in the rendering phase. The horizontal subdivision algorithm divides the image space into horizontal bands composed of consecutive scanlines. In the recursive subdivision algorithm, the image space is divided into rectangular subregions recursively. The experimental performance eval- uation of the horizontal and recursive subdivision algorithms on an IBM SP2 system are presented and discussed.
1
I n t r o d u c t i o n
Direct Volume Rendering (DVR) is a technique to create an image from the three-dimensional volume d a t a without generating an intermediate geometrical representation. Usually, volume d a t a is represented by 3D voxels which constitute the atomic pieces of the overall d a t a structure. One of the approaches used in direct volume rendering for visualizing these 3D voxel based d a t a sets is Raycasting, which is the basis of this research. This approach is an image-space approach and mainly uses ray shooting from each pixel of the image plane and sampling along its way [6, 7, 9]. In order to visualize unstructured volumetric d a t a sets, where grid points of the d a t a set are distributed irregularly over 3D space, the underlying algorithms should resolve the point location and view sort problems. T h e point location p r o b l e m refers to the determination of the location
of the point of intersection of the ray with an individual voxel in the whole data set. The view sort problem refers to the determination of the correct intersection order of the ray with the voxels along its way. In this paper, the point location and the view sort problems are solved using a
Scanline Z-buffer
based algorithm, which is introduced by [1, 2] in volume rendering domain. The reason for this is to solve the problem of fast point location determination process and view sorting efficiently for unstructured grids.Although DVR is a common tool for visualization, it operates on volume data representation that requires a large amount of memory. DVR is also very slow since it requires massive computations for each image generation. So interactive speed rates are very hard to achieve. An important approach to solve the speed and memory problems of volume rendering is to employ parallel processing. Fur- thermore, many engineering simulations are usually run on parallel architectures because of simulation time and memory constraints. Therefore, visualizing the results on the same parallel architecture avoids the cost of transferring large volume of data to sequential graphics workstations for visualization process.
Most of the work for parallelization of DVR has been carried out using struc- tured grids [3, 4, 5]. Recently some parallel methods have been developed for unstructured grids [1, 2] which form a basis for this research. These recent ap- proaches are done on shared memory architectures which does not solve many of the problems of volume rendering on distributed-memory architectures. These approaches use scattered decomposition for task distribution and hence can be effectively used in shared memory architectures. However, such decomposition schemes will incur large communication overhead in distributed-memory archi- tectures.
Although parallel volume rendering of rectilinear grids has been accomplished to a great degree, domain mapping problem for unstructured grids is a crucial problem to be solved. This paper investigates the parallelization of Raycasting based DVR for unstructured grids. In this work, an image-space parallel algo- rithm for DVR on distributed-memory MIMD architectures is presented and two load balancing heuristics are proposed to distribute the load evenly in rendering phase. Experimental results on an 8 node IBM SP2 architecture are presented and discussed. This target architecture is a distributed-memory multicomputer. The nodes of the IBM SP2 are connected by a multi-stage interconnection net- work.
2 R a y c a s t i n g B a s e d D V R
The high quality of the images produced by the raycasting approach makes it a desirable choice for DVR. In this approach a ray is shot from each pixel and tra- versed throughout the whole volume to determine the list of voxel intersections. Each voxel intersection means an entry/exit point of the ray with the voxel. For each voxel intersection, a sampling is computed at the midpoint of the ray between its entry and exit points by interpolating the scalar values at the grid points of the intersected voxel. The voxel intersections should be traversed in a predetermined order (front-to-back in our case) for the composition of sampled
color and opacity values. Ray shooting, sampling, and finally composition steps require the detection of the position of the sampling point in the whole d a t a and finding the next (therefore previous) voxels to be intersected with the ray for composition. These operations bring tremendous amount of computation to the process of raycasting. Therefore, finding the consecutive intersections and the locations of the sampling points should be done efficientlyi which we refer to as efficient point locating and view sorting operations. "
In this work, we exploit the Scanline Z-buffer algorithm widely used in poly- gon rendering to resolve the point location and view sort problems. T h e same idea has been recently used in the parallelization of DVR on shared-memory multiprocessors [1, 2]. The standard Scanline Z-buffer algorithm is used for ras- terizing the polygons but the only deviation occurs in the rendering step where in volume rendering each pixel keeps a linked list of polygons for compositing and finding a final pixel color value. Therefore, the overall algorithm needs only polygonal data to be rendered. Note that volume data composed of tetrahedrals is already in polygonal form where each tetrahedral is composed of four triangles. The set of distinct triangles can be extracted easily from this tetrahedral d a t a set. Therefore, for such data sets traversing triangles along the ray is equivalent to traversing the voxel data itself. For other types of data sets, triangulation should also be done by just connecting original sample points in a way that we will have a set of polygons in the final dataset. This operation once completed can be saved and used forever. Algorithms exist for triangulating a given volu- metric dataset [8]. Here, and hereafter, we will mainly assume triangles as our inputs for the sake of simplicity. The Scanline Z-buffer based algorithm is given in Fig. 1 as a flow-chart.
In the proposed algorithm, we move from scanline to scanline and from pixel to pixel one-by-one. Initially, each polygon is placed into the y-bucket list of the first scanline that the polygon is intersected with. The polygons intersected by the current scanline are put into the active polygon list. The x-intersection points of polygons with the current scanline generate spans of the polygons on that scanline. The generated spans are put into the x-bucket list and sorted with respect to minimum x-intersections using x-bucket sort. The calculations of intersections of polygons with the scanline, insertion and deletion operations on the active polygon list are done incrementally using inter-scanline coherency. For each pixel on the current scanline, the intersection of the ray shot from the pixel and spans that cover that pixel are determined and put into the z-list, which is a sorted linked list, in the order of increasing z-intersection values. The z-intersection calculations, sorting of z-intersection values, insertion to and deletion from z-list are done incrementally using intra-scanline coherency. As we know the location of each intersection of the active polygon with the ray and as the list is built in an incremental fashion, we can say that we just have an array of sorted intersections with a three dimensional line and a set of planes. For a single pixel, after the intersections are found, we can go through the list and take samples between each successive pair of triangles and composite it into the pixel color.
(Start)
Read polygonal data
I Do viewing and initializations
I Y-bucket sort I
1
For each new scanline update active polygon and edge lists
t . . . / . . . t
For each active edge pair on I
I
this scanline generate a span and put it into the x-bucket
Show result and quit system
I
If last scanlinr is no
If last scanline is yes
Step t direction
For each pixel on the scanlinc update z-list with n e w spans and old spans
I - I
i
, For each polygon *~
t
in the z-list of a pixel ~
i
' do interpolation with ~l
I I
I
, its twin polygon, map , !
9 , to color and opacity, and ~
I
sort and update scanlinc info - , composite it into the pixel ~,
for this step ] I L . . .
Fig. 1. Flow chart of the sequential algorithm.
3 P a r a l l e l I m p l e m e n t a t i o n
The parallel algorithm presented in this section is an image-space parallel al- gorithm. In image-space parallelism, the image plane is partitioned among the processors. Then, each processor runs a sequential volume rendering algorithm to generate the image for its local image plane sections. Each processor needs 9 the volume data which is covered by the view volume of the local image plane regions. Therefore, the volume data is also partitioned and distributed to the processors according to the partitioning of the image plane. The parallel algo- rithm consists of four main steps.
At the first step, the global volume data is evenly partitioned and distributed among the processors so that each processor receives a distinct set of
NT/P
triangles (polygons), where
NT
is the number of triangles and P is the number of processors.At step 2, the image space is partitioned into P regions and each region is assigned to a processor. The partitioning of the image space should be done to achieve a good computational load balance. Two strategies to achieve this goal is presented and discussed in the next sections. The triangle set received at the first step is utilized to perform an adaptive division of the image plane.
After the partitioning and assignment of the image plane, each processor needs triangles which fall into the view volume of the local image plane partition.
The local triangle data set may contain triangles that belong to image plane partitions assigned to other processors. Similarly, some of the triangles that are covered by the view volume of local image plane section may reside in the local memories of other processors. Therefore, at step 3, some of the triangles - hence, volume data - should be exchanged among the processors. Each processor finds the image plane region a triangle belongs to by performing projection and clipping operations and sends the triangle to the corresponding processor and receives triangles that fall into its local image plane region. Note that the triangles at the boundaries of image plane partitions will be shared by two or more processors. Hence, such triangles may be transmitted more than once.
At step 4, each processor runs the sequential volume rendering algorithm for its local image plane section using new local volume data without further inter-processor communication.
3.1 L o a d B a l a n c i n g
In many scientific applications, the volume data to be visualized is not regularly sampled and distributed in 3D space. Hence, the computational work load on the image space will also be irregularly distributed. In addition, different viewing locations will result in different work load distribution on the image space. Hence, a straightforward division of image plane into equal size regions may result in very poor load balance among the processors due to the nature of the volume data. Therefore, an adaptive division of image plane will generate better work load distribution and better processor utilization.
There are three parameters that affect the computational work load in a im- age plane section. First one is the number of triangles, because the total work load due to clipping of a triangle to boundaries and insertion operations into y-bucket and active polygon lists are proportional to the number of triangles in a region. The second parameter is the number of scanlines each triangle spans. This parameter represents the computational work load associated with the con- struction of x-spans, and insertion of these spans into x-bucket list. The total number of pixels generated by rasterization of x-spans of a triangle is the third parameter affecting the computational load in a region. Each pixel generated adds computations required for sorting, insertions to and deletions from z-list, interpolation and composition operations. The y-span of each triangle gives the number of scanlines covered by the triangle. Hence, the number of triangles at each scanline can easily and correctly be calculated using y-span of each triangle. However, the length of the x-span at each individual scanline requires rasterizing edges of the triangle. This computational overhead can be decreased by using the bounding box of the triangle instead of triangle itself. The x-span length at each scanline is approximated by the x-span of the bounding box.
The two subdivision heuristics presented in the following sections use these parameters to estimate the work load ( W L ) in a region using Eq. (1).
where
NT, N..r
andNp
represent the number of triangles, spans, and pixels, respectively, to be processed in, a region. The values a, b, c represent the relative computational costs of operations associated with triangles, spans, and pixels, respectively.3.2 H o r i z o n t a l S u b d i v i s i o n
In this scheme, the image plane is subdivided into P horizontal bands of consec- utive scanlines such that each band has almost equal work load. The division of the image plane is carried out using the distribution of work load in y-dimension of the image plane. Dividing the image plane into bands of consecutive scanlines preserves the inter-scanline coherency to some extent.
Each processor calculates local work load distribution using local triangle information. The work load distribution for each parameter (triangle, span and pixel) is stored in separate arrays. The global work load distribution is calcu- lated by performing a global sum operation on these arrays. This global sum operation can be done in
log2P
steps for each array using the communication structure of the IBM SP2. At the end of global sum operation, each proces- sor has global work load distribution in y-dimension of the image plane. Using this work load distribution information, the image plane is divided horizontal bands. An example of horizontal subdivision scheme is illustrated in Fig. 2. After the division operation, each processor exchanges local triangle information with other processors according to the subdivision of the screen. The local triangles that project to the region of another processor are transmitted directly to that processor.In this scheme, the atomic task is defined to be a scanline, i.e., scanlines are not divided. In this way, intra-scanline coherency is not disturbed. However, the image plane is partitioned in only one dimension, namely y-dimension. Due to this restriction, the scalability of horizontal division scheme is limited by the number of scanlines. In addition, the work load at each region is determined by the work load at each scanline. Hence, if there are large differences in the work loads of scanlines, the load imbalance between regions may still be large. These limitations of the horizontal subdivision can be eliminated to some extent by using subdivision in both dimensions of the screen. The recursive rectangu- lar subdivision scheme that implements this idea is described in the following section.
3.3 R e c u r s i v e R e c t a n g u l a r S u b d i v i s i o n
In recursive rectangular subdivision (recursive subdivision) scheme, the image plane is divided into P rectangular regions in
log2P
steps. In this work, the num- ber of processors (P) is assumed to be a power of two. This scheme is similar to the horizontal division scheme. The same data structures and load balancing parameters are used. However, unlike horizontal division scheme, load distribu- tion in two dimensions are used to obtain a division. Therefore, data structuresP 0
iiiiiiiiiiiii
...
... r~...iiiiiiiiiiiii
P 4 . . . P 5 . . . . . . . .P.~. ~ ~ 1"7 F O ~ o o o o o o , P 4 P 6 P 1 P 2 P 7Fig. 2. An example of horizontal (left) and recursive (right) subdivision for eight pro- cessors. The regions are separated by dotted hnes.
used for load distribution in y-dimension are duplicated for load distribution in x-dimension.
At the first step, each processor is assigned the whole screen as its local image region. Each processor, then, updates its local copy of the global work load arrays using the local object data. The work load distribution in two dimensions are obtained by performing global sum operations on these arrays. Then, each processor divides its local image region into two subregions either horizontally or vertically. The division that achieves better load balance is chosen. After the division, half of the processors are assigned to one of the regions, and the other half of the processors are assigned to the other region. After each processor is assigned to a image region, it exchanges volume d a t a with processors assigned to the other region. After this exchange operation, each processor has some portion of the volume data that projects onto its local image region. T h e division operation is repeated for new image region using new local volume data. After
Iog~P
steps, each processor is assigned a unique rectangular region of the screen.An example of recursive subdivision is given in Fig. 2.
Although there are similarities between two subdivision schemes, the over- heads introduced are not the same. In horizontal subdivision scheme, only inter- scanline coherence is disturbed while intra-scanline coherence is preserved. How- ever, recursive subdivision scheme may disturb both the inter-scanline and intra- scanline coherence. The disturbance in the inter-scanline and intra-scanline co- herency introduces run-time overheads which are hard to estimate a priori. In addition, the use of bounding box approximation may introduce more errors in recursive subdivision scheme than horizontal subdivision scheme. The number of triangles and number of spans in a region calculated by bounding box approx- imation may differ from the actual amounts for a rectangular region created by vertical subdivision. However, bounding box approximation does not introduce these errors in horizontal subdivision. Furthermore, unlike horizontal subdivision scheme, the volume data is exchanged during the division phase of the recursive
subdivision scheme. Hence, the volume data is not directly sent to the destination processors. It is stored in the memories of the intermediate processors at each step of the division until it reaches to the destination processor. This store-and- forward type of communication structure introduces m e m o r y - t o - m e m o r y copy overhead. Therefore, although recursive subdivision scheme increases scalability, it may perform worse than horizontal subdivision scheme due to the errors and overheads introduced.
4 E x p e r i m e n t a l R e s u l t s
The implementations of the algorithms presented in this paper were done in C language using the message-passing constructs of IBM SP2. The algorithms were tested on a d a t a set composed of 409600 distinct triangles for two screen resolutions, 256x256 and 512x512. The timing results presented in the graphs are the average of viewings at three different view points for each of the screen resolutions.
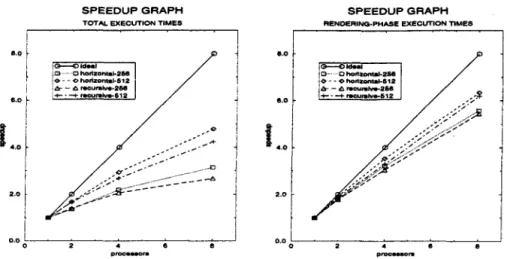
The speedup graphs for total execution time and rendering-phase are given in Fig. 3. As is seen from the figure, the horizontal subdivision scheme achieves higher speedup values than the recursive scheme. Although recursive scheme uti- lizes subdivision in both dimensions of the screen, vertical divisions of the screen regions disturb intra-scanline coherency. The intra-scanline coherency is a crucial factor in the execution time, because it involves incremental sorting, insertion, and deletion operations into z-lists. As is also seen from the figures, the speedup values increase with increasing resolution of the screen due to the increase in the accuracy of work load distributions. Speedup values of 4.78 for total execution time and 6.34 for rendering-phase are achieved using the horizontal scheme for screen resolution of 512x512 on 8 processors.
Figure 4 illustrates the load-balance graphs for rendering phase. The load balance in the graphs is calculated as 100 x (1 - ((t,~a= -
train) / tma=)),
where trna+: andtrain
denote the execution times of the maximally and mini- mally loaded processors, respectively. As is seen from the figure, the recursive subdivision scheme achieves better load balancing with respect to estimated run times, which are calculated using Eq. (1). On the other hand, the horizontal scheme achieves better load balancing performance in real execution times. This is due to the disturbance of both inter-scanline and intra-scanline coherence in recursive subdivision scheme. Note that the load balance achieved in real exe- cution times is less than the one in estimated times. This is because of the fact that the disturbance of both inter-scanline and intra-scanline coherency results in run-time overhead that cannot be predetermined before execution. As is seen from the figure, load balance in estimated run times increases with increasing screen resolution due to better accuracy. As is also seen from the figure, the load balance for real run times also increases with increasing screen size for this data set. However, the run-time overheads introduced due to disturbance in inter-scanline and intra-scanline coherency m a y affect this behavior.B,0 6.0 I 4 . 0 S P E E D U P G R A P H TOTAL EXECUTION T | M E $
O.Oo~
!;::==:': /
9 .P- - "--~- re~umlve- S 12J
l 8.O J ~ S . O|.oI
2.0 [ 0.0 ! S P E E D U P G R A P HRENDER|NG.PHASE EXECUTION TIMES
O-.
~ h o d z ~ 4 ~ 2 S 6 <~ - - 4> h o d ~ k 6 1 2 ~ - -- ~ m c ~ n d v o - 2 r d S ~ - - '-'4- m a u m ~ 6 1 2Fig. 3. Speedup graphs of the horizontal and recursive division schemes for total and rendering-phase execution times.
L O A D - B A L A N C E G R A P H L O A D - B A L A N C E G R A P H
USING ESTIMATED EXECUTION TIMES USING REAL EXECUTION TIMES
110.O 110.0 ' " /
....
.~....
o
o ]
J
9o.oJ
e 0 . 0 7o.o. . . ::= ...
~--.,.- Q h o r i z o n t a t - 2 S e . . . . --5-__:_2 ~1
G - - O horizontal-812 ~ - -- ~ r e c u r s h , e - 2 s e s o . 0 40.0~O'0I
7O.O 30,O p ~ o l * procll~8Or$Fig. 4. Load-balance graphs of the horizontal and recursive division schemes. The graph on the left represents the load-balance using estimated rendering times. The graph on the right represents the actual load-balance obtained from the experimental results.
bdwld
I
~-...1~
horlloMtll.2~
- ~ ~> h~rtzonm~512 - --.4- reo~ml've-S 1 2 ~ - -- ~ r e r5
C o n c l u s i o n s
In this study, two image space subdivision m e t h o d s for direct v o l u m e rendering on distributed-memory multicomputers are compared. It is experimentally ob- served that horizontal subdivision scheme achieves better performance results than the recursive subdivision scheme. The horizontal subdivision scheme only disturbs inter-scanline coherency whereas recursive subdivision scheme disturbs intra-scanline coherency as well. Hence, recursive subdivision m e t h o d introduces run-time overhead in the rendering phase more than the horizontal subdivi- sion. Unfortunately, the costs of these run-time overheads cannot be determined
before execution. The intra-scanline coherency is much more crucial than the inter-scanline coherency. The intra-scanline coherency involves the incremental sorting of the linked lists with respect to z values of the intersections of the ray with volume elements. Hence, disturbance of this coherency results in re-sorting and re-calculation of these linked list values. In addition, a horizontal division of an image region only disturbs inter-scanline coherency, which affects only the scanlines at the boundaries of the two regions. However, a vertical division of an image plane disturbs the intra-scanline coherency at all scanlines in the region. Upon the deductions drawn from experimental results, we can conclude that horizontal scheme should be prefered to recursive scheme for small number of processors. However, for large number of processors, the recursive scheme is expected to achieve better performance results.
R e f e r e n c e s
1. ChaJlinger, J. Parallel Volume Rendering for Curvilinear Volumes. In Proceedings of the Scalable High Performance Computing Conference (1992), IEEE Computer Society Press, pp. 14-21.
2. Challinger, J. Scalable Parallel Volume Raycasting for Nonrectilinear Computa- tional Grids. In Proceedings of the Parallel Rendering Symposium (1993), IEEE Computer Society Press, pp. 81-88.
3. Corrie, B., and Mackerras, P. Parallel Volume Rendering and Data Coherence. In Proceedings of the Parallel Rendering Symposium (1993), IEEE Computer Society Press, pp. 23-26.
4. Elvins, T. T. Volume Rendering on a Distributed Memory Parallel Computer. In Proceedings of Visualization '92 (1992), IEEE Computer Society Press, pp. 93-98. 5. Hsu, W. M. Segmented Ray Casting For Data Parallel Volume Rendering. In Pro- ceedings of the Parallel Rendering Symposium (1993), IEEE Computer Society Press, pp. 7-14.
6. Levoy, M. Display of Surfaces From Volume Data. IEEE Computer Graphics and Applications 8, 3 (1988), pp. 29-37.
7. Levoy, M. Efficient Ray Tracing of Volume Data. ACM Transactions on Graphics 9, 3 (1990), pp. 245-261.
8. Shirley, P., and Tuchman, A. A Polygonal Approximation to Direct Scalar Volume Rendering. Computer Graphics 24, 5 (1990), pp. 63-70. In Proceedings of San Diego Workshop on Volume Visualization.
9. Upson, C., and Keeler, M. VBUFFER: Visible Volume Rendering. Computer Graphics 22, 4 (1988), pp. 59-64. In Proceedings of SIGGRAPH '88.