DOI: 10.20472/ES.2020.9.1.001
EXAMINING TIME-VARYING INTEGRITY AND
INTERRELATIONSHIPS AMONG GLOBAL STOCK MARKETS
HAZAR ALTINBAS
Abstract:
This paper examines co-movements and interrelationships among 6 emerging and 5 developed stock market returns between period 2001- 2017. First, principal components are extracted from returns. Results show that, for the period analyzed, there is no strong global stock market integration and there isn't any change in patterns of correlations of returns except short-term disturbances in global financial crisis time. Second, partial least squares regression models are used for predicting each stock market returns with other stock markets' current and all markets' up to three month lagged returns. Results identify divergence between developed and emerging markets and greater number of latent transmission channels among former ones. Findings indicate a strong integrity among global stock markets is not yet appeared and considered together with previous studies, today's international market structure can be attributed to last two decades of 20th century. International investors still may benefit from international portfolio diversification opportunities.
Keywords:
Stock market integration, principal components analysis, partial least squares regression, international portfolio diversification
JEL Classification: F36, G11, G15 Authors:
HAZAR ALTINBAS, Beykent University, Turkey, Email: [email protected]
Citation:
HAZAR ALTINBAS (2020). EXAMINING TIME-VARYING INTEGRITY AND INTERRELATIONSHIPS AMONG GLOBAL STOCK MARKETS. International Journal of Economic Sciences, Vol. IX(1), pp. 1-24.,
1 Introduction
Last four decades have witnessed remarkable growth of global financial system. Financial liberalization of economies is an important trigger of this growth. Theoretically, the more the economies remove barriers to foreign or domestic investors, the more they are expected to become integrated to the other capital markets and consequently, this may result with highly correlated returns. Since full integration imply low or zero benefits from risk diversification, the issue of market integration and return co-movements are thus of interest to policymakers and international portfolio investors. Revealing information and updating knowledge about dynamics of recent changes in integrity is a necessity.
As shown by Bekaert et al. (2011) and Lehkonen (2014), it is possible to say that markets have become more integrated to the world markets during the process of developing globalization of financial systems. With the term "globalization", it is mainly pointed that non-developed markets are integrating to developed markets, which are mentioned as world markets above. Not only just liberalization acts, but also regional economic co-operations and integration are other important driving forces behind financial globalization. One of the most important and powerful example of regional integration efforts is the formation of European Union. Syllignakis and Kouretas (2010), Caporale and Spagnolo (2012), Pasioura et al. (2013), and Bekaert et al. (2013) agree on improved linkages among most of the countries with the beginning of EU accession process. Introduction of Euro also has strong contribution for European stock markets integration. It leads to a more inter-connected structure among stock markets (Beine, Cosma and Vermeulen, 2010) with ups and downs (Hardouvelis, Malliaropulos and Priestley, 2006) but not influencing as EU accession (Bekaert et al., 2013). While improved integrity is seen for many member or candidate countries, this achievement is not valid for every part of Europe. Horvath and Petrovski (2013) show that Western Europe vis-a`-vis Central European stock markets' integration is higher than South Eastern European ones. On the other hand, in their study with 17 European countries covering 45 years after 1970, Everaert and Pozzi (2016) say that neither EU nor euro area membership has increased stock market integration.
Asian and Pacific markets' integrity has been another attractive research subject in recent years. Studies of Click and Plummer (2005) and Do, Bhatti and Konya (2016) reveal increasing market integration among ASEAN countries. In conjunction with these studies, works of Shabri Abd. Majid, Kameel Mydin Meera and Azmi Omar (2008) and Srivastava, Bhatia and Gupta (2015) also document increasing correlation between Asian countries and US. Lastly, Phylaktis (1997) and Loh (2013) find greater capital market integration between Asia-Pacific region with US. In the studies presented so far, conclusions are almost similar, however, there are other aspects and findings to be considered that are going to be discussed in Section 2.
In this study, measurement of stock market integration is based on examining co-movements of stock markets' monthly returns. Reason for choosing monthly frequency is to assess relations without concerns like non-overlapping market times, end-of-week effects and intra-day/ intra-week patterns. Novelty of this study is its methodological approach. Most of the studies in the literature use structured and/or regression-based methods to examine co-movements and integration among economies. Here, without employing any analyst dependent response data or forcing the data into a pre-determined model, a data-driven strategy is utilized. Also, searching and considering statistical changes by using information extracted from data give better understanding for co-movement variation and ensures more meaningful interpretation.
The study focuses on two points. First point is to understand time-varying co-relations without distinguishing transmission channels that result upward or downward moves with principal component analysis (PCA), an unsupervised learning technique. Second point is to reveal informativeness of current and lagged market returns on each market with partial least squares regression (PLSR), which is a supervised learning technique that benefits from the advantages of component (latent feature) identification procedures of the former method. Frequently used statistical and econometric methods in the area of finance have explicit assumptions about data, which inhibit examination of unanticipated and implicit relations and behaviors of markets. With the methods used in this study, there is an opportunity to surpass these drawbacks and make more realistic interpretations about outputs.
Findings suggest that there are some correlations between markets, and they do not have a significant time-varying variation. Comparative regression models show that predictability of a country's stock market returns with the information carried by other stock markets' returns and lagged returns relies on the economy's development level; developed markets tend to be more predictable than emerging markets. Results also point two countries to be discoursed, Japan and China. Japan stock market is distinguished from other developed markets in terms of statistical inferences and positioned close to emerging markets. China, which is an economy that has immense impact on nearly all world economies, displays some contrarian co-movements with the rest of countries and has the most unpredictable market returns.
Rest of the paper is organized as follows: Section 2 presents an extended literature, Section 3 describes data and Section 4 introduces methods used. In Section 5, results are shown. Conclusions and discussions are offered in Section 6. Descriptions for supplementary materials are in Appendix.
2 Literature
As stated by Bekaert, Harvey and Lundblad (2003) and Prasad et al. (2005), liberalization does not have to be pursued by an increase in the market's integration or as shown by Adler and Qi (2003), Donadelli (2013) and Do, Bhatti and Konya (2016) observable effects
do not show up simultaneously and/or promptly. Many studies show evidence for increased stock market integration, especially of emerging countries, which begins after early 90s and continues until late 90s or early 2000s but not result with a complete convergence (Adler and Qi, 2003; Hardouvelis, Malliaropulos and Priestley, 2006; Carrieri, Errunza and Hogan, 2007; Pukthuanthong and Roll, 2009; Bekaert, Campbell R Harvey, et al., 2011; Frijns, Tourani-Rad and Indriawan, 2012; Pasioura et al., 2013; Everaert and Pozzi, 2016) Another important point is the geographical border of integration, for example, findings of Lee and Jeong (2016) for ASEAN countries and Phylaktis and Ravazzolo (2002) for Pacific-Basin countries provide evidence for a regional integration than a global one.
While big number of studies find upward and/or linear trends in integration, several interruptions and declines may exist over time. There are many events that changes left and right tail dependencies of stock markets (Bhatti and Nguyen, 2012; Guesmi, Moisseron and Teulon, 2014) but it is not possible to say impacts are identical. Graham, Kiviaho and Nikkinen (2012), who examine the integration of 22 emerging stock markets with the US market between 03 January 2001 and 28 April 2010 find that co-movements of markets have over-time changes and long-term fluctuations. Therefore, understanding time-varying structure of integration and discussing properties of every analysis period idiosyncratically is necessary.
In this context, consequences of distress and turmoil times on co-movements of returns draws special attention and create debates about how they affect the financial system. Studies on global financial crisis are not be in consensus about how the crisis affects integration. Gagnon, Power and Toupin (2016) say there is an increase in market integrity during the crisis among US, Germany, UK, France, and Switzerland. Srivastava, Bhatia and Gupta (2015) get similar findings for US, Japan, Hong Kong, Singapore and India. On the contrary, Syllignakis and Kouretas (2010) say there is a slowdown of convergence between Central and Eastern European emerging stock markets and Germany and US markets, and Lehkonen (2014) finds decreased global integration during the crisis but also points out slight differences between developed and emerging countries. Besides, Horvath and Petrovski (2013) say that the recent global financial crisis did not alter the degree of stock market integration between Western Europe vis-a`-vis Central and South Eastern Europe countries. In the study of Narayan, Sriananthakumar and Islam (2014), six emerging Asian markets against the US, Australia, China, and India are found to have different characteristics of correlations and different impacts of the crisis.
On the other hand, there are more consensus among studies on '97 Asian crisis. In his comprehensive work, Lehkonen (2014) addresses non-identical results during crises for the years between 1986- 2010. Although every period possesses its own features, '97 Asian crisis bears more common trends in terms of integrity. Supportive analyses of Huyghebaert and Wang (2010) and Boubakri and Guillaumin (2015) show enhanced integration of East Asian stock markets after the Asian crisis. In line with these findings, Shabri Abd. Majid, Kameel Mydin Meera and Azmi Omar (2008) who examines integrity of
ASEAN stock markets among themselves and with the US and Japan and Tai (2007), who focuses on India, Korea, Malaysia, Philippines, Taiwan, and Thailand, find a greater level of regional and global integration after '97. Rodriguez (2007) concludes both Asian and Mexican crises are times of increased regional dependence for Asian and Latin American countries.
More liberalized and inter-connected financial system inevitably exposes the markets to amplified consequences of spillover effects on their return co-movements. In this sense, political, economic and financial shocks may result with extreme spillover effects, which are interpreted as financial contagion. However, unveiling contagion in equity markets is a challenging subject for researchers. First of all, there is a widespread disagreement about definition of contagion; Forbes and Rigobon (2002) define contagion as a significant increase in cross-market linkages after the shock while Bekaert, Harvey and Ng (2005) define contagion as excess correlation which is not expected from economic fundamentals (For a more detailed coverage about definitions and measurements of contagion, please see Pericoli and Sbracia (2003)). Considering all, it is possible to express contagion as a source, which significantly provokes equity markets to move more closely or more separately during or after crisis periods through several known or unknown transmission channels. This is a more suitable approach since crises create uncertainty, emergent volatility spillovers between countries may result both positive and negative changes in correlations. Another issue is the problematic decomposition of contagion, because there is a necessity to reveal if conditional changes in focused channels can also be contributed to shocks or not. There are numerous uncontrollable and latent factors in any economic system that may hide impacts of investigated influencers.
China deserves particular interest due to its great contribution to World GDP with 17% of share in 2015 (Dept., 2016). Parallel to this great amount of economic output, China struggles with a huge amount of debt to GDP ratio of 250%, which leads to a fragile financial system due to problem loans. Credit overhang, which indicates potential risk in cross-country manner, is estimated around 22- 27 percent of GDP, very high in international comparison (Dept, 2016). Chiang and Chen (2016) employ a multivariate GARCH model to investigate dynamic linkages of China with international markets and find time-varying correlative relations with several Asian economies, US and Europe and suggest that after increased degree of financial liberalization, upward changes occurred in correlations. Similarly, Carpenter, Lu and Whitelaw (2015) suggest that China market become more efficient compared to past but still possesses high volatility problems.
Most of the studies use correlations as a measure about integrity; but Pukthuanthong and Roll (2009) argues about the success of this representation between stock markets and hence they use global factors estimated by principal components than simple correlation scores. This approach is also implemented in this study with some extent in terms of creating principal components (see Section 4). In this study, existence of integrity and inter-predictability of 11 countries’ stock market returns (selected as 6 developed and 5
emerging) and their time-varying structure are investigated for period between 2001- 2017. Since the period includes several crises with big impacts on global economies and markets, it is also possible to discover crisis-related changes.
3 Data
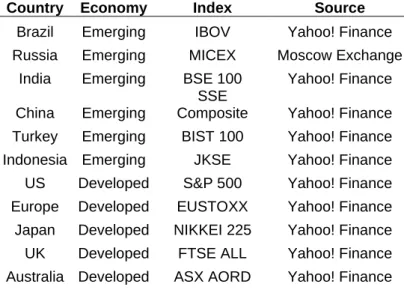
This study employs monthly returns of stock markets as determinant data. Time scale choice is important since high-frequency data may cause noisy results and thus misleading remarks. A total of 11 indices around the world are selected, 5 from developed and 6 from emerging economies (Table 1). These countries produce about 75% of world GDP (68% developed, 32% emerging)1, and responsible for 78% of world market capitalization (77%
developed, 23% emerging)2 and 90% of stocks traded in world (79% developed, 21%
emerging)3 in 2015 and are expected to represent a high portion of globalization. Sample
period is 01/2001 - 01/2017, with 192 observations, which covers recent global financial crisis and Euro area crisis and thus gives an occasion to examine correlation behavior of markets during turmoil times.
Table 1 Countries included in the study. Selected indices are benchmarks for selected stock markets to gauge the performances
Country Economy Index Source
Brazil Emerging IBOV Yahoo! Finance Russia Emerging MICEX Moscow Exchange
India Emerging BSE 100 Yahoo! Finance China Emerging
SSE
Composite Yahoo! Finance Turkey Emerging BIST 100 Yahoo! Finance Indonesia Emerging JKSE Yahoo! Finance US Developed S&P 500 Yahoo! Finance Europe Developed EUSTOXX Yahoo! Finance Japan Developed NIKKEI 225 Yahoo! Finance UK Developed FTSE ALL Yahoo! Finance Australia Developed ASX AORD Yahoo! Finance
Benchmark indices of each market are used as prices and logarithmic differences in closing price of each month (m) are calculated for each index (j) to obtain returns:
𝑅𝑒𝑡𝑢𝑟𝑛
𝑚,𝑗= ln
𝑃𝑟𝑖𝑐𝑒
𝑚+1,𝑗𝑃𝑟𝑖𝑐𝑒
𝑚,𝑗1 World Bank Database: http://data.worldbank.org/data-catalog/world-development-indicators. Accessed on: 02/2017. 2 World Bank Database: http://data.worldbank.org/indicator/CM.MKT.LCAP.CD, excluding UK due to lack of data. Accessed on: 02/2017.
3 World Bank Database: http://data.worldbank.org/indicator/CM.MKT.TRAD.CD, excluding UK due to lack of data. Accessed on: 02/2017.
4 Methods
Analysis is divided into two parts: First, PCA is used on stock market returns of the economies. Co-integrated behavior of the returns over the sampling period is examined and notable change points of relations are searched with pruned exact linear time (PELT) method. Second, a PLSR model has run to assess predictability of returns with information provided by other markets and lagged returns. This gives an opportunity to conduct a deeper examination and reveal which markets are informative for other markets and relations' direction and impact.
All models are implemented in statistical computing software R (version 3.3.1) (Team, 2016) via R Studio interface (Team, 2015) on a computer with Intel i7 2.6 GHz CPU with 16 GB memory under Windows 10 operating system.
4.1 Principal components analysis
PCA is a common technique for finding patterns in datasets; it is considered as an unsupervised learning method since there isn't any response variable provided to the model. PCA is most commonly used as a dimension reduction technique especially when the number of variables exceeds observations. Dimensions are reduced to principal components (PC), and each component is composed of normalized linear combinations of variables which are also referred as latent variables. While these constructed variables carry the information of original variables, they simplify interpretation of relations among data and most importantly, they offer meaningful results in presence of high correlation between variables.
On first principal component (PC1), linear combination of variables, which explains most of the variance on dataset, is constituted by means of calculating loading values on each variable. This combination can be written as (James et al., 2013):
𝑍
1= 𝜑
11𝑋
1+ 𝜑
𝑝1𝑋
𝑝φp1 are the loadings of variables X1..p on PC1. Determination of loadings is an optimization
problem that is expressed as:
maximize
1
𝑛
∑
𝑧
𝑖1
2
𝑛
𝑖=1
Subject to∑ 𝜑
𝑗12= 1
𝑝 𝑗=1in where, there are n observations of p variables. zi1 can be written as:
in where, zi1 are scores of sample observations on PC1.
Constructing second principal component (PC2) is carried out with the same procedure as PC1, but since this component must be uncorrelated with first component, Z1, orthogonality
constraint between directions of φ1 and φ2 is added to optimization problem; which are the
loading vectors of combinations of the loadings of variables on components (k) shown as:
𝜑
𝑘= (𝜑
1𝑘𝜑
2𝑘. . 𝜑
𝑝𝑘)
𝑇Rest of the PCs are found in similar way finding PC2, each newly constructed component must be uncorrelated with previous ones.
Interpretation of components is basically done in a subjective manner and on the purpose of analyst; in this study, understanding correlated behavior of market returns over sampling period is the main interest point. Generally, first few components are the ones which the observations vary the most; this gives a chance to visualize relationships between markets. Identifying statistically notable change points for parameters in time series data has been a point of interest for many researchers in a vast scale. It is a challenging problem since as size of data set increases, number of possible solutions increase combinatorically. In this study, after principal components are generated, score points on each observation are used as determinants of variation over the sampling period. Significant changes on scores points out possible breaking points of co-integrated relations of stock markets.
In attempt to successfully identify sub-periods in this study, PELT method is used that is proposed by Killick, Fearnhead and Eckley (2012) and Killick and Eckley (2014) via examining changes in mean. Detailed description can be found in their works.
4.2 Partial least squares regression
PLSR is used to understand mutual relational adequacy and predictability of stock market returns along with their historical values. PLSR involves identifying the best represent of predictors with principal components introduced in Section 4.1 in a supervised way; that is, by providing a response and making principal components to explain the variability associated with that response variable along with other explanatory features. Like PCA, PLSR carries information about these relations in the definition of the scores and loadings. PLSR finds loading of variables by setting each of them equal to coefficient of a linear regression model that has the same response variable with PLSR and the corresponding
X variable as the determinant. Orthogonality constraint is valid in PLSR too. Ultimately,
regression model is fit to the equation: 𝑦𝑖 = 𝛳0+ ∑ 𝛳𝑙 𝑘 𝑙=1 + ∑ 𝜑𝑗𝑙𝑥𝑖𝑗 𝑝 𝑗=1 + 𝜖𝑖 , 𝑖 = 1, . . , 𝑛
Performance of PLSR on each index is going to be evaluated through the mean squared error rates of cross-validated predictions. Relational information is extracted with coefficients of the model.
5 Empirical Results
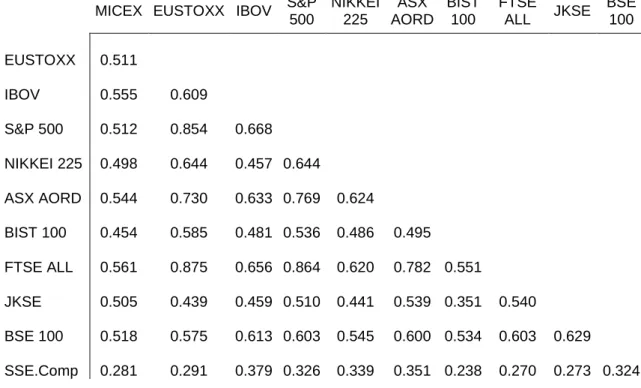
Correlation scores between markets can be seen in Table 2 (correlations are significant with level of 95% according to Pearson's test). Scores show high positive correlations between developed countries' stock markets except Japan. China market has remarkably low correlations with all other markets. PCA will be able to offer a multi-dimensional understanding about these relations.
Table 2 Correlations between stock market indices. Developed stocked markets have higher and positive inter-correlations than emerging stock markets. Emerging stock market have positive, moderate and close correlations between both inter-group and developed ones. China stock market has weak correlation with all other stock markets
MICEX EUSTOXX IBOV S&P 500 NIKKEI 225 ASX AORD BIST 100 FTSE ALL JKSE BSE 100 EUSTOXX 0.511 IBOV 0.555 0.609 S&P 500 0.512 0.854 0.668 NIKKEI 225 0.498 0.644 0.457 0.644 ASX AORD 0.544 0.730 0.633 0.769 0.624 BIST 100 0.454 0.585 0.481 0.536 0.486 0.495 FTSE ALL 0.561 0.875 0.656 0.864 0.620 0.782 0.551 JKSE 0.505 0.439 0.459 0.510 0.441 0.539 0.351 0.540 BSE 100 0.518 0.575 0.613 0.603 0.545 0.600 0.534 0.603 0.629 SSE.Comp 0.281 0.291 0.379 0.326 0.339 0.351 0.238 0.270 0.273 0.324
Before proceeding to analysis, stationary check on time series data is necessary: Independent and identically distributed variables are needed in order to follow a more meaningful interpretation. Augmented Dickey-Fuller (ADF) (Dickey and Fuller, 1979) test is used where the null is a unit root against the alternative of stationary process. All return data series are stationary at significance level of 99%. PCA performed with the function
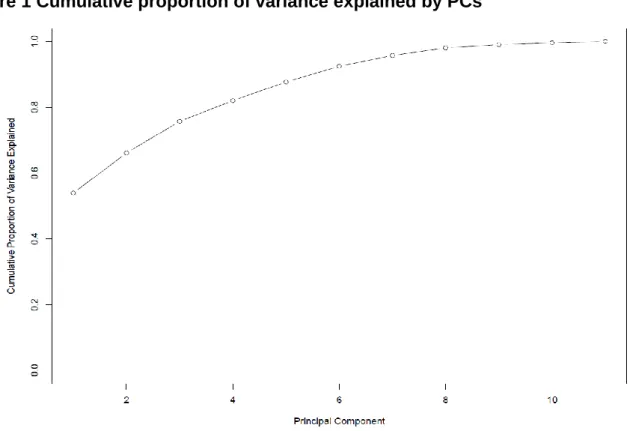
prcomp of the standard library. Cumulative proportion of variance explained by PCs are
Figure 1 Cumulative proportion of variance explained by PCs
Table 3 Loadings on first three PCs. First three PCs constructed by PCA. PC1 has similar loading for all stock markets, which shows a positively correlated structure among them. Remaining PCs are dominated by Turkey and China stock markets with varying directions
PC1 PC2 PC3 MICEX 0.362 -0.028 0.377 EUSTOXX 0.276 0.071 0.038 IBOV 0.346 -0.108 0.143 S&P 500 0.217 0.008 0.071 NIKKEI 225 0.256 -0.019 0.038 ASX.AORD 0.188 -0.024 0.081 BIST 100 0.468 0.556 -0.631 FTSE.ALL 0.207 0.040 0.098 JKSE 0.265 -0.096 0.357 BSE 100 0.362 -0.012 0.190 SSE Comp 0.249 -0.814 -0.502
First three PCs manage to explain 76% of variance; 54% by PC1, 12 by PC2 and 10% by PC3. This success is enough for further examination of relational behavior of markets. In Table 3, loadings on first three PCs are presented. PC1 mainly corresponds to procyclical structure of market returns. According to direction and magnitude of variable loadings, all markets are correlated similarly with this component. PC2 is strongly dominated by BIST
100 and SSE Comp; both have high loadings and are on opposite directions. Remaining markets have unimportant impacts. This indicates the particular positions of stock markets of Turkey and China and their oppositely directed market structures. On PC3, BIST 100 and SSE Comp are still in the foreground but unlike on second component, their directions are on the same side. Briefly, while all markets have principally correlated movements over this period, Turkey and China somehow differ slightly from the rest.
5.1 Time-varying integrity
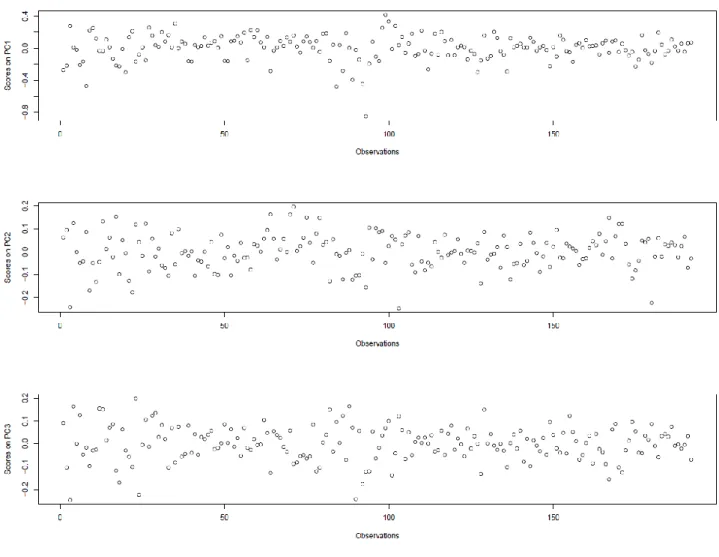
Further investigation on scores of observations on components is necessary to understand if there is any change in trends of stock markets' co-integration. Scatterplots of observations' scores on PC1, PC2 and PC3 can be found in Figure 2.
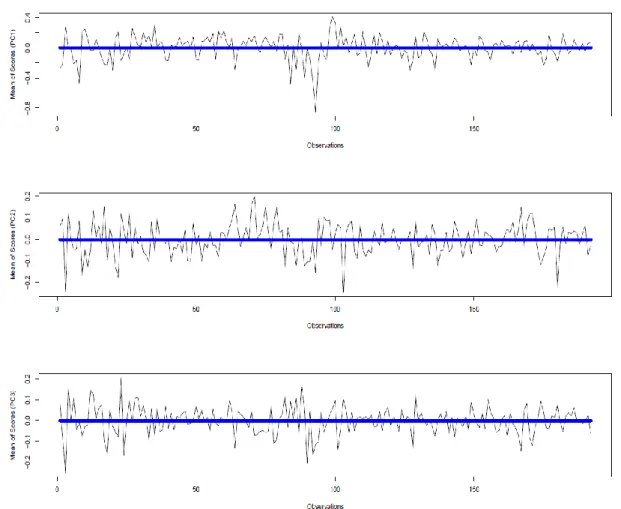
Plots show that there are no obvious changes on patterns over time series’ scores except individual ones, which can be treated as outliers. In order to investigate breakpoints, statistical approach introduced in Section 4.1 is utilized rather than an explanatory analysis, with the function cpt.mean of the library changepoint (Killick and Eckley, 2014). This function searches possible stages of changes in mean analysis.
No change points in mean statistics have returned over sampling period (See Figure 3, horizontal lines show fitted mean values). Since there isn't any significant break, it can be said that integration levels among stock markets has remained same since the beginning of 2001.
Many studies that cover previous periods show boosted co-integration of stock markets. This is because most comprehensive policies opened the ways of denser financial globalization during '80s and '90s. Additionally, there isn't any significant upward or downward change in co-integrated movements of stock market returns connected with adverse effects of economic and financial crises (there were four important shocks during the study period; recent global financial crisis- also known as sub-prime mortgage crisis, European sovereign debt crisis, 2008-2009 Russian financial crisis and China stock market crash in 2015). Most conspicuous outlier in the first plot of Figure 3 indicates a very short volatility around second half of 2008 which can be associated with the global financial crisis, but this seems not disturbing the integrity magnitude phenomenon statistically. These variations are roughly stabilized within 2.5 years of crisis. Scores on PC2 and PC3 show consistent variability which can be attributed to Turkey and China markets as mentioned in Section 5, but this variation is not connected to integrity since only the first component is found related.
5.2 Predicting Stock Market Returns
A total of 189 observations are used in regression analyses: 3 observations lost due to usage of lagged values. Root mean squared error of predictions (RMSEP) with 10-fold cross-validations are calculated as a measure of learning performance over train data set to determine sufficient components to use. The first local minimum is chosen rather than the global minimum in the curve in order to avoid over-fitting problem. Results with the lowest RMSEP score can be seen in Table 4.
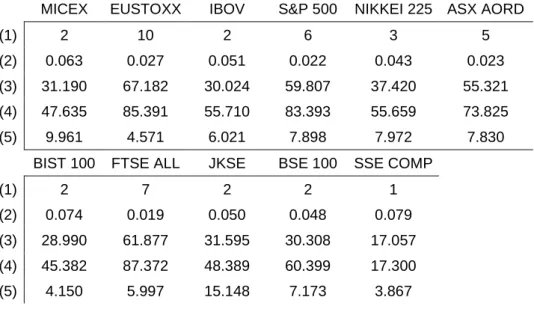
Table 4 Results from PLSR analysis with lowest RMSEP. (1) Number of Components at Lowest RMSEP; (2) Lowest RMSEP; (3) Lowest RMSEP Explanation Rate on Variables; (4) Lowest RMSEP Explanation Rate on Response; (5) Lowest RMSEP Explanation Rate on Response (Only Lagged Data). Developed stock market returns are explained with more components and explanation performances are better than emerging stock market returns, both on all data and response- except Japan. China stock market returns' explanation has the worst performance over entire set
MICEX EUSTOXX IBOV S&P 500 NIKKEI 225 ASX AORD
(1) 2 10 2 6 3 5
(2) 0.063 0.027 0.051 0.022 0.043 0.023
(3) 31.190 67.182 30.024 59.807 37.420 55.321 (4) 47.635 85.391 55.710 83.393 55.659 73.825
(5) 9.961 4.571 6.021 7.898 7.972 7.830
BIST 100 FTSE ALL JKSE BSE 100 SSE COMP
(1) 2 7 2 2 1
(2) 0.074 0.019 0.050 0.048 0.079 (3) 28.990 61.877 31.595 30.308 17.057 (4) 45.382 87.372 48.389 60.399 17.300 (5) 4.150 5.997 15.148 7.173 3.867
Developed stock markets' errors seen to be lower than emerging ones, S&P 500, ASX AORD and FTSE ALL errors are lowest and BIST 100 and SSE COMP errors are highest. Explanation rates on responses also show that explaining developed stock market returns is quite successful than emerging stock market returns. Differences in the rates can be used as proxies for market structure classification. It is also explicit that developed markets are better explained by more components than emerging markets. This indicates existence of more latent factors and therefore demonstrating more linkages through the global financial system which are influencing developed markets. Lesser components also validate not so powerfully correlated return behaviors of emerging stock market indices. NIKKEI 225 is in between those two market categories; it seems to approach to emerging markets regarding distinguishing statistics. Most notably, China's stock market return explanation rate is dreadfully low. Correlation scores and PCA and PLSR results imply the
unique position of China's stock market apart from the rest of the world. Highest explanation rates in Table 5 are also in line with previous findings.
Table 5 Highest explanation rates achieved with PLSR. (1) Highest Explanation Rate Achieved on Variables; (2) Highest Explanation Rate Achieved on Response. Developed stock market returns are explained better than emerging stock market returns- except Japan. China stock market returns' explanation has the worst performance over entire set
MICEX EUSTOXX IBOV S&P 500 NIKKEI 225 ASX AORD
(1) 100 100 100 100 100 100
(2) 54.326 85.728 69.304 84.978 60.798 76.353 BIST 100 FTSE ALL JKSE BSE 100 SSE COMP
(1) 100 100 100 100 100
(2) 58.076 88.509 61.353 69.259 35.072
5.3 Examination of regression coefficients
Only the regression coefficients of determinant variables on first components are focused, since this component carries most of the information.
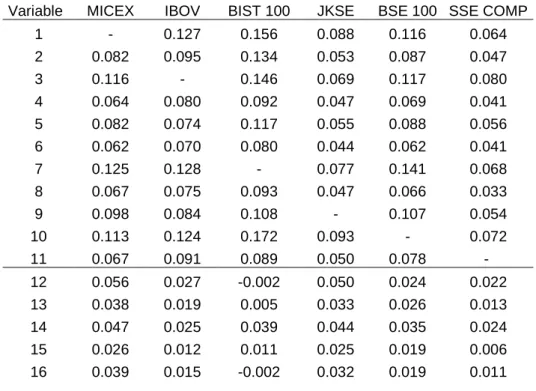
Table 6 Regression coefficients on first components in PLSR; emerging stock markets. Variable numbers depicts stock market returns and their lagged values as follows: 1: MICEX, 2: EUSTOXX, 3: IBOV, 4: S&P 500, 5: NIKKEI 225, 6: ASX AORD, 7: BIST 100, 8: FTSE ALL, 9: JKSE, 10: BSE 100, 11: SSE COMP; 12 to 22: one month lagged values with the same order as previous codding; 23 to 33: two month lagged values with the same order as previous codding; 34 to 44: three month lagged values with the same order as previous codding
Variable MICEX IBOV BIST 100 JKSE BSE 100 SSE COMP
1 - 0.127 0.156 0.088 0.116 0.064 2 0.082 0.095 0.134 0.053 0.087 0.047 3 0.116 - 0.146 0.069 0.117 0.080 4 0.064 0.080 0.092 0.047 0.069 0.041 5 0.082 0.074 0.117 0.055 0.088 0.056 6 0.062 0.070 0.080 0.044 0.062 0.041 7 0.125 0.128 - 0.077 0.141 0.068 8 0.067 0.075 0.093 0.047 0.066 0.033 9 0.098 0.084 0.108 - 0.107 0.054 10 0.113 0.124 0.172 0.093 - 0.072 11 0.067 0.091 0.089 0.050 0.078 - 12 0.056 0.027 -0.002 0.050 0.024 0.022 13 0.038 0.019 0.005 0.033 0.026 0.013 14 0.047 0.025 0.039 0.044 0.035 0.024 15 0.026 0.012 0.011 0.025 0.019 0.006 16 0.039 0.015 -0.002 0.032 0.019 0.011
17 0.030 0.017 0.016 0.023 0.015 0.011 18 0.056 0.043 -0.037 0.052 0.053 0.001 19 0.026 0.018 0.000 0.025 0.016 0.008 20 0.023 0.023 0.003 0.031 0.015 0.015 21 0.033 0.015 0.004 0.034 0.019 0.017 22 0.045 0.001 0.012 0.025 0.010 0.027 23 0.022 0.019 0.023 0.028 0.030 0.035 24 -0.005 -0.001 -0.016 0.006 0.004 0.009 25 0.023 0.005 0.002 0.024 0.017 0.020 26 -0.005 -0.007 -0.012 0.003 -0.001 -0.003 27 -0.010 -0.023 0.008 -0.009 -0.013 0.005 28 -0.003 -0.002 0.004 0.003 0.006 0.003 29 -0.006 0.004 0.008 0.010 0.004 0.030 30 0.000 -0.003 -0.001 0.004 0.001 0.005 31 -0.004 -0.009 0.012 0.001 0.019 0.020 32 0.001 0.002 0.014 0.004 -0.003 0.017 33 0.035 0.019 0.020 0.040 0.033 0.035 34 0.014 0.002 0.011 0.026 0.027 0.006 35 -0.013 -0.017 0.006 0.005 -0.002 0.017 36 0.011 0.014 0.021 0.017 0.028 0.007 37 -0.010 -0.011 0.002 0.002 0.004 0.006 38 -0.005 -0.007 -0.004 0.010 0.009 -0.001 39 0.002 0.002 0.006 0.011 0.010 0.013 40 0.007 -0.018 -0.009 0.011 -0.001 -0.001 41 -0.006 -0.005 0.000 0.004 0.006 0.011 42 0.012 0.005 -0.001 0.013 0.015 0.020 43 0.011 0.014 0.002 0.012 0.019 0.015 44 0.002 -0.020 0.002 0.010 0.002 0.008
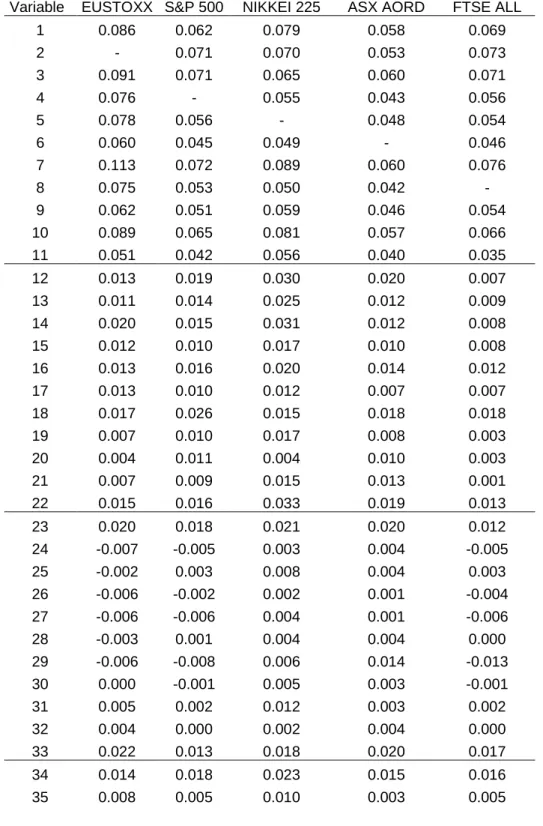
Regression coefficients for emerging stock markets and developed stock markets are presented in Table 6 and in Table 7, respectively. While there are country specific differences in informative nature of determinant data, substantially, it is possible to say that there is a distinction between developed and emerging markets in terms of latent relation structures. There are a lot more components used for a successful prediction of developed stock market returns than emerging ones. This is a very important point to be discoursed. Existence of components captures several linkages among countries. These linkages create transmission channels that possibly constitute stock market exposures and thus increase stock market integrity among economies. Flow of market-related information through bounded markets with linkages eases correlated pricing of equities. There are many possible linkage mechanisms across the economic and financial relations like geographical position, bilateral trade volumes, bilateral investment flows. Revealing the identities of these linkages is beyond the scope of this study.
Table 7 Regression coefficients on first components in PLSR; developed stock markets. Variable numbers depicts stock market returns and their lagged values as follows: 1: MICEX, 2: EUSTOXX, 3: IBOV, 4: S&P 500, 5: NIKKEI 225, 6: ASX AORD, 7: BIST 100, 8: FTSE ALL, 9: JKSE, 10: BSE 100, 11: SSE COMP; 12 to 22: one month lagged values with the same order as previous codding; 23 to 33: two month lagged values with the same order as previous codding; 34 to 44: three month lagged values with the same order as previous codding
Variable EUSTOXX S&P 500 NIKKEI 225 ASX AORD FTSE ALL
1 0.086 0.062 0.079 0.058 0.069 2 - 0.071 0.070 0.053 0.073 3 0.091 0.071 0.065 0.060 0.071 4 0.076 - 0.055 0.043 0.056 5 0.078 0.056 - 0.048 0.054 6 0.060 0.045 0.049 - 0.046 7 0.113 0.072 0.089 0.060 0.076 8 0.075 0.053 0.050 0.042 - 9 0.062 0.051 0.059 0.046 0.054 10 0.089 0.065 0.081 0.057 0.066 11 0.051 0.042 0.056 0.040 0.035 12 0.013 0.019 0.030 0.020 0.007 13 0.011 0.014 0.025 0.012 0.009 14 0.020 0.015 0.031 0.012 0.008 15 0.012 0.010 0.017 0.010 0.008 16 0.013 0.016 0.020 0.014 0.012 17 0.013 0.010 0.012 0.007 0.007 18 0.017 0.026 0.015 0.018 0.018 19 0.007 0.010 0.017 0.008 0.003 20 0.004 0.011 0.004 0.010 0.003 21 0.007 0.009 0.015 0.013 0.001 22 0.015 0.016 0.033 0.019 0.013 23 0.020 0.018 0.021 0.020 0.012 24 -0.007 -0.005 0.003 0.004 -0.005 25 -0.002 0.003 0.008 0.004 0.003 26 -0.006 -0.002 0.002 0.001 -0.004 27 -0.006 -0.006 0.004 0.001 -0.006 28 -0.003 0.001 0.004 0.004 0.000 29 -0.006 -0.008 0.006 0.014 -0.013 30 0.000 -0.001 0.005 0.003 -0.001 31 0.005 0.002 0.012 0.003 0.002 32 0.004 0.000 0.002 0.004 0.000 33 0.022 0.013 0.018 0.020 0.017 34 0.014 0.018 0.023 0.015 0.016 35 0.008 0.005 0.010 0.003 0.005
36 0.024 0.021 0.027 0.013 0.018 37 0.011 0.007 0.008 0.003 0.006 38 0.008 0.009 0.009 0.004 0.007 39 0.011 0.008 0.009 0.006 0.008 40 0.016 0.013 -0.004 -0.002 0.013 41 0.006 0.006 0.009 0.004 0.004 42 0.004 0.009 0.015 0.012 0.012 43 0.007 0.009 0.014 0.006 0.013 44 0.003 0.003 0.006 0.004 -0.001
As seen from explanation rates on response with only lagged data in Table 4, lagged returns are not seen as carrying much information about current returns. Indonesia stock market has the highest rate (15.15%), which may indicate a weaker form of market than others. Thus, current time span coefficients are mainly consulted for examination.
Russia: Two components are used for prediction of MICEX index returns. First component
explains 44.21% of variance on response. Lagged returns are found less informative when compared to current returns. Most informative markets in current time span for MICEX are four emerging market indexes; BIST 100, BSE 100 and IBOV, JKSE. MICEX and BIST 100 indexes are informative in one month lagged time span.
Eurozone: EUSTOXX returns are predicted by ten components. First component explains
58.54% of variance on response and show that returns of all markets used in the analysis have positive relation with EUSTOXX returns in current time span; BIST 100, MICEX, S&P 500, FTSE ALL, IBOV are the most conspicuous markets. Lagged returns are not informative. Coefficients of developed market returns rise through the rest of components, and China market has opposite relationship with Eurozone.
Brazil: Brazil market returns are predicted by two components. First component explains
50.62% of variance on response and coefficients of the components show positive relationship between all markets in current time span. MICEX, BIST 100, BSE 100, which are all emerging markets are in the foreground. IBOV seems to be affected by lagged values at low level.
US: S&P 500 returns are predicted by six components. First component contributes to
explanation of variance on response with a rate of 62.9%. In current time span, US stock market returns are associated with Eurozone, Russia, Brazil, Turkey and India stock market returns.
Japan: NIKKEI 225 are predicted by three components. First component explains 45.77%
of variance on response, and in current time span, EUSTOXX, MICEX, BIST 100, BSE 100 have determinant effect on Japan stock market returns.
Australia: Australia's returns are predicted by five components. On first component, which
explains 58.81% of variance on response, coefficients in current time span are not as high as others. MICEX, EUSTOXX, IBOV, BIST 100 and BSE 100 are highest determinants.
Turkey: Two components are used to predict BIST 100 returns. First component carries
39.8% of information on response and MICEX, EUSTOXX, IBOV and BSE 100 strongly effect BIST 100 returns in current time span. Lagged returns are not informative.
UK: FTSE ALL index is predicted by seven components. First component explains 65.24%
of variance on response. Lagged data do not have meaningful impact and current returns have positive signs. MICEX, EUSTOXX, IBOV, BIST 100 and BSE 100 indexes get higher coefficient scores in current time span.
Indonesia: Indonesia's stock market returns are explained by two components. On first
component, 44.69% of information on response is explained. MICEX, IBOV, BIST 100 and BSE 100 indexes are more determinant than others. JKSE has the highest score for explanation rate with lagged data, high coefficients in one-month time span are MICEX, IBOV and BIST 100 and in two months’ time span, MICEX, IBOV, SSE COMP.
India: Two components used for India stock market return prediction. First component
explains 54.96% of variance on response. Strongly related indexes are MICEX, IBOV, BIST 100 and JKSE.
China: China stock market returns are explained by only one component. For current
returns, all relations are positive with MICEX, IBOV, NIKKEI 225, BIST 100 and BSE 100 leading.
6 Discussion and conclusions
As stated in Yarovaya and Lau (2016), financial integration of emerging markets have pros and cons. Integration of international stock markets reduces risks in emerging markets and allows global investors more opportunities for risk sharing. On the other hand, this integration limits benefits of international portfolio diversification and may lead to joint market crashes too (Lee and Cho, 2017). For international investors, understanding the direction of global stock market integration and its impacts on investing strategies are important.
This paper examines co-movements and interrelationships among 6 emerging and 5 developed stock market returns between period 2001- 2017 with monthly data. First, PCA is conducted and components are extracted from returns. According to PELT analysis on PCA scores, patterns of correlations of returns are found constant except short-term disturbances during global financial crisis time. While many studies show increase of integration among stock markets in last two decades of 20th century, this study finds that in
2001- 2017 period, there hasn't been a significant change in the integration level of global stock markets. This finding is in line with Bekaert, Hodrick and Zhang (2009), Akbari, Ng and Solnik (2019) and Bekaert and Mehl (2019).
Second, PLSR models are used for predicting each stock market returns with other stock markets' current and all markets' up to three month lagged returns. Results identify divergence between developed and emerging markets: Developed stock market returns are explained successfully and better than emerging stock market returns. Japan market is distinguished from other developed markets. Its predictability success is close to emerging markets' rates. Another important finding is that lowest RMSEPs are achieved for developed stock market returns with much more components than emerging ones but again, except for Japan stock market returns, which is predicted with fewer number of components compared to developed ones. It is conceivable that each component can be treated as a latent variable, or transmission channel.
Lack of channels causes emerging markets to be segmented. Numerous presences of explanatory latent variables for developed economies suggest a more connected structure for those country markets than others. A deeper examination about these latent variables and their effects is a good starting point for understanding spill-over mechanisms in the system. Chen (2018) (who also implied strong international stock market co-movements) remarked that developed market stock market volatility is better explained by global shocks and regional shocks are more reflective for emerging market fluctuations. In the light of this, it is recommended for investors to distinguish country/region specific stresses from global ones to better design their portfolio diversification and hedging strategies.
Despite the general consensus for increasing correlation during bear market states as well as extreme market conditions (Demirer et al., 2018), no variation in stock market co-movements found during the Global Financial Crisis. By considering less systemic risk channels for emerging markets, it is possible for investors from developed countries to hold a well-diversified portfolio with emerging market stocks.
China stock market's unpredictability points opted out position of the country's stock market. Lau and Sheng (2018) validates China’s market is the least integrated with other markets worldwide. This country can be regarded as an attractive destination for investors (Yarovaya and Lau, 2016). It's global integrity and dynamics deserves more interest to be investigated when the country's big economy and its impact on global trade are considered. Despite globalization, benefits of international diversification have persisted (Bekaert, Hodrick and Zhang, 2009). Investors still have opportunities with many alternatives for building portfolios over several markets in the long term. Further analyses with more frequent data will uncover short-term alternatives. Still, financial institutions and market participants must be careful about spill-over effects over the system.
References
Adler, M. and Qi, R. (2003) ‘Mexico’s integration into the North American capital market’,
Emerging Markets Review. Elsevier, 4(2), pp. 91–120. https://doi.org/10.1016/S1566-0141(03)00023-2
Financial Integration?’, (Forthcoming) Journal of Financial & Quantitative Analysis. https://doi.org/10.1017/S0022109019000681
Beine, M., Cosma, A. and Vermeulen, R. (2010) ‘The dark side of global integration: Increasing tail dependence’, Journal of Banking & Finance. Elsevier, 34(1), pp. 184–192. https://doi.org/10.1016/j.jbankfin.2009.07.014
Bekaert, G., Harvey, C. R., et al. (2011) ‘What segments equity markets?’, Review of
Financial Studies, 24(12), pp. 3841–3890. doi: 10.1093/rfs/hhr082.
https://doi.org/10.1093/rfs/hhr082
Bekaert, G., Harvey, C. R., et al. (2011) ‘What segments equity markets?’, Review of
Financial Studies. Soc Financial Studies, 24(12), pp. 3841–3890.
https://doi.org/10.1093/rfs/hhr082
Bekaert, G. et al. (2013) ‘The European Union, the Euro, and equity market integration’,
Journal of Financial Economics. Elsevier, 109(3), pp. 583–603.
https://doi.org/10.1016/j.jfineco.2013.03.008
Bekaert, G., Harvey, C. R. and Lundblad, C. T. (2003) ‘Equity market liberalization in emerging markets’, Journal of Financial Research. Wiley Online Library, 26(3), pp. 275– 299. https://doi.org/10.1111/1475-6803.00059
Bekaert, G., Harvey, C. R. and Ng, A. (2005) ‘Market Integration and Contagion’, The
Journal of Business. University of Chicago Press, 78(1), pp. 39–69.
https://doi.org/10.1086/426519
Bekaert, G., Hodrick, R. J. and Zhang, X. (2009) ‘International stock return comovements’, Journal of Finance, 64(6), pp. 2591–2626. doi: 10.1111/j.1540-6261.2009.01512.x.
Bekaert, G. and Mehl, A. (2019) ‘On the global financial market integration “swoosh” and the trilemma’, Journal of International Money and Finance. Elsevier Ltd, 94, pp. 227–245. doi: 10.1016/j.jimonfin.2019.02.001.
Bhatti, M. I. and Nguyen, C. C. (2012) ‘Diversification evidence from international equity markets using extreme values and stochastic copulas’, Journal of International Financial
Markets, Institutions and Money. Elsevier, 22(3), pp. 622–646.
https://doi.org/10.1016/j.intfin.2012.02.004
Boubakri, S. and Guillaumin, C. (2015) ‘Regional integration of the East Asian stock markets: An empirical assessment’, Journal of International Money and Finance. Elsevier, 57, pp. 136–160. https://doi.org/10.1016/j.jimonfin.2015.07.011
Caporale, G. M. and Spagnolo, N. (2012) ‘Stock market integration between three CEECs’, Journal of Economic Integration. JSTOR, pp. 115–122.
https://doi.org/10.11130/jei.2012.27.1.115
Carpenter, J. N., Lu, F. and Whitelaw, R. F. (2015) The real value of China’s stock
market. https://doi.org/10.3386/w20957
Carrieri, F., Errunza, V. and Hogan, K. (2007) ‘Characterizing world market integration through time’, Journal of Financial and Quantitative Analysis. Cambridge Univ Press, 42(04), pp. 915–940. https://doi.org/10.1017/S0022109000003446
Chen, P. (2018) ‘Understanding international stock market comovements: A comparison of developed and emerging markets’, International Review of Economics and Finance. Elsevier Ltd, 56(December 2017), pp. 451–464. doi: 10.1016/j.iref.2017.12.004.
Chiang, T. C. and Chen, X. (2016) ‘Empirical analysis of dynamic linkages between China and international stock markets’, Journal of Mathematical Finance. Scientific Research Publishing, 6(01), pp. 189–212. https://doi.org/10.4236/jmf.2016.61018 Click, R. W. and Plummer, M. G. (2005) ‘Stock market integration in ASEAN after the Asian financial crisis’, Journal of Asian Economics. Elsevier, 16(1), pp. 5–28.
https://doi.org/10.1016/j.asieco.2004.11.018
Demirer, R. et al. (2018) ‘Global risk aversion and emerging market return comovements’,
Economics Letters. Elsevier B.V., 173, pp. 118–121. doi: 10.1016/j.econlet.2018.09.027.
Dept., I. M. F. R. (2016) World Economic Outlook, October 2016: Subdued Demand:
Symptoms and Remedies. International Monetary Fund.
Dept, I. M. F. R. (2016) Global Financial Stability Report, October 2016: Fostering
Stability in a Low-Growth, Low-Rate Era. International Monetary Fund.
Dickey, D. A. and Fuller, W. A. (1979) ‘Distribution of the Estimators for Autoregressive Time Series with a Unit Root’, Journal of the American Statistical Association, 74(366), pp. 427–431. https://doi.org/10.2307/2286348
Do, H. Q., Bhatti, M. I. and Konya, L. (2016) ‘On ASEAN capital market and industry integration: a review’, Corporate Ownership and Control Journal, 2(1), pp. 8–23. https://doi.org/10.22495/cocv13i2p1
Donadelli, M. (2013) ‘Global integration and emerging stock market excess returns’,
Macroeconomics and Finance in Emerging Market Economies, 6(2), pp. 244–279. doi:
10.1080/17520843.2013.782885.
Everaert, G. and Pozzi, L. (2016) ‘Time-varying stock market integration and institutions in Europe: a Bayesian dynamic factor analysis’.
Forbes, K. J. and Rigobon, R. (2002) ‘No contagion, only interdependence: measuring stock market comovements’, The Journal of Finance. Wiley Online Library, 57(5), pp. 2223–2261. https://doi.org/10.1111/0022-1082.00494
Frijns, B., Tourani-Rad, A. and Indriawan, I. (2012) ‘Political crises and the stock market integration of emerging markets’, Journal of Banking & Finance. Elsevier, 36(3), pp. 644– 653. https://doi.org/10.1016/j.jbankfin.2011.05.007
Gagnon, M.-H., Power, G. J. and Toupin, D. (2016) ‘International stock market
cointegration under the risk-neutral measure’, International Review of Financial Analysis. Elsevier, 47, pp. 243–255. https://doi.org/10.1016/j.irfa.2016.08.002
Graham, M., Kiviaho, J. and Nikkinen, J. (2012) ‘Integration of 22 emerging stock markets: A three-dimensional analysis’, Global Finance Journal. Elsevier, 23(1), pp. 34– 47. https://doi.org/10.1016/j.gfj.2012.01.003
Guesmi, K., Moisseron, J.-Y. and Teulon, F. (2014) ‘Integration versus segmentation in Middle East North Africa equity market: Time variations and currency risk’, Journal of
https://doi.org/10.1016/j.intfin.2013.10.005
Hardouvelis, G. A., Malliaropulos, D. and Priestley, R. (2006) ‘EMU and European stock market integration’, The Journal of Business. JSTOR, 79(1), pp. 365–392.
https://doi.org/10.1086/497414
Horvath, R. and Petrovski, D. (2013) ‘International stock market integration: Central and South Eastern Europe compared’, Economic Systems. Elsevier, 37(1), pp. 81–91.
https://doi.org/10.1016/j.ecosys.2012.07.004
Huyghebaert, N. and Wang, L. (2010) ‘The co-movement of stock markets in East Asia: Did the 1997--1998 Asian financial crisis really strengthen stock market integration?’,
China Economic Review. Elsevier, 21(1), pp. 98–112.
https://doi.org/10.1016/j.chieco.2009.11.001
James, G. et al. (2013) An introduction to statistical learning. Springer. https://doi.org/10.1007/978-1-4614-7138-7
Killick, R. and Eckley, I. (2014) ‘changepoint: An R Package for Changepoint Analysis’,
Journal of Statistical Software, 58(3), pp. 1–19. https://doi.org/10.18637/jss.v058.i03
Killick, R., Fearnhead, P. and Eckley, I. a. (2012) ‘Optimal detection of changepoints with a linear computational cost’, Journal of the American Statistical Association, 107(500), pp. 1590–1598. doi: 10.1080/01621459.2012.737745.
Lau, C. K. M. and Sheng, X. (2018) ‘Inter- and intra-regional analysis on spillover effects across international stock markets’, Research in International Business and Finance. Elsevier, 46(January), pp. 420–429. doi: 10.1016/j.ribaf.2018.04.013.
Lee, G. and Jeong, J. (2016) ‘An Investigation of Global and Regional Integration of ASEAN Economic Community Stock Market: Dynamic Risk Decomposition Approach’,
Emerging Markets Finance and Trade. Taylor & Francis, 52(9), pp. 2069–2086.
https://doi.org/10.1080/1540496X.2016.1156528
Lee, H. and Cho, S. M. (2017) ‘What drives dynamic comovements of stock markets in the Pacific Basin region?: A quantile regression approach’, International Review of
Economics and Finance. Elsevier Ltd, 51(March 2015), pp. 314–327. doi:
10.1016/j.iref.2017.05.005.
Lehkonen, H. (2014) ‘Stock market integration and the global financial crisis’, Review of
Finance, 19(5), pp. 2039–2094. https://doi.org/10.1093/rof/rfu039
Loh, L. (2013) ‘Co-movement of Asia-Pacific with European and US stock market returns: A cross-time-frequency analysis’, Research in International Business and Finance.
Elsevier, 29, pp. 1–13. https://doi.org/10.1016/j.ribaf.2013.01.001
Narayan, S., Sriananthakumar, S. and Islam, S. Z. (2014) ‘Stock market integration of emerging Asian economies: patterns and causes’, Economic Modelling. Elsevier, 39, pp. 19–31. https://doi.org/10.1016/j.econmod.2014.02.012
Pasioura, F. et al. (2013) ‘On the integration of European capital markets’, Managerial
Finance. Emerald Group Publishing Limited, 39(9), pp. 825–836.
https://doi.org/10.1108/MF-01-2010-0002
Surveys. Wiley Online Library, 17(4), pp. 571–608.
https://doi.org/10.1111/1467-6419.00205
Phylaktis, K. (1997) ‘Capital market integration in the Pacific-Basin region: An analysis of real interest rate linkages’, Pacific-Basin Finance Journal. Elsevier, 5(2), pp. 195–213. https://doi.org/10.1016/S0927-538X(97)00011-5
Phylaktis, K. and Ravazzolo, F. (2002) ‘Measuring financial and economic integration with equity prices in emerging markets’, Journal of International Money and Finance. Elsevier, 21(6), pp. 879–903. https://doi.org/10.1016/S0261-5606(02)00027-X
Prasad, E. et al. (2005) ‘Effects of financial globalization on developing countries: some empirical evidence’, in India’s and China’s Recent Experience with Reform and Growth. Springer, pp. 201–228.
Pukthuanthong, K. and Roll, R. (2009) ‘Global market integration: An alternative measure and its application’, Journal of Financial Economics. Elsevier, 94(2), pp. 214–232.
https://doi.org/10.1016/j.jfineco.2008.12.004
Rodriguez, J. C. (2007) ‘Measuring financial contagion: A copula approach’, Journal of
Empirical Finance. Elsevier, 14(3), pp. 401–423.
https://doi.org/10.1016/j.jempfin.2006.07.002
Shabri Abd. Majid, M., Kameel Mydin Meera, A. and Azmi Omar, M. (2008)
‘Interdependence of ASEAN-5 stock markets from the US and Japan’, Global Economic
Review. Taylor & Francis, 37(2), pp. 201–225.
https://doi.org/10.1080/12265080802021201
Srivastava, A., Bhatia, S. and Gupta, P. (2015) ‘Financial Crisis and Stock Market Integration: An Analysis of Select Economies’, Global Business Review. SAGE Publications Sage India: New Delhi, India, 16(6), pp. 1127–1142.
https://doi.org/10.1177/0972150915604519
Syllignakis, M. N. and Kouretas, G. P. (2010) ‘German, US and Central and Eastern European stock market integration’, Open Economies Review. Springer, 21(4), pp. 607– 628. https://doi.org/10.1007/s11079-009-9109-9
Tai, C.-S. (2007) ‘Market integration and contagion: Evidence from Asian emerging stock and foreign exchange markets’, Emerging Markets Review. Elsevier, 8(4), pp. 264–283. https://doi.org/10.1016/j.ememar.2006.09.011
Team, R. C. (2016) ‘R: A Language and Environment for Statistical Computing’, R
Foundation for Statistical Computing, 0. doi: 10.1007/978-3-540-74686-7.
Team, Rs. (2015) ‘RStudio: Integrated Development Environment for R’. Boston, MA: RStudio, Inc.
Yarovaya, L. and Lau, M. C. K. (2016) ‘Stock market comovements around the Global Financial Crisis: Evidence from the UK, BRICS and MIST markets’, Research in
International Business and Finance. Elsevier B.V., 37, pp. 605–619. doi:
10.1016/j.ribaf.2016.01.023.
Data, codes and libraries used in analysis can be found in Mendeley Data Repository: http://dx.doi.org/10.17632/chnwtj3ngn.1