Is there a long run relationship between
stock returns and monetary variables:
evidence from an emerging market
G UÈ L N U R M U R A D O GÄ L U * , K I V I LC I M M E T _IIN{ and R E H A A R G A CË}The Manchester School of Accounting and Finance, Manchester, UK,{ Department of Economics, Bilkent University, Ankara, Turkey and } YKB Bilgi Cagi Bankacilik Ussu, Optimus-2, Kocaeli, Turkey
Literature that provides empirical evidence about the long-term relationship between stock returns and monetary variables in emerging markets is limited. In those mar-kets, unlike in mature ones, market participants and the availability of information as well as its quality, change rapidly through time. The purpose of this study is to examine the long-term relationship between stock returns and monetary variables in an emerging market through time by using the cointegration technique. The data-base is set up at daily frequency of variables that are customarily used by the ®nancial media as determinants of stock investments and the cointegration technique enables us to consider changes in long-run steady-state properties of the equilibrium relationship between the non-stationar y stock prices and monetary variables. The ®ndings of this study indicate that, overall results should not be used in formulating investment strategies because they can be misleading in the sense that the variables that explain stock prices might change through time. In the case of ISE, as the market became more mature, the in¯uence of monetary expansion and interest rates disappeared and foreign currency prices regained their expected signi®cance.
I . I N T R O D U C T I O N
Cointegration is an attractive technique in examining ®nancial markets due to the fact that it allows an analysis of the long run equilibrium relationship while accounting for the nonstationarit y in ®nancial time series. Many ®nan-cial variables are known to exhibit unit roots (Nelson and Plosser, 1982) and diVerenced price series (return series) are used in traditional stock market studies. However, the Cointegration technique developed by Engle and Granger (1987), permits the use of individual time series at levels even if they are nonstationary. These variables are said to be cointegrated if their linear combination is stationary in levels. Cointegration, thus, implies a long-run equilibrium relation whereby deviations from this long-run equilibrium relation must eventually be corrected, since they are steady state.
The purpose of this study is to examine the long-run relationship between stock returns and monetary variables in an emerging market that evolved through time. In par-ticular, the possible existence of a gradual change in long run steady state relationships at diVerent stages of devel-opment is examined since the establishment of the Turkish Stock Market. In this analysis monetary variables are used as the relevant information set because of the overwhelm-ing role of government in ®nancial markets as well as the lack of ®rm speci®c information especially during the initial phases of development of the stock market. Changes in the long-run steady-state properties of the equilibrium rela-tionship is tested by following Engle and Granger’s (1987) two step cointegration approach.
This study is initiated by Fama’s (1991) concluding remarks of his seminal survey article that encourages work `. . . that relates cross section properties of expected
Applied Financial Economics ISSN 0960±3107 print/ISSN 1466±4305 online # 2001 Taylor & Francis Ltd
http://www.tandf.co.uk/journals DOI: 10.1080 /0960310011009441 1
641
returns to the variation of expected returns, through time, and (. . .) relates the behaviour of expected returns to the real economy. . .’ (Fama, 1991, p. 1610). In the literature, there are a limited number of studies explaining stock market behaviour by using the macroeconomic variables (Pearce and Roley, 1985; Darrat and Mukherjee, 1987; Darrat, 1988; Hancock, 1989; Bulmash and Trivoli, 1991) and even few that analyse the changes in market behaviour at diVerent stages of development (Dawson, 1984; MuradogÄlu and AydogÄan, 2001). The more recent use of cointegration methodology enables the analysis of the long run steady state properties of stock prices and macro-economic variables in this context.
The distinguishing characteristic of this study is the use of daily data which permits the analysis of changes in the long run relationship between stock returns and monetary variables, if any, through time during the short history of the Turkish Stock Market. For that purpose, variables are used that are available on a daily basis, frequently used by the ®nancial media and whose collection is not costly for investors (Mishkin, 1982). DiVerent developmental phases of the market are de®ned in terms of the growth in size and transactions volume. Cointegration methodology enables us to separately analyse the long-run relationships through time by using the information revealed by the non-station-ary ®nancial variables. Although individual variables of concern may be non-stationary , their linear combinations might be stationary in cointegrating relations.
I I . T H E S E T T I N G
Turkey went through a structural change from a govern-ment regulated economic regime to a market oriented one with the initiation of the IMF sponsored stabilization package in 1980. Part of this package was concerned with ®nancial liberalization and integration of ®nancial markets. The deregulation of interest rates, liberalization of the for-eign trade regime, and convertibility of Turkish lira were among the ®rst items in the agenda. In 1986, Istanbul Securities Exchange (ISE) became operational with 42 listed companies. Until a manual system was established at the end of 1987, trade ¯oor activities were not limited to licensed brokers; individual investors could execute their orders directly. In 1989, with the aim of further liberaliza-tion, foreign investors were permitted to hold stock port-folios at ISE. Foreign participants who were mainly institutional investors expanded the volume of trade start-ing in 1990, and the market became highly sensitive to the foreign exchange rates. In 1993, computer aided trading procedures were introduced and this further increased volume of trade while insulating the market from insider traders. Since November 1994, all the stocks listed at ISE are traded by a computer assisted system. Today more than 200 stocks are traded during two sessions (morning and
afternoon) every day and daily trading volume has exceeded $100 million.
During the short history of the emerging Turkish stock market there are a limited number of studies explaining stock returns using macro-economic variables. Erol and AydogÄan (1991) testing an arbitrage pricing model reported that portfolio returns are sensitive to unexpected in¯ation and real rate of return. MuradogÄlu and OÈnkal (1992) estimated separate equations to distinguish between expected and unexpected components of monetary and ®s-cal policy and reported a signi®cant lagged relationship between these policy instruments and stock returns. MuradogÄlu and Metin (1996) using cointegration method and monthly values of various macro-economic variables reported that proxy eVect was observed in the short run, while a real balance eVect appeared in the long run equi-librium relationship. We were motivated with this ®nding in constructing a data base with higher frequency data and testing the long term relationship between stock returns and macro economic variables at diVerent phases of mar-ket development. High frequency data are more informa-tive in the sense that investment horizons are short in the highly in¯ationary environment of Turkey and stock inves-tors are provided various descriptive information on the sensitivity of stock returns to interest rates, money and exchange rates by the ®nancial media. Analyses are con-ducted at diVerent phases as the market grows in size and volume to elude overall results obscuring possible changes in this relationship. If the underlying relationships changed through time, policy implications of short run analysis would no longer be valid.
I I I . T H E D A T A
The relationship between stock prices, represented by the ISE Composite Index and several monetary variables are examined. These variables are overnight interest rates, several de®nitions money supply (M1, M2 and currency in circulation), and foreign exchange rates of US dollar, German mark, British sterling and Japanese yen. In the choice of these variables two criteria are used: (1) availabil-ity of daily observations; and (2) high frequency of use by the ®nancial media that makes data collection not costly for investors (Mishkin, 1982). Money supply variables represent monetary expansion in nominal terms which is expected to result in increased investments in stocks (MuradogÄlu and Metin, 1996). Interest rates and foreign exchange rates however, are included into the analysis as possible substitutes for stock investment (MuradogÄlu, 1992, 2000). The entire sample, from January 1988 to April 1995, consists of 1831 daily observations for log levels of each series.
The data set is divided into three sub-periods corre-sponding to diVerent developmental phases based on the
volume of trade in ISE. Summary information about stock market indicators are presented in Table 1. The ®rst sub-period (1988±1989) represents the initial phase, where ®rm-speci®c information ¯ow is poor, market participants are few and thus the volume of trade is low. The second sub-period (1990±1992) is characterized by the higher volume of trade generated mainly by foreign and domestic institu-tional investors. In this period the number of ®rms traded in the market has increased and information ¯ow has improved through the introduction of various disclosure requirements. During the third sub-period (1993±1995), market expansion continued due to the considerable increase of the amount and quality of information by improved disclosure requirements. The introduction of computer aided trading mechanisms increased operational e ciency as well as the facilitating information dissemina-tion.
Due to the uncertainties imposed by the structurally high in¯ation, term structures in Turkey are much shorter com-pared to those in mature markets. Market participants perceive one year as the long term, four months as the medium term and one week as the short term.1 Besides, during the research period, the maximum maturities of T-bills, range between 360 days to 120 days (Selcuk, 1995) and the maximum term structure for TL dominated as well as foreign exchange time deposits has been one year. It is also known that the average holding period for stock investments has been around three months (Muradoglu, 1992). Therefore, the sub-periods as de®ned previously can be considered as representing the long run for the Turkish stock market. Regarding the maturity structures of the Turkish economy on one side and the use of daily frequency in the data set on the other, we ®rst analysed the stochastic properties of the data and then the long run
relationship between the variables of concern by using the cointegration methodology at diVerent sub-periods.
Stochastic properties of the data are investigated for each of the nine variables by applying the Augmented Dickey-Fuller(ADF) unit root test (Dickey and Fuller, 1981) at levels and ®rst diVerences for the whole research period, as well as the three sub-periods. ADF values for each variable are calculated by estimating regression equa-tions for a random walk, a random walk with drift and a random walk with drift and trend, respectively. For each estimation, Hsiao’s (1981) ®nal prediction error (FPE) model selection criteria is examined at lag lengths of 1 to 30 and the one with the smallest FPE is selected. In all cases, the variables have unit roots in levels i.e. they are not I(0) at 1% signi®cance. However, ADF test applied on the ®rst diVerenced series do not exhibit a unit root, i.e. are I(1) in almost all speci®cations. Table 2 reports ADF test results using Fuller’s (1976) critical value for the I(1) series, with the constant and trend speci®cation.2 The possible existence of a long run relationship between the non-stationary stock prices and monetary variables, can thus be tested by using the cointegration technique developed by Engle and Granger (1987).
I V . C O I N T E G R A T I O N A N A L Y S I S
If xtdonotes an nx1 vector and each of series in xtare I …d†
and there exists an nx1 vector a such that xt0a ¹ I…d ¡ b†,
then xt0¢ a ¹ CI…d; b† where a is called the cointegrating
vector. An arbitrary linear combination of non-stationar y time series …yt¡ axt† such as the ones described in Section
II, is expected to be nonstationary . However, if these series are cointegrated, a may take a value, such that …yt¡ axt† is
Table 1. Main indicators of ISE, exchange rates and monetary variables
ISE* ISE ISE Dollar Mark Yen Sterling M1 M2 Currency
annual # of annual annual annual annual annual annual annual annual
trading listed change % % % % % % %
Year volume ®rms in index change change change change change change change
1988 83 79 %746 %77 %58 %75 %71 %48 %71 %57 1989 752 76 %494 %28 %34 %12 %14 %81 %81 %93 1990 5226 110 %47 %27 %43 %34 %51 %44 %44 %81 1991 8314 134 %34 %74 %72 %87 %70 %45 %62 %44 1992 8378 145 %78.4 %68 %58 %70 %36 %89 %69 %68 1993 21278 160 %417 %69 %58 %88 %65 %66 %50 %71 1994 23203 176 %32 %166 %196 %198 %179 %81 %120 %100 1995** 4053 202 %75 %11 %25 %32 %15 %17 %33 %34
Notes: Source: Capital Markets Board (1995), ISE (1995), Is Bankasi Data Base * money values are in millions of US dollars
** only the ®rst 2 months of 1995 1
Interviews with several brokers and dealers. 2
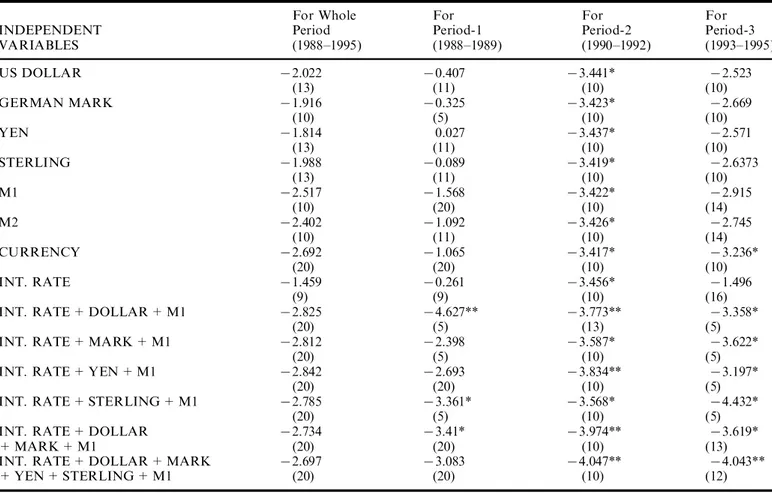
I …0†, indicating a stationary relationship between the vari-ables. The null hypothesis of no cointegration (against the alternative of cointegration) is tested using the Engle and Granger (1987) two step procedure. The ®rst step of this procedure involves regressing the stock prices on the mone-tary variables to obtain the OLS regression residuals. The second step is to test the existence of unit roots (i.e. no cointegration) in the OLS residuals using the ADF test. The results of ADF test statistics on cointegrating regres-sions (without constant and trend speci®cation) are pre-sented in Table 3 both for the whole research period and for the three sub-periods. The appropriate critical values are obtained from Engle and Granger (1987).
Stock prices do not cointegrate with any of the variables or with any group of variables for the whole research per-iod. But this result is not valid for all sub-periods. During the ®rst sub-period (1988±1989), stock prices do not coin-tegrate with any of the individual variables. The results are improved when more than one variable is added to the cointegrating regressions, with stronger results obtained in the interest rate, US dollar, M1 combination of indepen-dent variables. However, during the second sub-period (1990±1992), all the variables are cointegrated with the stock prices both when they enter to the regression equa-tions individually and in groups. The results are improved substantially when, besides interest rates and M1, US dol-lar and Japanese yen are added to the regression equations. For this sub-period, a long run steady state relationship
between monetary variables and stock prices is observed. During the third sub-period (1993±1995), none of the vari-ables except for currency in circulation cointegrate with the stock prices individually. Better results are achieved when independent variables are entered in groups. The noticeable result is obtained when all variables are entered into the cointegrating relationship. The long run steady state rela-tionship pursues during the 1993±1995 period but the result is weaker than that in the 1990±1991 period.
It is clear that, overall results in evaluating the long run relationships in emerging markets are misleading in the sense that they may indicate that a long run steady state relationship does not exist when in fact it does. Here, no cointegration relationship is found for whole research per-iod. However, when the emerging market characteristics of ISE are considered and the research period is divided into three sub-periods, it is observed that the cointegrating rela-tionships change through time. During the 1990±1992 per-iod, there is a long run steady state relationship between stock returns and monetary variables which may indicate that the diligent investors can exploit abnormal pro®ts at ISE by following monetary variables. Although dimin-ished, pro®t opportunities still exist during the 1993±1995 period. At this point, one needs to identify the partial in¯u-ence of the variables of concern. Therefore, static equations are estimated to show the changes in the size and sign of the parameters during the three sub-periods that indicate diVerent developmental phases of the market.
Table 2. ADF test results
For For For For
whole period Period-1 Period-2 Period-3
SERIES (1988±1995) (1988±1989) (1990±1992) (1993±1995) DISE 711.6464** 76.4349** 77.8574** 76.7807** (9) (10) (9) (13) DINT. RATE 710.1952** 76.2759** 75.2295** 75.3876** (28) (26) (27) (28) DDOLLAR 76.6158** 76.1590** 74.7007** 73.4898* (23) (20) (20) (23) DMARK 76.5665** 74.6765** 75.7793** 73.4482* (23) (19) (15) (23) DYEN 76.8389** 74.8990** 74.8762** 73.6492* (23) (19) (27) (23) DSTERLING 76.5909** 74.8572** 75.5981** 73.5165* (23) (19) (15) (23) DMI 78.6308** 75.4544** 75.4084** 74.8631** (24) (19) (24) (25) DM2 75.7527** 74.9122** 75.2957** 73.2016 (24) (19) (24) (25) DCURRENCY 711.6172** 75.2812** 712.6270** 78.1613** (19) (19) (14) (17)
Notes: (1) ADF test statistics reported here are based on regressions with constant and trend speci®cation; (2) Each ADF regression initially includes thirty lagged diVerences to ensure that the residuals are empirically white noise. Then a sequential reduction procedure is applied to eliminate the insigni®cant lagged diVerences. Values in parentheses show the optimum number of lags used according to the FPE criteria; (3) D denotes log diVerences; (4) Critical values for ADF test statistics are obtained from Fuller (1976, Table 8.5.2); and (5) (*) denotes ADF test statistics signi®cant at 5% and (**) signi®cant at 1%.
Static equations are estimated by using the contempora-neous values of the variables of concern and including con-stant, trend and four deterministic dummies representing the days of the week. In none of the equations deterministic dummies for daily seasonality appear to be signi®cant. Equations are estimated both for the whole research period and the three sub-periods. Variables enter each equation ®rst individually, and then in selected groups. Table 4 reports the static equations’ estimation results. In almost all of the cases, as expected constant and trend variables are signi®cant. Except for the second sub-period (1990± 1992), the explanatory power of the independent variables are high as indicated by the goodness of ®t measure of the equations. It is clear that during the second sub-period (1990±1992) most of the information that explains stock prices is left out from the speci®cation. This period is char-acterized by the increase in the number of ®rms traded in the market and expansion of information ¯ow through the introduction of various disclosure requirements. Investors can therefore be more concerned with the sudden and
abundant ¯ow of ®rm speci®c information. Thus, the static equations were re-estimated by using recursive least squares estimation and step dummies in this period. The ®rst step dummy receives the value minus one for the points that lie outside the upper bound of the two standard error region, and zero elsewhere. The second step dummy receives the value of plus one for the points that lie outside the lower bound of the two standard error region and zero elsewhere. These dummies had signi®cant coe cients in all the equations presented in Table 4c. In all cases, goodness of ®t measures improved but signs, sizes and signi®cance of the parameters did not change.
Since foreign currencies are considered to be substitutes for stock investment (MuradogÄlu, 1992), we expect a reverse relationship between their price levels. Interest rate on short term deposits is proxied by the interbank overnight rates which are also expected to be negatively related to stock prices. Monetary variables indicate poten-tial monetary expansion and are expected to be positively related to stock returns (MuradogÄlu and Metin, 1996). Table 3. Test of cointegration between stock prices and monetary variables
For Whole For For For
INDEPENDENT Period Period-1 Period-2 Period-3
VARIABLES (1988±1995) (1988±1989) (1990±1992) (1993±1995) US DOLLAR 72.022 70.407 73.441* 72.523 (13) (11) (10) (10) GERMAN MARK 71.916 70.325 73.423* 72.669 (10) (5) (10) (10) YEN 71.814 0.027 73.437* 72.571 (13) (11) (10) (10) STERLING 71.988 70.089 73.419* 72.6373 (13) (11) (10) (10) M1 72.517 71.568 73.422* 72.915 (10) (20) (10) (14) M2 72.402 71.092 73.426* 72.745 (10) (11) (10) (14) CURRENCY 72.692 71.065 73.417* 73.236* (20) (20) (10) (10) INT. RATE 71.459 70.261 73.456* 71.496 (9) (9) (10) (16)
INT. RATE + DOLLAR + M1 72.825 74.627** 73.773** 73.358*
(20) (5) (13) (5)
INT. RATE + MARK + M1 72.812 72.398 73.587* 73.622*
(20) (5) (10) (5)
INT. RATE + YEN + M1 72.842 72.693 73.834** 73.197*
(20) (20) (10) (5)
INT. RATE + STERLING + M1 72.785 73.361* 73.568* 74.432*
(20) (5) (10) (5)
INT. RATE + DOLLAR 72.734 73.41* 73.974** 73.619*
+ MARK + M1 (20) (20) (10) (13)
INT. RATE + DOLLAR + MARK 72.697 73.083 74.047** 74.043**
+ YEN + STERLING + M1 (20) (20) (10) (12)
Notes: (1) The values reported here are the ADF test t-statistics based on regressions without constant and trend, (2) Each ADF regression initially includes thirty lagged diVerences to ensure that the residuals are empirically white noise. Then a sequential reduction procedure is applied to eliminate the insigni®cant lagged diVerences. Values in parentheses show the optimum number of lags used according to the FPE criteria results for the residuals of the related equations; (3) The critical values for the ADF test statistics are obtained from Engle and Granger (1987, Table 2); (4) (*) denotes ADF test statistics signi®cant at 5% and (**) signi®cant at 1%.
Table 4. Static equations (dependent variable ˆ lindex)
C TR $ DM YEN ST M1 M2 CUR INT R2 DW F
1. Whole period (1988±1995) 8.122 0.0029 70.29 ± ± ± ± ± ± ± 0.8869 0.0051 2385.1 25.39 31.11 76.39 6.923 0.0026 ± 70.14 ± ± ± ± ± ± 0.8849 0.0049 2337 22.59 25.47 72.74 0.599 0.0029 ± ± 70.29 ± ± ± ± ± 0.8882 0.0052 2411.3 92.81 36.77 77.95 7.729 0.0028 ± ± ± 70.22 ± ± ± ± 0.8856 0.0051 2349.7 21.16 29.16 74.52 718.12 70.003 ± ± ± ± 2.78 ± ± ± 0.9165 0.0143 3332.7 719.54 715.29 26.51 73.854 0.0002 ± ± ± ± ± 1.036 ± ± 0.8907 0.0054 2473.8 74.002 0.508 10.32 78.214 70.002 ± ± ± ± ± ± 1.83 ± 0.9038 0.0134 2851.8 711.03 77.71 19.21 6.156 0.0234 ± ± ± ± ± ± ± 70.019 0.8844 0.0050 2321.1 61.801 107.93 70.755 721.56 70.004 70.576 ± ± ± 3.51 ± ± 0.266 0.9297 0.0415 3009.5 723.19 717.25 715.15 33.25 12.49 722.58 70.004 ± 70.505 ± ± 3.54 ± ± 0.26 0.9269 0.0398 2887.4 723.84 717.69 712.33 32.35 12.06 724.1 70.004 ± ± 70.45 ± 3.45 ± ± 0.26 0.930 0.0405 3030.1 725.82 717.43 715.57 33.04 12.39 721.31 70.004 ± ± ± 70.52 3.47 ± ± 0.27 0.927 0.0398 2900.3 722.49 717.34 712.66 32.24 12.27 720.04 70.004 71.36 0.87 ± ± 3.33 ± ± 0.25 0.931 0.0397 4938.3 721.15 716.83 710.74 6.50 30.96 11.98 722.81 70.003 70.52 1.71 70.84 70.61 3.08 ± ± 0.247 0.933 0.0375 3613.4 719.35 716.55 72.84 7.27 76.35 73.1 27.0 11.82 2. First sub-period (1988±1989) 54.83 0.013 76.92 ± ± ± ± ± ± ± 0.87 0.086 1682.9 52.35 52.83 746.62 38.77 0.008 ± 75.029 ± ± ± ± ± ± 0.538 0.0204 291.6 18.67 19.37 715.77 16.14 0.008 ± ± 74.54 ± ± ± ± ± 0.84 0.0594 1314.4 64.83 49.25 740.79 43.09 0.008 ± ± ± 74.84 ± ± ± ± 0.81 0.0508 1073.2 42.37 44.06 736.47 731.82 70.008 ± ± ± ± 4.368 ± ± ± 0.70 0.0527 584.93 721.52 720.43 25.59 720.26 70.005 ± ± ± ± ± 2.766 ± ± 0.38 0.0074 153.38 75.86 75.61 7.59 76.99 70.002 ± ± ± ± ± ± 1.67 ± 0.409 0.0139 173.46 74.97 74.89 9.24 6.82 0.001 ± ± ± ± ± ± ± 70.19 0.329 0.0152 123.08 33.0 10.51 73.97 32.48 0.007 75.52 ± ± ± 1.48 ± ± 70.094 0.899 0.098 1117.6 14.5 13.34 730.66 10.93 ± 75.0 79.21 70.003 ± 72.17 ± ± 3.48 ± ± 70.17 0.739 0.0586 352.56 72.82 74.28 77.34 17.69 75.58 5.32 0.004 ± ± 73.76 ± 1.13 ± ± 70.16 0.867 0.0993 818.28 2.97 7.27 724.36 6.49 77.36 23.15 0.003 ± ± ± 73.78 1.45 ± ± 70.17 0.849 0.0748 702.7 8.47 5.40 721.44 8.01 77.16 31.45 0.007 75.60 0.195 ± ± 1.52 ± ± 70.09 0.900 0.0978 894.14 12.69 12.04 728.3 0.96 10.81 74.69 15.58 0.005 72.2 3.99 72.27 72.73 0.73 ± ± 70.09 0.929 0.12 930.49 4.57 8.85 7.42 12.66 75.17 76.07 5.58 75.35 Continued
Table 4. continued
C TR $ DM YEN ST M1 M2 CUR INT R2 DW F
3. Second sub-period (1990±1992) ± estimated with step dummies
21.45 0.003 71.72 ± ± ± ± ± ± ± 0.326 0.089 71.382 27.51 16.57 716.91 5.63 70.001 ± 0.37 ± ± ± ± ± ± 0.037 0.039 5.72 5.57 72.70 2.61 12.65 0.004 ± ± 71.66 ± ± ± ± ± 0.223 0.074 42.33 35.41 12.07 712.25 4.25 70.001 ± ± ± 0.491 ± ± ± ± 0.224 0.071 35.52 5.01 74.75 4.75 2.68 70.001 ± ± ± ± 0.57 ± ± ± 0.227 0.073 43.83 2.70 75.62 5.63 11.5 0.001 ± ± ± ± ± 70.30 ± ± 0.083 0.060 11.03 5.66 1.57 71.59 2.77 70.001 ± ± ± ± ± ± 0.61 ± 0.310 0.100 47.49 4.63 79.0 9.19 7.50 70.000 ± ± ± ± ± ± ± 0.194 0.157 0.078 22.96 69.03 74.118 7.042 16.5 0.002 71.33 ± ± ± 0.16 ± ± 0.095 0.302 0.086 39.71 9.54 6.047 711.33 1.46 3.33 76.90 70.003 ± 1.21 ± ± 0.54 ± ± 0.34 0.174 0.062 22.17 74.39 79.63 7.81 5.03 10.43 7.50 0.002 ± ± 71.14 ± 0.343 ± ± 0.104 0.228 0.076 27.13 5.12 3.64 76.87 2.94 3.17 710.01 70.004 ± ± ± 0.80 1.09 ± ± 0.26 0.428 0.127 61.15 77.52 713.41 8.70 11.71 11.15 7.22 70.001 71.64 1.82 ± ± 70.05 ± ± 0.25 0.390 0.0933 78.64 4.45 71.74 715.86 13.38 70.45 8.83 6.75 70.001 71.53 1.58 70.23 0.276 70.07 ± ± 0.23 0.449 0.106 37.01 3.59 70.7 710.73 9.89 71.2 2.46 70.62 7.61 4. Third sub-period (1993±1995) 14.4 0.005 70.63 ± ± ± ± ± ± ± 0.89 0.031 2377 29.29 28.29 711.52 15.58 0.006 ± 70.82 ± ± ± ± ± ± 0.91 0.041 2828.8 36.2 32.78 715.9 11.01 0.005 ± ± 70.54 ± ± ± ± ± 0.88 0.028 2208.6 45.3 23.65 79.36 15.3 0.006 ± ± ± 70.7 ± ± ± ± 0.90 0.034 2503.7 30.1 29.2 712.9 8.98 0.003 ± ± ± ± 70.02 ± ± ± 0.87 0.021 1880.5 7.19 12.4 70.19 18.56 0.005 ± ± ± ± ± 70.82 ± ± 0.89 0.027 2360.3 21.4 27.2 711.3 10.88 0.004 ± ± ± ± ± ± 70.21 ± 0.87 0.022 1895.5 10.24 14.3 72.0 8.83 0.003 ± ± ± ± ± ± ± 70.02 0.87 0.022 1887.1 125.65 61.3 ± 71.34 15.21 0.006 70.68 ± ± ± 70.05 ± ± 0.03 0.89 0.033 1199.3 10.37 16.59 711.67 70.39 1.82 14.39 0.006 ± 70.84 ± ± 0.11 ± ± 0.03 0.91 0.043 1417.8 10.8 19.3 715.9 0.98 1.75 11.36 0.005 ± ± 70.56 ± 70.03 ± ± 0.017 0.88 0.029 1104 7.74 15.1 79.25 70.24 0.89 15.1 0.006 ± ± ± 70.74 0.036 ± ± 0.033 0.897 0.037 1257.8 10.58 17.37 712.93 0.29 1.83 9.22 0.005 2.06 72.77 ± ± 0.41 ± ± 70.03 0.924 0.0622 1405.0 7.14 18.63 11.22 715.5 3.77 71.81 19.36 0.004 0.27 73.44 2.21 0.34 0.32 ± ± 70.03 0.942 0.0799 1335.6 14.18 16.81 0.84 716.7 13.31 0.89 3.32 72.26 Continued
Considering the whole research period (where no cointe-grating relationship is found) presented in Table 4a, it is observed that except for the insigni®cant interest rate coef-®cient all of the variables of concern are signi®cant and have expected signs. Similar to the overall research period, during the ®rst sub-period (1988±1989) all of the variables used in static equations have signi®cant coe cients and expected signs. The second sub-period (1990±1992), for which it is safely argued that stock prices and the monetary variables are cointegrated needs to be focused. In the bivariate regressions, money supply and the interest rate both have positive and signi®cant coe cients. The signs of the German mark and British sterling coe cients also become positive in this period. When fund portfolios are investigated, it is evident that a representative portfolio carries T-bills with weights exceeding 80% (ISE, 1995). When individual stock investors’ portfolios are considered it is noticed that foreign exchange holdings constitute a major portion of their portfolios (MuradogÄlu, 1992). Diversi®cation using foreign exchange and T-bills might explain the unexpected sign changes observed in the 1990±1992 period. During the third sub-period (1993± 1995) money supply and interest rates do not have signi®-cant coe cients but all foreign exchange rate variables’ coe cients are signi®cant and have expected signs. In this period market expansion continued and as the market became more mature, the in¯uence of monetary expansion and interest rates disappeared and foreign currency prices regained their expected signs.
V . C O N C L U S I O N S
Literature that provides empirical evidence about a poten-tial change in the long run relationship between stock
returns and macro-economic variables in emerging markets is limited. In those markets, unlike in mature ones, market structures, market participants and the availability of information as well as its quality change rapidly through time. Therefore, results regarding the whole research per-iod may lead to incorrect evaluations as to the relationship between the variables. Due to such misleading interpreta-tions, pro®table investment strategies may be abandoned. This study investigates the relationship between stock prices and monetary variables at diVerent phases of devel-opment of ISE represented in three sub-periods during 1988±1995. For that purpose we use the cointegration tech-nique that enables us to examine the long run relationship between the non-stationar y stock prices and monetary vari-ables. The data base is set up at daily frequency of variables that are customarily used by the ®nancial media as deter-minants of stock investments.
Results regarding the whole research period (1988±1995) display no cointegrating relationship between stock prices and any of the variables or groups of variables of concern. But overall results are misleading for investors who would like to exploit pro®t opportunities in the sense that such occasions exist, despite expectations, especially as the mar-ket develops over time. The only sub-period that the stock prices do not cointegrate with monetary variables is the ®rst sub-period (1988±1989). However, while during the second sub-period (1990±1992) all variables are cointe-grated with stock prices both individually and in groups, during the third sub-period (1993±1995) only groups of variables are cointegrated with stock prices.
The diligent investor who wants to exploit pro®t oppor-tunities in emerging stock markets should consider the rapidly changing characteristics of such markets. First, overall results should not be used in formulating long run investment strategies because they can be misleading in the Table 4. continued
Index INT $ DM YEN ST M1 M2 CUR
5. Degree of correlation between the variables
Index 1 INT 0.2452 1 $ 0.9365 0.3255 1 DM 0.9422 0.2930 0.9968 1 YEN 0.9465 0.3022 0.9965 0.9985 1 ST 0.9366 0.3095 0.9986 0.9985 0.9967 1 M1 0.9591 0.2487 0.9714 0.9730 0.9690 0.972 1 0 M2 0.9574 0.2166 0.9751 0.9824 0.9781 0.978 0.9928 1 3 CUR 0.9576 0.2612 0.9779 0.9796 0.9763 0.978 0.9977 0.9929 1 5
Notes: (1) Four deterministic dummies for seasonality (day of the week eVect) are added to the equations; (2) In each cell, ®rst row gives the beta coe cients and the second row gives the corresponding t-statistics; (3) The following symbols denote: C: constant; TR: trend; $: dollar; DM: mark; ST: sterling; CUR: currency in circulation; INT: interest rate; DW: Durbin Watson Statistics; F: F-test; and (4) All static estimations relate to contemporaneous values of the variables.
sense that they may assume the existence of a relationship when in fact it does not exist. Second, investors should be aware that the variables that explain stock prices might change through time. In the case of ISE, as the market became more mature, the in¯uence of monetary expansion and interest rates disappeared and foreign currency prices re-gained their expected signi®cance.
We would expect future work in this area to concentrate on the following research avenues. First, modelling eVorts should be extended to accommodate error correction speci®cation that enables the analysis of short run dynamics together with the long run steady state proper-ties. Second, research in other emerging markets are expected to contribute to our understanding of common trends in the long run relationship between stock returns and monetary variables. Finally, country comparisons of emerging versus mature markets will guide researchers and investors in identifying the market structures that lead to diVerences in the form of the long run relationship between stock returns and monetary variables.
R E F E R E N C ES
Bulmash, B. S. and Trivoli, W. G. (1991) Time-lagged interactions between stock prices and selected economic variables, The Journal of Portfolio Management, Summer, 61±7.
Dawson, S. M. (1984) The trend toward e ciency for less devel-oped stock exchanges: Hong Kong, Journal of Business Finance and Accounting, 11(2), 151±61.
Darrat, A. F. (1988) On ®scal policy and the stock market, Journal of Money Credit and Banking, 20, 355±63.
Darrat, A. F. and Mukherjee, T. K. (1987) The behaviour of the stock market in a developing economy, Economics Letters,
22, 273±8.
Dickey, D. A. and Fuller, W. A. (1981) Likelihood ratio statistics for autoregressive time series with a unit root, Econometrica,
49, 1057±72.
Engle, R. F. and Granger, C. W. (1987) Cointegration and error correction: representation, estimation, and testing, Econometrica, 55, 251±76.
Erol, UÈ and AydogÄan, K. (1991) Asset pricing in an emerging market: the Turkish case, paper presented in the 18th Annual Meeting of European Finance Association, held in Rotterdam, Holland.
Fama, E. F. (1991) E cient capital markets: II, Journal of Finance, 46, 1575±617.
Hancock, D. G. (1989) Fiscal policy, monetary policy and the e ciency of the stock market, Economics Letters, 31, 65±9.
Hsiao, C. (1981) Autoregressive modelling and money income causality detection, Journal of Monetary Economics, 7, 85± 106.
Istanbul Securities Exchange, Monthly Bulletin, December 1995.
Mishkin, F. S. (1982) Does anticipated monetary policy matter? An econometric investigation, Journal of Political Economy,
90, 22±51.
MuradogÄlu, G. (1992) Factors in¯uencing demand for stocks by individual investors, Proceedings of Izmir Iktisat Kongresi, vol. 1.
MuradogÄlu, G. (2000) Turkish Stock Market Anomalies and Pro®t Opportunities, Security Market Imperfections in Worldwide Equity Markets (Ed. Keim, D. and Ziemba, W.), 364±390.
MuradogÄlu, G. and AydogÄan, K. (2001) Price reactions to the implementation of stock dividends and rights oVerings: e ciency of Turkish stock market through time, European Journal of Finance, 7, 1±20.
MuradogÄlu, G. and OÈnkal, D. (1992) Semistrong form of e -ciency in the Turkish stock market, METU Studies in Development, 19(2), 197±208.
MuradogÄlu, G. and Metin, K. (1996) E ciency of the Turkish stock exchange with respect to monetary variables: a cointe-gration analysis, European Journal of Operational Research,
90, 566±76.
Nelson, C. R. and Plosser, C. I. (1982) Trends and random walks in macroeconomic time series: some evidence and implica-tions, Journal of Monetary Economics, 10, 139±62.
Pearce, D. K. and Roley, V. V. (1985) Stock Prices and Economic News, Journal of Business, 8(1), 49±67.
SelcËuk, F. (1995) The Term Structure of Interest Rates in High In¯ation Environment: Some Evidence from Turkey, Paper Presented at the EEA Conference, March 17±19, New York, NY.