MOLTEN SALT ASSISTED SELF-ASSEMBLY
PROCESS: SYNTHESIS OF MESOPOROUS
TRANSITION METAL OXIDE THIN FILMS
AND CdSe SENSITIZED TiO2 PHOTOANODES
A THESIS SUBMITTED TO
THE GRADUATE SCHOOL OF ENGINEERING AND SCIENCE
OF BILKENT UNIVERSITY
IN PARTIAL FULFILLMENT OF THE REQUIREMENTS FOR
THE DEGREE OF
MASTER OF SCIENCE
IN
CHEMISTRY
By
Muammer Yusuf Yaman
September 2017
ii
MOLTEN SALT ASSISTED SELF-ASSEMBLY PROCESS: SYNTHESIS OF MESOPOROUS TRANSITION METAL OXIDE THIN FILMS AND CdSe SENSITIZED TiO2 PHOTOANODES
By Muammer Yusuf Yaman September 2017
We certify that we have read this thesis and that in our opinion it is fully adequate, in scope and in quality, as a thesis for the degree of Master of Science.
_________________________________ Ömer Dağ (Advisor)
_________________________________ Ayşen Yılmaz _________________________________ Emrah Özensoy _________________________________ Ferdi Karadaş _________________________________ Burak Ülgüt
Approved for the Graduate School of Engineering and Science:
________________________________________ Ezhan Karaşan
iii
ABSTRACT
MOLTEN SALT ASSISTED SELF-ASSEMBLY
PROCESS: SYNTHESIS OF MESOPOROUS
TRANSITION METAL OXIDE THIN FILMS AND
CdSe SENSITIZED TiO
2PHOTOANODES
Muammer Yusuf Yaman M. S. in Chemistry Advisor: Ömer Dağ September 2017
Fabrication of mesoporous transition metal oxide thin films are important for the development of many energy related technologies. Molten salt-assisted-self-assembly (MASA) method, that has simple stages such as preparation of a clear solution of the precursors in water or ethanol, coating of this solution on a substrate as a thin film, and calcination of the film at an elevated temperature is a simple and useful method to fabricate mesoporous thin films. In this thesis, mesoporous transition metal oxides thin films and CdSe sensitized TiO2 photoanodes have been
fabricated using MASA approach and characterized using multi-analytical techniques. In the first part of the thesis, CdSe/TiO2 thin films were synthesized by
reacting mesoporous CdTiO3 thin film under a H2Se gas atmosphere. Many
synthesis parameters were optimized in the synthesis of mesoporous CdTiO3 thin
films. The film thickness, calcination temperature, and H2Se reaction condition have
been changed to determine the optimum synthesis conditions for an efficient photoanode of a quantum dot sensitized solar cell (QDSSC). However, the reactivity of CdTiO3 towards to H2Se gas is low and selenium forms as a side product upon
H2Se reaction. For the reactivity problem, mesoporous CdO-SiO2 (denoted as
iv
population, as the sensitizer in the CdSe sensitized TiO2 photoanode. However, The
meso-CdSe-SiO2 thin films are not active in solar cells because of an insulating
nature of silica.
Second part of the thesis involves infiltration of MASA solution (precursors of salt-surfactant and a polymerizing agent, such as Si(OCH3)4 or Ti(OC4H9)4) into the pore
of prefabricated films (using P25) of mesoporous titania (denoted as meso-P25). In latter steps, the above films were calcined and then reacted under H2Se to obtain the
photoanodes (denoted meso-CdSe-SiO2-P25 and meso-CdSe-TiO2-P25). The
synthesis conditions were optimized by changing the synthesis parameters (such as precursor concentrations, calcination, and H2Se reaction temperatures) and using
XRD, FTIR, Raman, 29Si-MAS-NMR, EXAFS, XANES, SEM, TEM, N2-sorption
techniques. However, formation of a meso-CdO-SiO2 thin film, on top of the
meso-P25 film, was observed upon using a concentrated MASA solution in the infiltration step. Therefore, multiple loading method has been established to increase the CdSe-SiO2 layer in the pores of meso-P25 using diluter MASA solutions. Also, the H2Se
reaction conditions were optimized by controlling the reaction atmosphere and temperature. Effects of silica amount in the CdO-SiO2 system on the photoanode has
been examined by measuring the I-V curves, of the solar cells fabricated using our photoanodes.
In the last part of the thesis, the MASA method has been adopted for the synthesis of mesoporous transition metal oxides thin films. Firstly, mesoporous iron oxide film has been synthesized using MASA approach and characterized using above analytical tools. The thermal and structural properties of the [Fe(H2O)6](NO3)3/surfactants (10-lauryl ether and CTAB) mesophases have been
investigated for the synthesis of a well-ordered iron oxide films. Effects of calcination temperature, on the crystallinity, and porosity of mesoporous Fe2O3, have
been demonstrated by using TEM, SEM, XRD, and N2 sorption techniques. Later,
other mesoporous transition metal oxides (such as ZnO, CuO, NiO, Co3O4 and
Mn2O3) have been synthesized using the MASA approach. The transition metal salts
([Zn(H2O)6](NO3)2, [Cu(H2O)6](NO3)2, [Ni(H2O)6](NO3)2, [Co(H2O)6](NO3)2,
[Mn(H2O)6](NO3)2)-surfactant mesophases have been used as the starting liquid
v
obtain the thin films. The synthesized mesoporous metal oxide thin films were characterized by using above analytical tools.
Keywords: Mesoporous Materials, Lyotropic Liquid Crystals,
vi
ÖZET
ERİYİK TUZ YARDIMLI KENDİLİĞİNDEN
OLUŞMA (EYKO) YÖNTEMİ: MEZOGÖZENEKLİ
GEÇİŞ METAL OKSİT İNCE FİLMLERİN VE CdSe
DUYARLI TiO
2FOTO-ANOTLARIN SENTEZİ
Muammer Yusuf Yaman Kimya, Yüksek Lisans Tez Danışmanı: Ömer Dağ
Eylül 2017
Mezogözenekli geçiş metal oksitlerinin üretilmesi birçok enerji ile ilgili teknolojilerin gelişmesinde önemlidir. Eriyik tuz yardımlı kendiliğinden oluşma (EYKO) metodu, birkaç basit aşamadan oluşur, bunlar başlangıç malzemelerinin (uygun tuz, yüzeyaktifler, setiltirimethilamonyum bromür, (CTAB) ve 10-löril eter, C12H25(OCH2CH2)10OH, ve su veya etanol) şeffaf çözeltisinin hazırlaması, bu
çözeltinin herhangi bir alttaşa kapladıktan sonra yakılmasını içerir.
Mezogözenekli geçiş metal oksit ince filmleri ve CdSe TiO2 foto-anotları, EYKO
metodu ile üretildi ve birçok analitik teknik ile karakterize edildi. Tezin ilk bölümünde, CdSe/TiO2 ince filmi, mezogözenekli CdTiO3 ile H2Se gazının
reaksiyona girmesi sonucu üretildi. Sentez basamakları her aşamada optimize edildi. Film kalınlığı, yakma sıcaklığı ve H2Se tepkime ortamı optimum koşulları bulmak
için değiştirildi ve kuantum nokta duyarlı güneş pilleri üzerindeki etkisi incelendi. Fakat, mezogözenekli CdTiO3 ile H2Se gazının tepkimesinin verimsiz olduğu
belirlendi veayrıca, metalik selenyum yan ürünü oluştuğu belirlendi. Verimlilik probleminden dolayı, mezogözenekli CdO-SiO2 (meso-CdO-SiO2 olarak
vii
nanoparçacıkları oluşturmak için, sentezlendi. Fakat bu filmler silikanın yalıtkan olmasından dolayı güneş pilleri için uygun değildir.
Tezin ikinci kısmı, başlangıç MASA çözeltisinin, (uygun tuz, yüzeyaktifler (CTAB ve 10-löril eter) etanol ve silika kaynağı Si(OCH3)4 veya titania kaynağı Ti(OC4H9)4)
önceden hazırlanmış mezogözenekli TiO2 (meso-P25 olarak adlandırıldı) filmine
eklenmesini içerir. Sonraki aşamalarda, filmler yakılır ve H2Se tepkimesi sonucu
foto-anotlar elde edildi. Sentez parametreleri optimize edildi ve elde edilen bu malzemeler XRD, FTIR, Raman, 29Si-MAS-NMR, EXAFS, XANES, SEM, TEM, N2-sorplama teknikleri kullanılarak karakterize edildi. Başlangıçta yoğun çözelti
kullanması, meso-P25 filminin içerisini homojen kaplarken, üzerinde de yalıtkan CdO-SiO2 filmini oluştuğu gözlendi. Dolayısıyla, meso-P25 filminin boşlukları
içerisine yeterli CdSe-SiO2 film tabakası oluşturmak için seyreltik çözelti kullanıldı
ve birkaç yükleme ile hedefe ulaşıldı. H2Se reaksiyon ortamı ve tepkime sıcaklığı
optimize edildi. Ayrıca, CdO-SiO2 filim tabakasındaki silika miktarı sistematik
azaltılarak incelendi.
Üçüncü kısımda ise EYKO metodu mezogözenekli geçiş metal oksit ince filmlerini sentezlemek için uyarlandı. İlk olarak, mezogözenekli demir oksit ince filmleri EYKO metot ile sentezlendi ve yukarıdaki teknikler kulllanarak karakterize edildi. [Fe(H2O)6](NO3)3 ve CTAB ve 10-löril eter sisteminin termal ve yapısal özellikleri
daha düzenli mezogözenekli Fe2O3 filmi elde edebilmek için incelendi. Yakma
sıcaklığının, kristalleşme ve gözenekli yapı üzerindeki etkisi TEM, SEM, XRD and N2 sorplama teknikleri ile detaylı şekilde incelendi. Sonra, diğer mezogözenekli
geçiş metal oksitleri (ZnO, CuO, NiO, Co3O4 and Mn2O3) EYKO metot kullanılarak
sentezlendi. Başlangıçta bilinen geçiş metali nitrat tuzları ([Zn(H2O)6](NO3)2,
[Cu(H2O)6](NO3)2, [Ni(H2O)6](NO3)2, [Co(H2O)6](NO3)2, [Mn(H2O)6](NO3)2) ve
yüzey aktif arafazları kullanıldı. Sıvı kristal arafaz oluştuktan sonra farklı sıcaklıkta yakılarak ince filmler elde edildi. Sentezlenen mezogözenekli gecis metal oksit ince filmlerini, yukarıdaki analitik teknikler kulllanarak karakterize edildi.
Anahtar Sözcükler: mezogözenekli malzemeler, sıvı arafazlar, eriyik tuz yardımlı
viii
Acknowledgement
Firstly, I want to thank Prof. Dr. Ömer Dağ for his excellent supervision and support during my senior and master studies. Without his inspiration, guidance, and patience, I would not be here and will never forget his support throughout my life.
I thank TUBITAK (The Scientific and Technological Research Council of Turkey) (2210-E) for funding me during my master education.
I want to express my special thanks to Ahmet Selim Han, Prof. Dr. Jayasundera Bandara, Timur Ashirov, Mustafa Karatok and Tuluhan Olcayto Colak for their great contribution and partnership during my research.
I would like to thank all members of Dag Group, (especially Dr. Fadime Mert Balcı, Dr. Elif Berna Olutaş, Ezgi Yılmaz, Melih Bacı, Ulugbek Barotov, Gülbahar Saat, Nüveyre Canbolat, Doruk Ergöçmen, Zeynep Tuna, Işıl Uzunok, Irmak Karakaya, Assel Amirzhanova, Nesibe Akmanşen) and all members of Department of Chemistry (especially, Ethem Anber, Abdurrahman Türksoy, Zafer Say, Elif Perşembe, Menekşe Liman, Merve Balcı, Pınar Alsaç, Tutku Bedük, Selahaddin Gümüş, Ali Koç…) and all my friends (especially, Murat Demirbüken, Yasin Kaya, Alper İnecik, Emre Kurt, Burak Tunç, Şamil Beydilli, Oğuzhan Demir, Oğuz Tuncay, Said Beşler, Süleyman Doğanay, Burak Demircan, Mustafa Büyüközkan, Burak Bilgin, Tuğrul Nalbantoğlu, Bilal Uyar, Ali Keskin, Fatih Haltaş) for their memorable guidance, patience, encouragement, support and sincere friendship during my education life.
And finally, I am sincerely thankful my my family, my mom, Şehrinaz Yaman, my dad, Osman Yaman, and my siblings Sümeyra Kübra, Esma Betül, and Enes Baki for their patience, encouragement and support throughout my life.
ix
Table of Contents
1. Introduction ... 1
1.1 Sol-Gel Process ... 1
1.2 Mesoporous Materials ... 4
1.3 Lyotropic Liquid Crystals Templating Method ... 5
1.4 Evaporation Induced Self- Assembly (EISA) Method ... 8
1.5 Nano-casting or Hard-Templating Methods ... 10
1.6 Molten Salt Assisted Self-Assembly (MASA) Method ... 11
1.7 Designing Porous Materials for Quantum Dot Sensitized Solar Cells .... 12
1.8 Solar Cell Parameters ... 16
1.9 Titania Based Solar Cells ... 17
1.10 Synthesis of Photo-anode Electrode for a Quantum Dot Solar Cell (QDSC) 19 2. Materials ... 22
2.1 Materials ... 22
2.2 Synthesis of Materials ... 23
x
2.2.2 Synthesis of Mesoporous-Cadmium Oxide-Silica (meso-CdO-SiO2)
Thin Films ... 24
2.2.3 Preparation of Mesoporous Titania Films (meso-P25) ... 24
2.2.4 Synthesis of Mesoporous Cadmium Oxide-Silica-Titania (meso-CdO-SiO2-P25)Films ... 25
2.2.5 Synthesis of Mesoporous CdSe-TiO2, Mesoporous CdSe-SiO2, and Mesoporous CdSe-SiO2-P25 Films ... 25
2.2.6 Preparation of the Electrodes and Installation of the QDSSC ... 26
2.2.7 Synthesis of Mesoporous Transition Metal Oxides Thin Films ... 27
2.3 Equipment ... 27
2.3.1 X-Ray Diffraction (XRD) ... 27
2.3.2 Infrared Spectroscopy ... 27
2.3.3 Ultraviolet (UV)-Visible Absorption Spectroscopy ... 28
2.3.4 X-Ray Absorption Spectroscopy ... 28
2.3.5 29Si Nuclear Magnetic Resonance (NMR) Spectroscopy ... 28
2.3.6 Raman Spectroscopy ... 29
2.3.7 Scanning Electron Microscope (SEM) and Energy Dispersive X-Ray Spectroscopy (EDS) ... 29
2.3.8 Transmission Electron Microscope (TEM) ... 29
2.3.9 Polarized Optic Microscope (POM) ... 30
2.3.10 Solar Simulator ... 30
xi
3.1 Synthesis of Mesoporous Thin Films ... 31
3.1.1 Synthesis of Mesoporous CdTiO3 and Its Solar Cell Performance ... 31
3.1.2 Synthesis of Mesoporous CdO-SiO2 and CdSe-SiO2 Thin Films ... 43
3.2 Infiltration and Mesophase Formation of MASA Solution in TiO2 Films 45 3.2.1 Infiltration of MASA Solution to meso-P25 Films... 46
3.2.2 Multiple Loading of meso-P25 Films ... 55
3.2.3 Reactivity to H2Se and the Formation of Metallic Selenium ... 58
3.2.4 Effect of Insulating Silica Amount in the meso-CdO-SiO2 ... 65
3.3 Synthesis of Mesoporous Transition Metal Oxide Thin Films ... 68
3.3.1 Synthesis of Mesoporous Iron Oxide Thin Films ... 68
3.3.2 Synthesis of Other Mesoporous Transition Metal Oxides Thin Films 71 4. Conclusion ... 75
xii
List of Figures
Figure 1.1. Hydrolysis and condensation of inorganic precursors. ... 2
Figure 1.2. 29Si NMR spectral changes over time during the condensation of methyltriethoxysilane (MTEOS), vinyltriethoxysilane (VTEOS) and tetraethoxysilane (TEOS). ... 3
Figure 1.3. Illustration of orientational order in solids, liquid crystals and liquids. . 5
Figure 1.4. The phase diagram of CTAB in water. (CMC1: critical micelle concentration for spherical micelles, CMC2: critical micelle concentration for rod-like micelles). ... 6
Figure 1.5. Schematic presentation of evaporation induced self-assembly process. 9
Figure 1.6. Schematic presentation of the MASA process and further H2Se
treatments. ... 12
Figure 1.7. The spectrum of solar radiation. ... 13
Figure 1.8. The band gaps of some metal oxides (left) and metal sulfides (right). 14
Figure 1.9. Schematic diagrams of the cells, (a) producing electricity from solar light and (b) producing chemical energy through the photo-cleavage of water ... 15
Figure 1.10. Simple solar cell circuit model. ... 16
Figure 1.11. A characteristic I – V curve of a solar cell ... 17
Figure 1.12. Schematic presentation of electron pathway in quantum dot sensitized solar cells ... 19
xiii
Figure 1.13. Schematic presentation of different synthesis method of photoanode of QDDSCs. ... 20
Figure 2.1. Photograph of a fume hood, placed a homemade reaction chamber. ... 26
Figure 3.1. Ӏ-V Curves of the samples with different spin coating rate (500, 1000, 1500, 2000 RPM). ... 33
Figure 3.2. SEM images of the meso-CdSe-TiO2 film coated at 1000 RPM. ... 33
Figure 3.3. FT-IR spectral changes of the meso-CdTiO3 film over silicon, prepared
from the MASA solution, during calcination (RT to 400 °C). ... 35
Figure 3.4. Normalized Raman spectra of meso-CdSe-TiO2, synthesized from the
meso-CdTiO3 calcined different temperature. ... 36
Figure 3.5. I-V curves of meso-CdSe-TiO2, synthesized from meso-CdTiO3 films
calcined at different temperatures. ... 37
Figure 3.6. Raman spectra of meso-CdTiO3 films, prepared by changing the
concentration of (a) Cd(II) and (b) titania mole ratio. ... 38
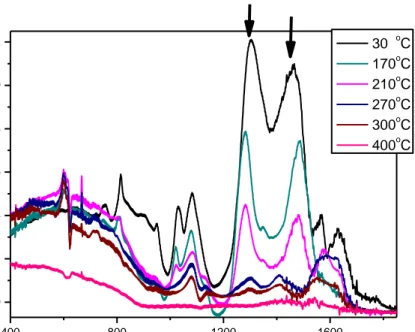
Figure 3.7. (a) Raman and (b) UV-Vis spectra of mesoporous titania films after H2Se
reaction (titanium mole ratio 8 without cadmium). ... 39
Figure 3.8. (a) Raman and (b) UV-Vis spectra of titania species without cadmium after H2Se under different conditions (in N2 760 torr, in vacuum and in air). The
arrow shows the direction of change. ... 40
Figure 3.9. Photograph of the products after H2Se reaction under different amount
of oxygen (in vacuum, in N2, in air) at 100 °C (left side) and RT (right side). ... 40
Figure 3.10. Photographs of the samples before (left side) and after (right side) 2 M Na2S treatment. Both samples were prepared without adding cadmium nitrate heated
up 100°C (up) and extra heat up to 450°C after the H2Se reaction (down). ... 41
Figure 3.11. XRD patterns of meso-CdTiO3 and meso-CdO-SiO2 reacted with H2Se
xiv
Figure 3.12. FT-IR spectra of MASA solution coated over Si wafer, including silica with heating. ... 43
Figure 3.13. FT-IR Spectra of the meso-CdO-SiO2 films prepared with silica before
and after H2Se reaction. ... 44
Figure 3.14. 29Si MAS-NMR spectra of the meso-CdO-SiO2 films before and after
H2Se reaction. ... 45
Figure 3.15. XRD patterns of meso-P25 films, loaded with solutions prepared with different amounts of ethanol (a) before reaction and (b) after H2Se reaction. ... 47
Figure 3.16. FT-IR Spectra of meso-P25 films, loaded with solutions prepared with different amount of ethanol (a) before reaction and (b) after H2Se reaction. ... 47
Figure 3.17. Linear N2 (77K) (a) isotherms and (b) BJH desorption pore size
distributions of meso-P25 films, loaded with solutions prepared with different amount of ethanol before the reaction. ... 48
Figure 3.18. Photograph of backside of photo anodes, loaded using different amount of ethanol after H2Se reaction on FTO glass substrate. ... 48
Figure 3.19. SEM images of films, loaded using solutions prepared with different amounts of ethanol. The yellow circles show the film morphology. ... 49
Figure 3.20. Cross section SEM images and EDS spectra of the samples prepared with 5 ml (top) and 1 ml (bottom) EtOH. The yellow line shows the places, which EDS were collected. ... 50
Figure 3.21. Small angle XRD patterns of MASA solutions, prepared using different amounts of ethanol, upon spin coating on (a) glass substrate, and (b) meso-P25 film. ... 51
Figure 3.22. Temperature dependent changes in the small angle XRD patterns of the MASA solutions (a) coated over glass substrate using 1 ml ethanol solution, and coated over meso-P25 using (b) 1 ml ethanol solution, and (c) 5 ml ethanol solution
xv
and (d) XRD patterns of meso-P25 at 150 oC, coated using 1, 3, and 5 ml ethanol solutions. ... 52
Figure 3.23. I-V Curves of the photoanodes, prepared using different MASA solutions (same composition, different amount of ethanol)... 53
Figure 3.24. 29Si MAS-NMR spectra of (black line) meso-CdO-SiO2-P25 and (red
line) meso-CdSe-SiO2-P25 film, infiltrated using 5ml ethanol MASA solution. ... 54
Figure 3.25. TEM images of (left) meso-CdO-SiO2-P25 and (right)
meso-CdSe-SiO2-P25 film, prepared using 5 ml of ethanol MASA solution. Yellow lines show
titania nanoparticles and orange circles show CdSe nanoparticles. ... 54
Figure 3.26. I-V Curves of the 4 photoanodes, prepared using same MASA solutions (same composition, 5 ml of ethanol)... 55
Figure 3.27. XRD pattern of meso-P25 films, multiple times coated with CdO-SiO2,
(a) before and (b) after H2Se reaction. ... 56
Figure 3.28. FT-IR Spectra of meso-P25 films, multiple times coated with CdO-SiO2, (a) before and (b) after H2Se reaction. ... 56
Figure 3.29. Linear N2 (77K) (a) isotherms and (b) BJH desorption pore size
distributions of meso-P25 films and upon loading multiple times of a solution of 1 ml EtOH. ... 57
Figure 3.30. N2 sorption (a) isotherms and (b) BJH desorption pore size distribution
of meso-P25 and upon loading multiple times of a solution of 2.5 ml EtOH. ... 57
Figure 3.31. SEM images of meso-CdO-SiO2-P25, upon multiple times loading with
a solution prepared using 5 ml EtOH and calcination. The yellow circles show the film morphology. ... 58
Figure 3.32. Raman spectra of cadmium titanate (black line) and cadmium oxide-silica (red line) in meso-P25 after H2Se reaction. ... 59
xvi
Figure 3.33. Cd K-edge XANES spectra of (up) references (CdO (blue), CdSe (red), CdTiO3 (green)) and (bottom) the mesoporous materials reacted with H2Se under
different reaction temperature. ... 60
Figure 3.34. Cd K-edge XANES spectra of silica system under different reaction conditions (300 Torr N2, 760 Torr N2 , 760 Torr air, and 1 torr atmosphere, as shown
in the insets, respectively.) ... 61
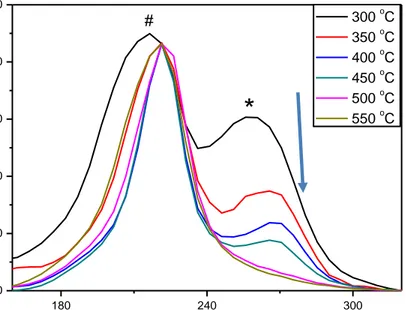
Figure 3.35. Cd K-edge XANES spectra of titania system under different reaction temperature (up) and different reaction conditions(down) (as shown in the insets). ... 62
Figure 3.36. Se K-edge XANES spectra of reference samples (Se, CdSe, and SeO2,
red, blue, and green line, respectively). ... 63
Figure 3.37. Se K-edge XANES spectra of silica systems under different reaction temperature (left) and different reaction conditions (right), as shown in the insets. ... 63
Figure 3.38. Se K-edge XANES spectra of titania system under different reaction temperature (top) and different reaction conditions (bottom), as shown in the insets. ... 63
Figure 3.39. Se K-edge EAXFS spectra of silica (top) and titania (bottom) systems under different reaction conditions. ... 64
Figure 3.40. Fourier transform of baseline-corrected, normalized and k3-weighted EXAFS data of (left) reference samples (SeO2, Se and CdSe) and the titania samples
(right). ... 65
Figure 3.41. FTIR spectra of the samples, prepared using different initial amount of silica. ... 66
Figure 3.42. The XRD patterns of the samples, prepared using different initial amount of silica. ... 66
xvii
Figure 3.43. SEM images of the samples, prepared using different initial amount of silica, as shown in the images. ... 67
Figure 3.44. XRD pattern of a spin coated film, prepared using a MASA solution containing Fe(III), aged at different temperature and duration (as indicated in graphs, insets are wide angles after 2 days). POM image of the spin coated film, aged 3 weeks... 68
Figure 3.45. XRD patterns of a mesoporous Fe2O3, calcined at high temperature, as
indicated in the inset. ... 69
Figure 3.46. TEM images of iron oxides calcined at (a) 300 and (b) 400 °C. ... 69
Figure 3.47. (a) Linear N2 (77K) isotherms and (b) BJH pore size distribution plots
of mesoporous iron oxide, calcined at different temperatures (as indicated in the insets). ... 70
Figure 3.48. SEM images of iron oxide thin films, calcined at different temperatures, as shown in the images. ... 70
Figure 3.49. Photograph of starting MASA solutions (top) and calcination products of Mn(II), Co(II), Ni(II), Cu(II), Zn(II), from left to right, respectively. ... 71
Figure 3.50. XRD patterns of calcination products at 400 °C of (a) Zn(II), (b) Cu(II), (c) Ni (II), and (d) Co(II) with their references. ... 72
Figure 3.51. Raman spectra of calcination products at 400 °C of (a) CuO, (b) Ni O, and (c) Co3O4. ... 73
Figure 3.52. High resolution SEM images of mesoporous ZnO, CuO, NiO, and Co3O4 thin films, prepared using MASA method. The insets show normal scales.
... 73
xviii
List of Tables
Table 2.1. The amount of the ingredients of a cadmium titanate film ... 23
Table 2.2. The amount of the ingredients for the production of meso-CdO-SiO2-P25
film ... 25
Table 3.1. Summary of solar cells parameters for the samples with different spin coating rate (500 RPM, 1000 RPM, 1500 RPM and 2000 RPM). ... 32
Table 3.2. Summary of solar cells parameters of meso-CdSe-TiO2, synthesized from
xix
List of Abbreviations
IUPAC: International Union of Pure and Applied Chemistry
FTIR: Fourier Transform Infrared Spectroscopy
EXAFS: Near Edge X-Ray Absorption Fine Structure
XANES: X-Ray Absorption Near Edge Structure
SEM: Scanning Electron Microscopy
TEM: Transmission Electron Microscopy
BET: Brunauer-Emmett-Teller
JCPDS: Joint Committee on Powder Diffraction Standards
NMR: Nuclear Magnetic Resonance
LLCT: Lyotropic Liquid Crystalline Templating
EISA: Evaporation Induced Self-Assembly
MASA: Molten Salt Assisted Self-Assembly
QDSSC: Quantum Dot Sensitized Solar Cell
PEC: Photoelectrochemical Cell
1
Chapter 1
1.
Introduction
1.1 Sol-Gel Process
Many materials have been synthesized starting from solution phase (sol), where the gelation (gel) takes place by the formation of polymeric network of precursor species over time. Using sol-gel method, aerogels, xerogels, films, fibers and size controlled nanoparticles have been fabricated in the last three decades [1]. In the gelation, the hydrolysis and condensation (alcoxolation, oxolation) take place by nucleophilic substitution (SN) reactions, schematically shown in Figure 1.1. Inorganic precursors
can be metal alkoxides (M(OR)x) and metal salts (MA) of chloride, acetate, and
nitrate. The reactivity of precursors depends on electronegativity of OR groups and oxidation state of the metal center [2]. The hydrolysis and condensation can be controlled by choosing optimum alkoxides or metal salts, pH, [1] where different morphologies can be synthesized. Titania [3] and silica [4] are synthesized from their alkoxides by sol-gel process, because of their instability towards hydrolysis and condensation. Titanium alkoxides (Ti(OR)4 [3], R can be ethyl, propyl,
isopropyl, or butyl) or titanium chloride (TiCl4 [5]) are usually used as titanium
precursors and silicon alkoxides (Si(OCnH2n+1)4 [1]) are usually used as a silica
2
Figure 1.1. Hydrolysis and condensation of inorganic precursors.
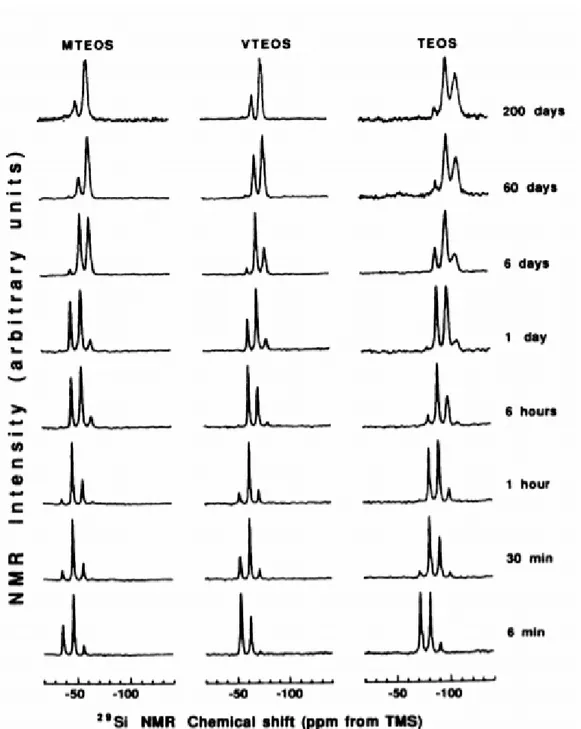
The condensation precursors of inorganic precursors have been investigated by spectroscopic techniques [6] (such as FTIR, Raman, NMR [7]). There are many spectroscopic changes during gelation and solidification stages. Also, other techniques (XRD and electron microscopy) are helpful to understand the formation mechanism of the products. For instance, Figure 1.2 shows a set of 29Si NMR [8] spectra at different times during the condensation of methyltriethoxysilane (MTEOS), vinyltriethoxysilane (VTEOS) and tetraethoxysilane (TEOS). In each spectrum, while different chemical shifts are observed, relative ratios of Q2, Q3 and
Q4peaks (Q0, Q1, Q2, Q3, Q4 are used to represent of silicon atoms surrounded by 0,
1, 2, 3 or 4 siloxane bridges) show changes over time [8]. The changes are useful to evaluate the formation mechanism of each samples. The final product of TEOS has peaks at around -91 ppm that originates from Q2 species, around -100 ppm from Q3
and around -109 ppm from Q4, where the Q3 andQ4 peaks have the higher intensity,
3
Figure 1.2.1 29Si NMR spectral changes over time during the condensation of
methyltriethoxysilane (MTEOS), vinyltriethoxysilane (VTEOS) and tetraethoxysilane (TEOS).
1 Reprinted from Physical Review A, Vol. 41, Devreux, F; Boilot, J P; Chaput, F; Lecomte, “Sol-gel
Condensation of Rapidly Hydrolyzed Silicon Alkoxides: A joint 29Si NMR and Small-angle X-ray
4
1.2 Mesoporous Materials
Recently, surface of materials and interface between two different materials have become important, because in all chemical process, mass and electron transport take place at the surface and/or in the interfaces materials and determine the effectiveness of the material. At the interface, two-materials transfer electron or mass to each other, therefore the amount of interface is critical. One way to increase the interface of the materials is by increasing the surface area and porosity of materials. High surface area is needed for an effective electron transfer and porous structure is necessary for an efficient mass transport. Therefore, porous materials are important for material efficiency for various chemical and electrochemical processes.
Porous materials have been classified by IUPAC depending on the pore size: microporous materials have pore size lower than 2 nm, mesoporous materials fall between 2 and 50 nm, and macroporous materials have pores larger than 50 nm [9]. The materials with smaller pores have higher surface area. Depending on application of the materials, a different pore size may be needed. For instance, for a gas separation, microporous materials are essential [10] and for photovoltaics, mesoporous materials are essential [11]. Therefore, synthesis of porous materials is still an important and emerging field.
Kresge et al. has introduced the first examples of mesoporous materials [12] in 1992. Mesoporous silica (MCM-41, MCM-48 and MCM-50 are labels for 2D hexagonal, cubic, and lamella, respectively) had been synthesized by controlling polymerization of tetramethylorthosilicate (TMOS) in an aqueous surfactant (hexadecyltrimethylammonium bromide ion (CTAB)) media. The sol-gel process takes place in a confined space among the micella species in above conditions. After this pioneering study, a lyotropic liquid crystalline templating (LLCT) method for the synthesis of mesoporous silica has been introduced in 1995 by Attard et al. [13].
5
1.3 Lyotropic Liquid Crystals Templating Method
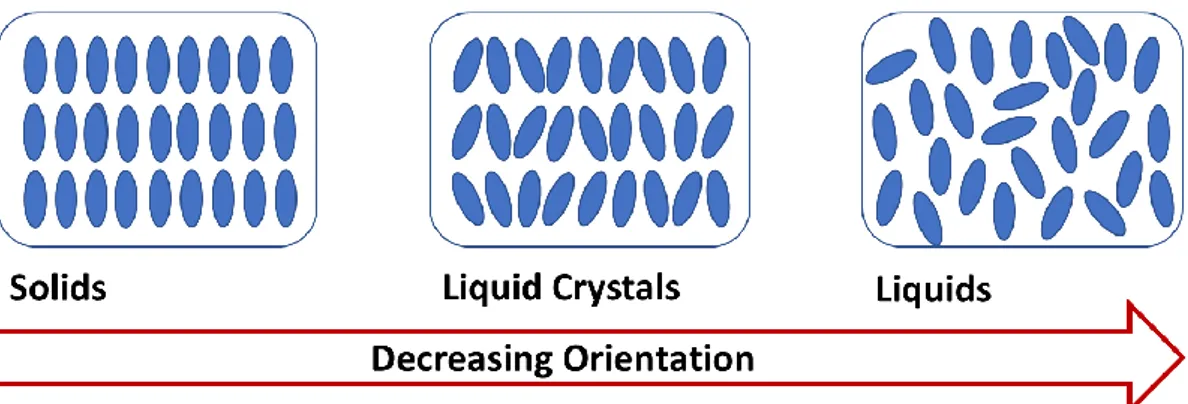
Before going into the LLCT method, it would be useful to describe the liquid crystalline mesophase in terms of structure and composition. Some of the primary phases of matter are solid, liquid, gas, and liquid crystal (LC). The LC phase is considered to be the 4th phase of mater. The LC phase is observed between solid and liquid phases in terms of rigidity, viscosity, and orientation of matter, see Figure
1.3. Solids have ordered structures but there is no order in liquid phase. The
molecules or micelles (self-assembled collection of surfactant molecules, typically 50-150 molecules) in the LC have some degree of order, due to long organic chains. Usually, the LC phase is observed in long chains organic molecules with certain geometry and surfactants that have both hydrophobic and hydrophilic groups, attached to each other.
Figure 1.3. Illustration of orientational order in solids, liquid crystals and liquids.
Liquid crystals are divided into two categories; thermotropic liquid crystal (TLC) and lyotropic liquid crystal (LLC). The order in the TLCs are only temperature dependent. However, the order in the LLC phases depend on both composition and temperature. Structure of the LLC phase changes with the composition, such as surfactant/solvent ratio as well as temperature of the media. The surfactant molecules contain a polar head group and apolar chain. Interaction like van der Walls, hydrogen bonding, and dipole-dipole with the solvent determines the assembly of surfactant molecules. Surfactants form micelles by self-assembly if the surfactant concentration is above a critical concentration, known as critical micelle concentration (CMC) in an aqueous media. Further increase of the surfactant concentration may lead to form LLC mesophases. Figure 1.4 shows a phase diagram
6
of CTAB, one of the charged surfactant, in water, where CMC1 is critical micelle concentration for spherical micelles, CMC2 is critical micelle concentration for rod-like micelles. By increasing the surfactant concentration in water, the LLC phase appears as lamellar, hexagonal, or cubic mesostructure. The LLC phase is very dynamic and the assembly of micelles (lamellar, hexagonal, or cubic phases) can be controlled easily to determine optimum conditions of surfactant/solvent systems for a desired mesostructure. Surfactants can be triblock co-polymers of poly(ethylene oxide)-poly(propylene oxide)-poly(ethylene oxide) like pluronics or oligo(ethylene oxide) type molecules, like 10 lauryl ether (C12H25(OCH2CH2)10OH, denoted as
C12EO10).
Figure 1.4. The phase diagram of CTAB in water. (CMC1: critical micelle
concentration for spherical micelles, CMC2: critical micelle concentration for rod-like micelles) 2.
2 Reprinted from Chemistry of Materials, Vol 8, Raman, N. K.; Anderson, M.T. and Brinker C. J.
“Template-Based Approaches to the Preparation of Amorphous, Nanoporous Silicas.” 1682-1701, (1996), with permission from American Chemistry Society.
7
The second component of the LLC phase can be water, ionic liquids, electrolytes, and salts. They have different effects on the LLC phase and could be useful for the synthesis of porous materials through LLCT approach.
Attard et al introduced the synthesis of mesoporous silica using LLCT approach [13]. The silica precursor (tetraehoxysilane, TEOS) and water with a high surfactant concentration have been used for synthesis of mesoporous silica. In this study, by controlling the hydrolysis and condensation of the silica precursor in a C12EO8,
TEOS and water LLC media, monoliths and thin films of highly uniform mesoporous silica with a 3 nm pore size were synthesized in 1995 [13].
Later, LLC has been applied to synthesize many different mesoporous materials. For instance, mesoporous metal films (Pt [14], Sn [15]) and Pt/Ru [16] alloys) were synthesized by electrodeposition and also mesoporous Ni/Co alloy [17] and Ni particles [18] were fabricated by electroless deposition. Some metal oxides (TiO2,
ZrO2, Al2O3, Nb2O5, Ta2O5, WO3, HfO2, SnO2) and mixed oxides (SiAlO3, SiTiO3,
ZrTiO3, Al2TiO3, ZrW2O8) have also been synthesized [5] using LLCT method.
Also, some semiconducting solids (CdS, ZnS and CdSe) has been synthesized in the LLC mesophase by reacting their metal salts by hydrogen sulfides and selenide gases [19], [20].
In all these synthesis approaches, the hydrolysis and condensation of inorganic precursor are controlled in either micella solution or LLC phase of surfactants. In a latter step either calcination or extraction methods have been employed to obtain the mesoporous materials. The surfactants were used as a sacrificial agent to form porous network of materials. In all these approaches, surfactant weight (>30 % w/w) was kept high to control the porosity in the final product. Low inorganic precursor amounts could be problematic in the formation of porous materials with solid amorphous or crystalline pore walls, because the volume shrinkage of metal precursors (such as salts) is huge when they are converted to their oxides or sulfides or selenides to form solid films.
In another lyotropic liquid crystalline system, nonionic surfactant and transition metal salts (such as [Co(H2O)6](NO3)2, [Ni(H2O)6](NO3)2, [Zn(H2O)6](NO3)2, and
8
LLC phase [21]. Inorganic metal precursor was kept high with a transition metal precursor weight of up to 60% (w/w) in these salt-surfactant LLC mesophases. Effects of different non-ionic surfactants [22] and effects of counter ions of transition metal salts [23] on the liquid crystalline mesophase of transition-metal salt-surfactant have been investigated. The salt- surfactant system might be useful for eliminating the effects of volume shrinkage and therefore might be used to form solid films of metal oxides and chalcogenides. So far, mesostructured metal sulfide films (CdS and Cd1-xZnxS) were synthesized using cadmium salt-surfactant LLC
mesophase [24]. Before we go into details of salt-surfactants systems as a template, it is better to follow the chronological progress in mesoporous material synthesis in the literature to make it easy to understand the importance of salt-surfactant systems for the synthesis of porous thin films and monoliths.
1.4 Evaporation Induced Self- Assembly (EISA) Method
Evaporation induced self-assembly (EISA) method has been developed from lyotropic liquid crystalline templating to fabricate materials, easily and fast [25]. The mixture of inorganic precursor, surfactant and solvent are used as a clear solution. The di-block or tri-block copolymer have been used as surfactants with an easily evaporating solvent in this process [26]. Figure 1.5 shows schematic representation of the EISA process, where the micelles are formed above CMC during the solvent evaporation; the surfactants and inorganic precursors are assembled together by the help of weak interactions, like hydrogen bonding, dipole-dipole interaction and van der walls interaction. The highly ordered mesostructured thin films are formed by condensation of the inorganic precursors and thermal treatments. Adjusting the inorganic precursors, surfactant, humidity, and pH, various morphologies of silica [27], [28] have already been synthesized.
It is possible to prepare crystalline, crack-free, ultrathin mesoporous metal oxide films using EISA process [29]. Mesoporous crystalline WO3, CeO2 [29], TiO2,
Al2O3 [30], SrTiO3, CoTiO3 [31] FeOx [32] thin films have been produced by using
the EISA process. The film thickness is controlled by the evaporation rate of the volatile solvent and the concentration of the ingredients [33]. Dip coating is a preferable method to coat the substrate in this process. The final step of EISA
9
process is to remove surfactants by either burning the coated substrate at high temperature or washing it with a proper solvent.
Figure 1.5. Schematic presentation of evaporation induced self-assembly process3.
The initial concentration of inorganic precursors in a EISA process is low. There is huge volume (or density) difference between especially metal nitrate salts and metal oxides. The high temperature treatment might destroy mesostructured films during the calcination step. The condensation of the precursors also takes long time, up to 1-2 weeks. For this reason, it is very hard to synthesize ordered mesoporous transition metal oxides by using the EISA (also known as a soft templating) method.
3 Reprinted from Advanced Materials, Brinker, J. C.; Lu, Y.; Sellinger, A.; Fan, H.
“Evaporation-Induced-Self-Assembly: Nanostructures Made Easy.” 579- 585, (1999), with permission from John Wiley and Sons.
10
1.5 Nano-casting or Hard-Templating Methods
Nano-casting is a hard-templating method to produce mesoporous materials using an ordered mesoporous material to replicate its porosity [5]. Highly ordered mesoporous materials are important for gas separation [10], catalysis [11] and many other applications. The synthesis of ordered mesoporous materials involve three steps in nano-casting. Firstly, a suitable (in terms of pore size) hard template are infiltrated with metal precursors. The fully filled mesoporous templates are calcined at an optimum temperature to form metal oxides in the templates. Later, etching removes the templates using a proper solvent. Mesoporous silica and mesoporous carbon are commonly used as hard templates. CeO2, Co3O4, Fe2O3, MnO2, NiO and
In2O3 has been produced using hexagonally channeled mesoporous silica (SBA-15)
[34] or bicontinous cubic mesostructured silica (KIT-6) [35]. Ordered mesoporous CuO are fabricated using both silica and carbon templating [36].
Hard-templating is a more complicated method than soft templating method, but it could be more applicable than soft templating for certain cases, such as synthesis of ordered metal oxides. However, each step of the nano-casting process has problems. The infiltration of metal precursor into pores of hard templates is not easy because the pores are not large enough for penetration of metal precursors throughout the pores of templates. The decomposition of metal salts can be close to their melting point that may create problems both in the infiltration and calcination processes. Lastly, etching hard-template using some chemical (HF or NaOH for silica) may damage metal oxide on the pore-walls of the template and it may cause a collapse the pores in the final product.
However, the EISA and nano casting methods are the commonly used two methods to fabricate mesoporous materials in forms of powders and thin films. These method is not applicable for all materials and there is still a demand for another more universal method for certain technologically important materials. The new method(s) should be easy, cheap, and applicable for scaling up [37]. Molten salt assisted self-assembly (MASA) could be an applicable method for the synthesis of some of these materials in powder and thin film forms.
11
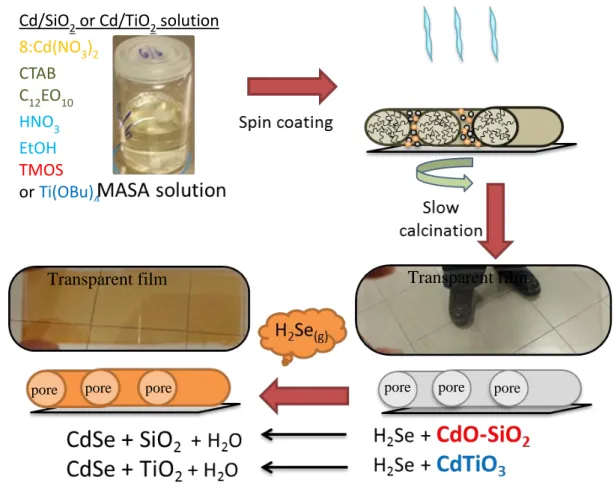
1.6 Molten Salt Assisted Self-Assembly (MASA) Method
The LLC mesophase of transition metal salts with oligo(ethylene oxide) [21] has been introduced to the literature by Dag`s group in 2001. The transition metal salts/surfactant mole ratio has been increased up to 8 by adding ionic surfactants to the media [38]. Also, the roles of inorganic and organic additives on the assembly of surfactants and the morphology of silica [39], [40] have been studied. These studies form the bases of MASA process, where two surfactants and two solvents are needed. Using MASA process, mesoporous metal titanates (CdTiO3, Zn2TiO4
[41], CoTiO3, MnTiO3, Li4Ti5O12 [42]), metal sulfide-titania (CdS-TiO2, ZnS-TiO2
[41]), metal selenide-titania (CdSe-TiO2, ZnSe-TiO2 [41]) thin films and
mesoporous metal oxides-silica (CdO-SiO2, ZnO-SiO2 [43]) thin films have been
synthesized. Recently, mesoporous lithium metal oxides (LiMn2O4 and LiCoO2) thin
films have been successfully synthesized using MASA process [44]. MASA is a process that uses salts in their molten phase as a solvent and a metal ion source for metal oxides [41], [43]. In the titanates and silicates, titanium(IV) tetrabutoxide (TTB) and TEOS, as the polymerizing agents, and two surfactants, CTAB and C12EO10, as templating agents, were used in the MASA process. The MASA solution
is a clear solution of all the ingredients that solidify into mesostructured film upon spin coating over any substrate and ready for calcination to convert into mesoporous thin films. Further reaction under a mixture of H2Se and N2 gasses produces
mesoporous CdSe modified titania or silica (denoted as meso-CdSe-TiO2 in the
titania case and meso-CdSe-SiO2 in the silica case) depending on the polymerization
agent, TBB or TEOS, respectively. Figure 1.6 shows schematic presentation of the MASA process.
12
Figure 1.6. Schematic presentation of the MASA process and further H2Se
treatments.
1.7 Designing Porous Materials for Quantum Dot Sensitized Solar
Cells
Renewable energy is an emerging field to meet the energy need of the world. Wind, solar, biomass, geothermal and hydroelectric are sources of renewable energy. The annual amount of solar energy is much more than any other sources. The energy supplied by the Sun to the Earth is around 1024 joules per year and its approximately 10000 times more than the global population recently annual consumes. [45] If a small percentage of the solar energy is converted to electricity, it will be sufficient for the demand of humanity. There is a efficient material demand for the energy conversion process. However, fabrication of these materials need to be easy and cheap to compete with the current energy sources, such as fossil fuels.
Cd/SiO2 or Cd/TiO2 solution
8:Cd(NO3)2 CTAB C12EO10 HNO3 EtOH TMOS or Ti(OBu)4
pore pore pore pore
pore pore
13
The spectrum of solar radiation is shown in Figure 1.7 [46]. Most of the radiation is in the energy range between 1.1 and 3.0 eV. A suitable material to harvest the solar light should be in this region. The optimum materials should also have a suitable band gap for harvesting solar cells. The band gaps of some metal oxides and metal sulfides are shown in Figure 1.8, respectively [47]. The energy level of metal sulfides is higher than its oxides.
Figure 1.7. The spectrum of solar radiation4.
The solar energy has been harvested to electricity through solar cells and to chemical energy through photoelectrochemical (PEC) cells [45]. Figure 1.9 (a) shows a diagram of solar cell producing electricity from solar light. Solar light separates an electron-hole pair from each other at anode side and then the electron is transferred from anode to cathode side and recombined with the hole through a chemical reaction to produce electricity. Figure 1.9 (b) shows a diagram of PEC cell, producing chemical energy through the photo-cleavage of water. Again, solar energy produces an electron and a hole and they split water to hydrogen and oxygen as a source of chemical energy. The important parameter for both cells is band gap of the anode and cathode materials.
4 Reprinted from In Tech, Biernat, Krzysztof; Malinowski, Artur; Gnat,Malwina “The possibility of
Future Biofuels Production Using Waste Carbon Dioxide and Solar Energy, Biofuels-Economy” 2013 with permission from In Tech.
14
15
Figure 1.9. Schematic diagrams of the cells, (a) producing electricity from solar
light and (b) producing chemical energy through the photo-cleavage of water5.
5 Reprinted from Nature, Gratzel, M “Photoelectrochemical Cells” 328-344, (2001), with permission
16
1.8 Solar Cell Parameters
The current generated by a solar cell is expressed in equation 1 [48].
I = I
SC– I
o1(e
qV/kT– 1) – I
o2(e
qV/2kT– 1) eq.1
The dark saturation currents (Io1, Io2) are related to material properties, the solar cell
structure and other liming factors, coming from the operation conditions. Figure
1.10 shows simple solar cell circuit model, where diode 1 represents the
recombination current in the quasi-neutral regions (∝ eqV/kT), while diode 2
represents recombination in the depletion region (∝ eqV/2kT). The problems, coming
from electron transport resistance, charge transfer resistance, charge recombination rate, and series resistance are defined as decreasing parameters in equation 1, [48]. The short-circuit current (ISC) is ideal current source, produced by the photoanode
under 1 sun condition.
Figure 1.11 shows a characteristic I – V curve of a solar cell. The most important
parameter of a solar cell is power conversion efficiency (PCE), η, is determined by dividing a produced power (VMP*IMP) by the incident power [48]. The other
important parameters are ISC, short current at 0 V, and VOC, open circuit voltage.
The last parameter is filling factor (FF), obtained from the curve (FF = VMP*IMP /
VOC*ISC) [48]. FF is always less than 1 but is between 0.5 and 0.7 for a typical
ODSSC [49].
17
1.9 Titania Based Solar Cells
Titania is a good alternative to silicon based solar cells because of easy and cheap fabrication [45]. Titania is a catalytically active material and transfers electrons easily. Titania nanoparticles [50], [51], nanosheets [52], nanorods [53] , nanotubes [54], [55] with high surface area has been synthesized using different techniques (such as sol-gel, sonochemical, hydrothermal methods) for above purposes..
Titania is an n-type semiconductor with a band gap of 3.03 eV for rutile phase and 3.20 eV for anatase phase [56]. These are not suitable band gaps to directly harvest solar energy, therefore a sensitizer is needed to first absorb the solar light to activate the titania. Although there are some studies to make titania to be used as visible light absorber, still it is an emerging field [57]. Dye-sensitized solar cell (DSSC) and quantum dot-sensitized solar cell (QDSSC) are two common cells. In the DSSCs, dyes are used as an absorber for solar light due to suitable electronic energy levels and strong light absorption coefficients [58]. The assembly of titania, modified using a dye, as an anode, iodine/iodide based electrolyte and a platinum counter electrode
18
construct the cell. The power conversion efficiency (PCE) of a DSSCs nowadays reaches up to 13% [59]. In the QDSSCs, quantum dots (PbS [60], CdS [61], CdSe [62], CuInS2 [63] or mixed CdSe-ZnS [64]) are used as the absorber, because the
band gap of these particles are tunable with their particle size [65]. The assembly of titania loaded with quantum dot nanoparticles, sulfide/polysulfide based electrolyte [66] and cupper (I) sulfide counter electrode [67] construct the QDSSCs. The PCE of a QDSSC reaches up to 11% [68]. Although the efficiency of QDSSCs is lower than DSSCs, the advantage of QDSSCs overweigh the advantages of DSSCs in terms of long term stability and also to high temperature because dye molecules decompose at high temperature and have low long-term stability.
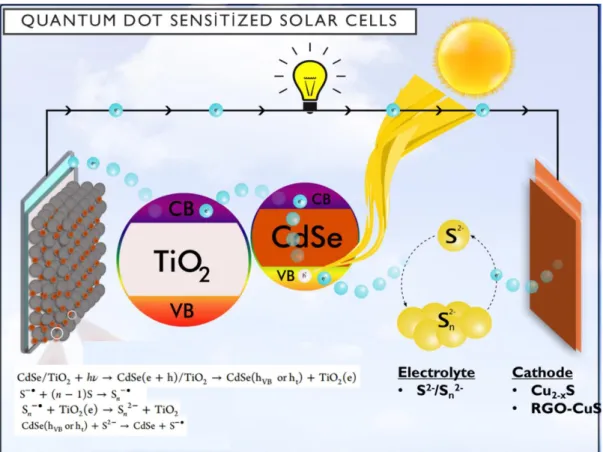
Titania, modified by quantum dots harvests the solar light. Firstly, solar light is absorbed by the QDs in which the electrons are excited from valence band (VB) of sensitizer to conduction band (CB) of sensitizers. Excited electrons are transferred to conduction band of titania which is lower in energy than that of CB of sensitizer. Then the collected electrons are transferred to cathode electrode through titania and florine doped tin oxide (FTO) glass and connecting Cu wire. An electrochemical process take place on the cathode surface between the electrode and electrolyte and then the reduced chemicals regenerate the oxidized quantum dot back on the anode, resulting in combining the electron and hole back to generate the photo-current, named harvesting solar light [69]. Figure 1.12 shows the pathway of electron in QDSSC. The reactions that take place in the pathway are also shown in Figure 1.12.
There are predicted and unpredicted problems in the QDSSCs and they all affect the efficiency of the cells. All components of the cells, anode, cathode, and electrolyte are needed to be optimized [69]. Sulfide/polysulfide is not an optimum electrolyte for the QDSSCs and cupper (I) sulfide may not be optimum as the cathode. The synthesis of photo-anode is still another essential part of obtaining high efficiency.
19
Figure 1.12. Schematic presentation of electron pathway in quantum dot sensitized
solar cells
1.10 Synthesis of Photo-anode Electrode for a Quantum Dot Solar
Cell (QDSC)
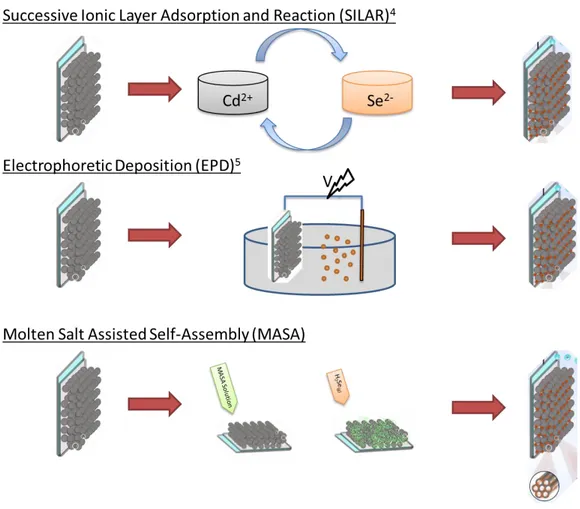
For a high efficiency, each component of the solar cells needs to be fully characterized to identify the issues causing low efficiency. For example, only the photo-anode of the QDSSCs has been investigated last two decades. One of the main problem of the anode is how to effectively anchor the sensitizers on the titania nanoparticles. One of a commonly used method is in-situ synthesis of quantum particles in the pores of titania. For this purpose, in successive ionic layer adsorption and reaction (SILAR) [70], [71] and chemical bath deposition [72] have been developed; the semiconductor nanoparticles are directly synthesized over the titania nanoparticles. The SILAR method consist of number of dipping titania electrode (fabricated by doctor-blade coating and annealing at 450 °C) into cadmium ions solution and then into selenium ion solution to form CdSe nanoparticles. After each dipping, the surface of titania coated with the corresponding ions that react with the
20
counter ion in the next dipping step are washed several times to remove excess amounts from the surface of the electrode. The other commonly used method is electrophoretic deposition, (ED), [73]; involves two steps, in the first step nanoparticles are synthesized and then infiltrated into titania particles in the second step. In ED, quantum dot particles are formed in solution phase and then inserted into titania mesopores by the help of high external voltage. Figure 1.13 shows schematic representation of different synthesis methods of photoanode of QDSSCs.
Figure 1.13. Schematic presentation of different synthesis method of photoanode of
QDDSCs.
Synthesis of the nanoparticles and coating steps are not well controlled in the SILAR method, so where and when the nanoparticles are formed and whether the titania particles fully coated are still unknown. Each dipping might block the pores of titania and next coating steps become unnecessary or result in the formation of useless nanoparticles coating on the external surface. In the ED method, applying high voltage to the nanoparticle solution causes unwanted reactions and also the penetration of 3 nm particles into pores formed by 20-30 titania nanoparticles is not
21
easy; they could not diffuse through the film down to the bottom. If the bottom of these electrodes is white after CdSe loading with ED, it indicates diffusion problems. Therefore, cheap and new methods are needed for an effective sensitization of the titania film electrodes.
This thesis contains three syntheses with a goal of developing a general synthesis method for efficient QDSSCs. In the first part of the thesis, CdSe/TiO2 and
CdSe/SiO2 thin films that were synthesized by reacting mesoporous CdTiO3 and
CdO/SiO2 thin films (prepared using MASA method) under a H2Se gas atmosphere. Effects of the synthesis parameters (film thickness, calcination temperature, and H2Se
reaction condition) on solar cell performance were investigated. Second part involves adaptation of the MASA method for the modification of mesoporous titania films (prepared using Aeroxide® P25, 20-25 nm commercial TiO2 nanoparticles, denoted
as meso-P25) by meso-CdSe/SiO2 to make a solar active material. In this approach,
the MASA solution was infiltrated into the meso-P25, followed by calcination, and H2Se rection for an in-situ synthesis of the CdSe sensitizer. The materials were
characterized in each step of the preparation to elucidate the likely problems of the new synthesis method for the fabrication of photoanodes of the QDSSCs. Last part of the thesis, using MASA approach, many different mesoporous transition metal oxides thin films (such as ZnO, CuO, NiO, Co3O4, Fe2O3, and Mn2O3) have been
22
Chapter 2
2.
Materials
2.1 Materials
All chemicals and solvents were used without any further treatment.
Surfactants, 10-lauryl ether (C12EO10, CH3(CH2)11(OCH2CH2)10OH, Mw = 626.9
g/mol, Aldrich) and cetyltrimethylammonium bromide (CTAB, C16H33N(CH3)3Br,
Mw = 364.45 g/mol, Aldrich).
Cadmium(II) nitrate tetrahydrate ([Cd(H2O)4](NO3)2 99%, Aldrich), zinc(II) nitrate
hexahydrate ([Zn(H2O)6](NO3)2 98%, Aldrich), copper(II) nitrate pentahydrate
([Cu(H2O)5](NO3)2, Aldrich), nickel(II) nitrate hexahydrate ([Ni(H2O)6](NO3)2,
98%, Aldrich), cobalt(II) nitrate hexahydrate ([Co(H2O)6](NO3)2, 98%, Aldrich),
iron(III) nitrate nonahydrate (Fe(NO3)3.9H2O, 99%, Aldrich), manganese(II) nitrate
tetrahydrate ([Mn(H2O)4](NO3)2., 98%, Aldrich) are used without further
purification.
Titanium tetrabutoxide (Ti(OC4H9)4, %98, Aldrich), tetramethyl ortho-silicate
(TMOS, %99, Aldrich) are used as polymerizing agents.
Hydrogen selenide (H2Se, 99.99%, Air Products), hydrogen sulfide (H2S, 99.5%,
Aldrich) and sodium sulfide nonahydrate (Na2S.9H2O, 98%, Aldrich) are used
23
Ethanol (C2H5OH, 99.9%, Aldrich), hydrochloric acid (HCl, %37, Reidel-de Haën),
hydrofluoric acid (HF, 40-45%, Aldrich), nitric acid (HNO3, %65, Reidel-de Haën),
polyethylenimine, branched (designated as PEI, MW = 25000 g/mol) and sulfur (S8,
99.5%, Aldrich) are used as purchased.
Titania (TiO2, Aeroxide® P25, 20-25 nm commercial TiO2 nanoparticles, Aldrich),
Triton® X-100 (Aldrich), fluorine doped tin oxide coated glass slide (FTO, Aldrich) are used.
2.2 Synthesis of Materials
2.2.1 Synthesis of Meso-Cadmium Titanate Thin Films
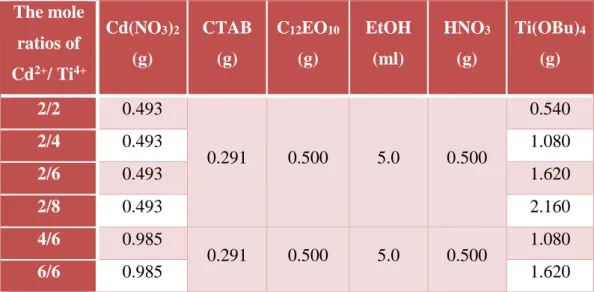
A mixture of required amounts of [Cd(H2O)4](NO3)2 (0.985 g) , CTAB (0.29 g), C 12 EO 10 (0.50 g) and ethanol (5.0 ml) was vigorously stirred for 15 min to obtain a
clear solution ( see Table 2.1 for details of the amounts of the ingredients for other mole ratio of Cd(II)/Ti(IV)). Then, a concentrated HNO3 (0.50 g) was added to the
above solution and stirred for another 10 min. Finally, titanium (IV) butoxide (n-butyl) (Ti(OBu)4) (1.080 g) was added to the mixture and stirred for additional 5
min.
Table 2.1. The amount of the ingredients of a cadmium titanate film
Before spin coating over a substrate, the above solution must be homogenous and clear. A few drops of the above solution were put on a substrate using the spin coater
The mole ratios of Cd2+/ Ti4+ Cd(NO3)2 (g) CTAB (g) C12EO10 (g) EtOH (ml) HNO3 (g) Ti(OBu)4 (g) 2/2 0.493 0.291 0.500 5.0 0.500 0.540 2/4 0.493 1.080 2/6 0.493 1.620 2/8 0.493 2.160 4/6 0.985 0.291 0.500 5.0 0.500 1.080 6/6 0.985 1.620
24
and spun for 20 s at 1000 rpm. The substrate can be a glass, quartz, Si wafer or FTO coated glass depending on characterization techniques. The coated substrates were placed in an oven at 80 °C to prevent a salt leach out and were calcined up to different temperature (above 300 °C) with 1 °C/min increments and kept 1 hour at that temperature.
2.2.2 Synthesis of Mesoporous-Cadmium Oxide-Silica
(meso-CdO-SiO
2) Thin Films
A mixture of required amounts of [Cd(H2O)4](NO3)2 (1.970 g) , CTAB (0.291 g), C 12 EO 10 (0.500 g) and ethanol (5.0 ml) was vigorously stirred for 15 min to obtain a
clear solution. Then, a concentrated HNO3 (0.05 g) was added to the above solution
and stirred for another 10 min. Finally, tetra methyl ortho silicate (TMOS) (0.85 gr) was added to the mixture and stirred for additional 5 min.
Before spin coating over a substrate, the above solution must be homogenous and clear. A few drops of the above solution were put on a substrate using the spin coater and spun for 20 s at 1000 rpm. A substrate can be a glass, quartz, Si wafer or FTO coated glass depending on characterization techniques. The coated substrates were placed in an oven at 80 °C and were calcined up to different temperature (above 300 °C) with 1 °C/min increments.
2.2.3 Preparation of Mesoporous Titania Films (meso-P25)
For the thicker films, doctor blade technique was used to obtain meso-P25 film over an any substrate (such as FTO or glass). 0.2 gr of titania (P25) was mixed with 12 drops of acetic acid, 1 drop of Triton-100, 0.6 ml of water, and 0.6 ml of ethanol in a vial and stirred overnight. The mixture was sonicated for 30 min. It becomes a paste that was spread over half of the 2x1 cm FTO glass. The sample was calcined at 450 °C for 1 h, denoted as meso-P25.
25
2.2.4 Synthesis of Mesoporous Cadmium Oxide-Silica-Titania
(meso-CdO-SiO
2-P25)
Films
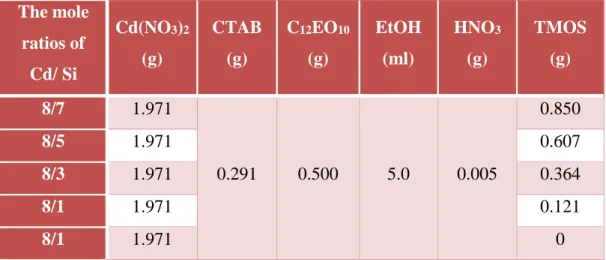
0.291 g of CTAB and 0.500 g of C12EO10 were dissolved in a 5 ml ethanol. For the
other compositions, all the ingredients are same but different amount (1, 3,5 or 10 ml) of ethanol was used. Then, 1.970 g of [Cd(H2O)4](NO3)2 and 0.05 g of
concentrated HNO3 were added to the solution and the solution was stirred for 10
min. 0.85 g of TMOS was added the above solution at once and stirred until the solution is homogenous and clear ( see Table 2.2 for details of the amounts of the ingredients for other mole ratio of Cd/Si). The meso-P25 film was placed over the spin coater, and 1-2 ml of the above solution was put over the meso-P25 film and spin coated at 1000 rpm for 30 s. The coated substrates were placed in an oven at 80 °C and calcined up to 450 °C with 1 °C/min increments.
Table 2.2. The amount of the ingredients for the production of meso-CdO-SiO2-P25
film
2.2.5 Synthesis of Mesoporous CdSe-TiO
2, Mesoporous CdSe-SiO
2,
and Mesoporous CdSe-SiO
2-P25 Films
The calcined meso-CdTiO3, meso-CdO-SiO2 or CdO-SiO2-P25 films was placed
into a homemade vacuum chamber (see Figure 2.1), designed for an H2Se reaction.
The chamber was evacuated to less than ~1 torr for a few minutes before exposing the sample to a H2Se atmosphere. 100 Torr of H2Se gas was added to the reaction
chamber and the reaction was carried out for 30 min at 100 °C. The reaction was also conducted under different conditions (such as in vacuum (~1 torr), in N2 (~
The mole ratios of Cd/ Si Cd(NO3)2 (g) CTAB (g) C12EO10 (g) EtOH (ml) HNO3 (g) TMOS (g) 8/7 1.971 0.291 0.500 5.0 0.005 0.850 8/5 1.971 0.607 8/3 1.971 0.364 8/1 1.971 0.121 8/1 1.971 0
26
300 torr), in N2 (~760 torr) or in air (~760 torr)) and temperatures (such as RT, 100
°C, or 200 °C). After the reaction, the chamber was evacuated by pumping the unreacted H2Se gas. The gas was sent to CdO-loaded silica and then to the
atmosphere through the fume hood.
Figure 2.1. Photograph of a fume hood, placed a homemade reaction chamber.
2.2.6 Preparation of the Electrodes and Installation of the QDSSC
The photoanode electrode (meso-CdSe-SiO2-P25 or meso-CdSe-TiO2) was dipped
into 0.1 M S2- aqueous solution (prepared by Na2S.9H2O) for 30 s, rinsed with
ethanol, and then dipped into 0.1 M Zn(II) aqueous solution (prepared using [Zn(H2O)6](NO3)2) for 30 s. This process was repeated three times to coat all
surfaces with ZnS nanoparticles. The counter electrode (CE) was prepared by cleaning brass with 1 M HCl for 5 min at 70 °C and reacted with a 0.1 M Na2S.9H2O
aqueous solution. The electrolyte solution was prepared using appropriate amount of Na2S.9H2O and elemental sulfur (S8) in 10 ml of water to ensure 2 M S2- and 2 M
S in the solution.
The anode electrode and CE were sandwiched using a spacer (Parafilm). The electrolyte (S2-/S) solution was infiltrated between the electrodes and the electrodes
were clamped with a paper clip.
H2Se
gas sample
in/out reaction chamber
H2Se gas is sent
N2 gas is sent pressure display
27
2.2.7 Synthesis of Mesoporous Transition Metal Oxides Thin Films
0.291 g of CTAB and 0.500 g of C12EO10 were dissolved in a 5 ml of ethanol. For
each composition, all ingredients are same but different transition metal precursor was used. Then, 1.900 g of [Zn(H2O)6](NO3)2, or 1.776 g of [Cu(H2O)5](NO3)2, or
1.857 g of [Ni(H2O)6](NO3)2, or 1.853 g of [Co(H2O)6](NO3)2, or 2.580 g of
Fe(NO3)3.9H2O was added to the solution and the solution was stirred for 10 min.
Before spin coating over a substrate, the above solution must be homogenous and clear. A few drops of the above solution were put on a substrate using the spin coater and spun for 20 s at 1000 rpm. The substrate can be a glass, quartz, Si wafer or FTO coated glass depending on characterization techniques. The coated substrates were placed in an oven at desired temperature and were calcined up to different temperature (above 300 °C) for 2 h.
2.3 Equipment
2.3.1 X-Ray Diffraction (XRD)
A Rigaku Miniflex diffractometer equipped with a Cu Kα (1.5405 Å) X-rays source operating at 30 kV/15 mA and a Scintillator NaI (T1) detector with a Be window was used for small angle (1°-5°, 2θ measurements for the gels on glass microscope slides.
Two diffractometers, Rigaku Miniflex diffractometer and Pananalytical Multi-Purpose X-ray diffractometer (equipped with a Cu Kα (1.5405 Å) X-rays source operating at 45 kV/40 mA), were used for wide angle (10°-80°, 2θ) XRD measurements of powder samples.
2.3.2 Infrared Spectroscopy
A Bruker Tensor 27 model FT-IR spectrometer was used for FT-IR spectra. A DigiTectTM DLATGS detector was used with a resolution of 4 cm-1 and 64 scans in 400-4000 cm-1 range for all samples. Samples were prepared as pellets mixing in
28
KBr (2% w/w) or spin coated on IR transparent Si (100) wafers depending on phase of the samples.
A Bruker Alpha Platinum ATR-IR spectrometer was used for ATR-IR spectra with a resolution of 4 cm-1 and 64 scans in 400-4000 cm-1 range. The spectra were measured after adding a few drops of solution on the diamond ATR crystal.
2.3.3 Ultraviolet (UV)-Visible Absorption Spectroscopy
A Varian Cary 5, double beam spectrophotometer, was used for the UV-Vis spectra with a 100 nm/min speed and a resolution of 2 nm over a UV-visible wavelength range from 200 nm to 800 nm in absorbance mode. The substrates were glass, quartz or fluorine doped tin oxide (FTO) so when we observed the absorption of the samples, the glass, quartz or FTO was used as a reference depending the substrates to eliminates error coming from different substrates.
2.3.4 X-Ray Absorption Spectroscopy
The EXAFS and XANES measurement were carried under the I-20160351 EC project number using P65 beamline between October 08th and 10th, 2016 at DESY, Germany. The reference samples (CdO, CdSe, CdTiO3) were first recorded in both
XANES and EXAFS regions of the spectra. Due to sample limitations, most measurements were carried in florescence mode. For Cd-K edge (26720 eV), the measurements were performed between 26500 – 27500 eV and for Se-K edge (12666 eV), the measurement were performed between 12600 – 13600 eV.
The collected data were further analyzed using Athena software.
2.3.5
29Si Nuclear Magnetic Resonance (NMR) Spectroscopy
A Bruker Superconducting FT.NMR spectrometer Avance TM 300 MHz WB spectrometer with a 7-mm double channel Bruker probe-head was used at room temperature for 29Si MAS spectra.
29
2.3.6 Raman Spectroscopy
A LabRam Model confocal Raman microscope with a 300-mm focal length was used for the micro Raman spectra. The spectrometer is equipped with both HeNe laser operated at 20 mW, polarized 500:1 with a wavelength of 632.817 nm, and dipole-pumped solid-state laser operated at 50 mW, polarized 100:1 with a wavelength of 532.1 nm, and a 1024 x 256 element CCD camera. The signal collected is transmitted via a fiber optic cable into a spectrometer with 600 or 1800 g/mm gratings. The sample on a silicon wafer were placed at the desired point manually.
2.3.7 Scanning Electron Microscope (SEM) and Energy Dispersive
X-Ray Spectroscopy (EDS)
Zeiss EVO-40 SEM microscope, operated at 20 kV with a Bruker AXS XFlash EDS detector 4010 attached to the same microscope were used for imaging and elemental analysis. Carbon adhesive tabs were used to attach the samples on the silicon wafer or on FTO to the aluminum sample holders.
2.3.8 Transmission Electron Microscope (TEM)
A FEI Technai G2 F30, operated at 200 kV was used for the TEM images.
The samples were prepared by using the following procedure; the MASA solution was spin coated on glass substrate at 5000 rpm, after calcination, the film was scraped and then dispersed in 10 ml ethanol solution using a sonicator for 30 min. If the samples are not calcined, the samples were dissolved in ethanol and dispersed by shaking because sonication can crystallize the samples. The dispersed solution was put on a holey carbon film on 200 mesh cupper grids for TEM measurements and then heated under powerful light to evaporate ethanol.