AN EGARCH ESTIMATION FOR ARBITRAGE MODELING :
PRE- AND POST- CRISIS
Merve Nayman
113621003
ISTANBUL BILGI UNIVERSITY
INSTITUTE OF SOCIAL SCIENCES
FINANCIAL ECONOMY MASTERS PROGRAM
ADVISOR: Asst. Prof. Serda Selin Öztürk
ISTANBUL BILGI UNIVERSITY
INSTITUTE OF SOCIAL SCIENCES
An EGARCH Estimation for Arbitrage Modeling: Pre- and Post- Crisis
MERVE NAYMAN
i
Abstract
Previous studies focused on the effects of macroeconomic variables on stock returns without using EGARCH model. In this thesis, I investigate whether the relationship between the exchange rate, the lagged return value, and inflation on real stock returns change due to the crises by using EGARCH model for Turkey. This thesis provides some evidence, which may be considered as country specific, that the effects of macroeconomic variables on the stock market can change when the timing of the global crisis taken into consideration.
Keywords: EGARCH Analysis, Stock Return, Exchange Rate, Inflation
ii
Özet
Bu çalışmada krizin döviz kuru, gecikmeli dönüş değeri ve enflasyonun hisse senedi getirileri üzerindeki etkisi; EGARCH modeli kullanılarak Türkiye için incelenmiştir. Küresel krizlerin zamanlaması dikkate alınmış olup, spesifik bir ülke örneği üzerinden makroekonomik değişkenlerin borsadaki etkileri hakkında veriler çıkarılmıştır. Tez sonuçları, ülkeye spesifik olması mümkün olan, makroekonomik değişkenlerin etkisinin krizin zamanlaması dikkate alındığında değişebileceğine bazı kanıtlar sunmaktadır.
Anahtar Kelimeler: EGARCH Analizi, Stok Getirisi, Döviz Kuru,
iii ACKNOWLEDGEMENTS
I would like to thank to my supervisor Serda Selin Öztürk who provided resources for me to realize this study with success. I really appreciate her comments and useful insights about the learning experience when conducting empirical research. Also, she favored me with her reassuring kindness in all my demoralized times and couraged me to do the best. I am thankful for having the chance to work with her.
Also, I would like to thank to my loving parents who encouraged me to achieve the end up this study. They have always been a great inspiration to me and had a great role in the establishment of this thesis.
Finally, I would like to thank my family for their never-ending support, not only during my time as a student, but also throughout my life and in everything I undertake.
iv
Table of Contents
1
Introduction ... 1
2 Review of the Literature ... 2
3 The 2008 Crisis ... 8
4 Data and Methodology ... 10
4.1 Data ... 10
4.2 Methodology ... 10
5 Results ... 17
6 Conclusions ... 21
vi
LIST OF FIGURES
vii
LIST OF TABLES
Table 1: Descriptive Statistics of stock returns, inflation and the
exchange rate for the whole period………. .14
Table 2: Descriptive Statistics of stock returns, inflation and
exchange rate for first subperiod (February 2003- November
2008) ………..…14
Table 3: Descriptive Statistics of stock returns, inflation and
exchange rate for the second subperiod (November 2008 to
October 2014) ………..…...15
Table 4: EGARCH model for the period prior to November
2008. ………...18
Table 5: EGARCH model for the period after November 2008 19
Table 6: EGARCH model results for the whole period…….... 20
1 1 Introduction
World economy experienced a big crisis in November 2008. Turkey has also been influenced by this crisis, although the effects on were not been as severe as in other countries. This paper presents to have information about the dynamics of the stock return and its volatility, in addition to looking at any asymmetric response in the volatility before and after the November 2008 crisis. I will investigate whether the changes in three macroeconomic variables, which are respectively; the exchange rate, the lagged return value, and inflation, had an effect on the real stock returns change due to the economic crisis.
In that respect, Istanbul Stock Exchange in three different time periods is studied in this paper, namely the ISE 100 index for the whole February 2003 - November 2014 period, the first subperiod between February 2003 and November 2008 (pre-crises), and the second subperiod between November 2008 and October 2014 (post-crises). The time difference is due to the availability of the data. Firstly, the entire data is studied and the effects of inflation, lagged return value, and the exchange rate on real stock returns is examined. Secondly, the time period is divided into sub-periods by taking the timing of the global crises into consideration. In this way, it becomes possible to see whether or not the crisis have significant role on the effects of the variables. In my study, I follow a similar methodology to the study of Kutan&Aksoy (2003). They investigate the dynamics of stock returns by dividing the sample period into sub-periods, according to the timing of the
2
2001 crises. They found that these dynamics are different in the pre- and post-crises periods. In this methodology they consider also the asymmetric response of volatility of returns to the shocks by using an EGARCH model for the stock return data which generally appeared to be in an asymmetric structure. “Asymmetry”, as referred to in the study, means that volatility reacts differently in the case of good and bad news. In other words, according to See Engle & Ng (1993), after downward movements, higher volatilities are observed in the stock market compared to the upward movements of the same magnitude.
The study proceeds as follows, section 2 refers the current study in the context of the literature, section 3 gives information about the 2008 crisis periods, section 4 outlines the methodology, Section 5 analyzes the data and the results of the analysis. Finally section 6 concludes the study.
2 Review of the Literature
There are numerous related works in the literature which attempt to describe the effects of macroeconomic variables on real stock returns. Some of these studies concentrate only on the relationship between inflation and stock return. Fama & Schwert (1977), Schwert (1981), and Fama (1981) found a significant negative relationship between the stock market and inflation. However, some studies such as Pearce & Roley (1985) and Hardouvelis (1988) found no significant relationship between the two variables. On the other hand, some studies defend the positive relationship between inflation and stock prices Gregoriou et al., (2006); and Bekaert et al., (2009).
3
According to Fama (1981), the stock returns are influenced by inflation through real activities. By using the Proxy hypothesis, which was introduced by Fama & Schwert (1977), Fama’s investigation show a negative long term relationship between the stock prices and inflation in 1981. The negative relationship between stock returns and inflation is explained by the positive relationship between stock returns and basic determinants of equity values which all are effective on stock prices through inflation. In addition, according to Gregoriou & Kontonikas (2006), the relationship between stock prices and inflation is positive in the long term. Moreover, the findings advocate the generalized Fisher hypothesis that stock can hedge against inflation.
In the analysis of Army & Hassama (2009), they study the short and long-run effects of macroeconomic variables, namely the inflation rate, money supply, and the exchange rate on stock prices (Kuala Lumpur Composite Index; KLCI) for Malaysia in the pre-crisis (1987-1995) and post-crisis periods (1999-2007) by using monthly data. The findings show that there is cointegration between stock prices and macroeconomic variation. The findings indicate that these variables share a long-run relationship in both periods, indicating that deviations in the short-run stock prices will be adjusted towards a long-run value.
Merika & Anna (2006) re-examine Fama’s proxy hypothesis which states that inflation is negatively related to real economic activity and the negative relationship between stock returns and inflation reflects the positive impact of real variables on stock returns. Merika and Anna test the hypothesis that
4
stock prices respond negatively to positive and real economic activity. According to their research, strong economic activity causes inflation and it causes policy makers to apply a counter cyclical macroeconomic policy. Kim & Francis (2005) argued that the Fisher hypothesis (1930) which states that stock return will be directly and positively related to inflation, based on a wavelet multi-scaling method for the US, for the period from 1926:1 to 2000:12. Empirical results show that there is a positive relationship between stock returns and inflation at the shortest scale (one month period) and at the longest scale (128month period), while a negative relationship is shown on the intermediate scales.
The study of Geetha, Mohidin, Chandran, and Chong (2011) investigates the relationship between the stock market, expected inflation rate, and exchange rate. In this study, investors use a cointegration test to determine the number of cointegrating vectors. By the help of cointegrating vectors they find that the long run relationship between the variables, the short run relationship is determined using the Vector Error Correction Modeling (VEC). Long run is the period in which the general price level, contractual wage rates, and expectations is completely flexible for the economy. Incontrast, in the short run these variables may not fully adjust. The results of VEC showed no short run relationship between the stock market, expected inflation, exchange rate, and interest rate. The VEC results also show that there is a short run relationship between expected inflation rates and the stock market by using the data sets for China. This study shows some evidence that there is a significant short run relationship between the
5
stock market and the expected inflation rate. In addition, there is a significant relationship between the exchange rate and stock market. Therefore, investors may not gain any portfolio diversification benefits in the short run. According to the study, macroeconomic variables are influencing the stock market as well as the inflation rate. In an empirical study conducted by Ralph & Eriki (2001) on the Nigerian stock market, a negative relationship between stock prices and inflation is found. They also show that the stock prices are also strongly motivated by the level of economic activity measured by the GDP, interest rate, money stock, and financial deregulation.
The study of Çiftçi (2014) investigates the influence of four macroeconomic variables (crude oil, the interest rate, the exchange rate, and gold) on stock returns of ten US industries. The study uses monthly data from February 1997 to September 2014. The observation period is divided into a pre-crisis and post-crisis period; the period as a whole is also analyzed via the Ordinary Least Squares (OLS) approach. The findings of this paper illustrated that the impact of some macroeconomic variables differs between industry sectors, whereas one variable has a homogenous impact.
The study by Muradoğlu & Metin (1996), using the cointegration method and monthly values of various macroeconomic variables, reports that the proxy effect was observed in the short run. The empirical results of Muradoğlu and Metin indicate that stock returns are expected to increase due to an increase in exchange rates. Another research by Kasman (2003) states that the change in the exchange rate triggers a change in stock indices.
6
If the exchange rate increases, investors expect a decrease in stock prices. Their results show that investors would prefer to sell their stock to buy foreign currency. The conclusion of Kasman shows that there exists a long run stable relationship between stock indices and exchange rates.
In the analysis of Lin (2012), the comovement between the exchange rate and stock prices in the Asian emerging markets is examined. Lin investigates how the exchange rate and stock prices change after major news in the long and short-run. The study shows evidence of stronger comovement in the crisis periods.
Pan (2007) uses VAR and Granger causality tests, in addition to impulse response analysis, to analyze the connectedness between exchange rates and stock prices for seven East Asian countries/regions, including Hong Kong, Japan, Korea, Malaysia, Singapore, Taiwan, and Thailand, for the period of January 1988 to October 1998. Results indicate that there is a significant relationship between exchange rates and stock markets before the Asian financial crisis; on the other hand no country exhibits a significant relationship between stock prices and exchange rates during the Asian crisis. The research made by Chili (2011) investigates the dynamic relationships between exchange rates and stock returns in four emerging countries, which are Hong Kong, Singapore, Malaysia, and Mexico during both normal and turbulent periods (1994-2009) by using the Markov-Switching EGARCH model. According to this study, the relationship between stock and foreign
7
exchange markets depends on the regime, and stock-price volatility responds asymmetrically to shocks affecting the foreign exchange market. In the article Lean et al., Halim et al., and Wonget al. (2005), they analyze the dynamic relationship between stock prices and exchange rates by using the cointegration and bivariate causality techniques for seven Asian countries/regions, namely Hong Kong, Indonesia, Singapore, Malaysia, Korea, Philippines, and Thailand, which were highly affected by the 1997-1998 Asian financial crisis and they also investigate the effect of 9/11 on the relationship between these variables. Their results show that the Asian financial crisis has a bigger and more direct impact on the causality relationship between stock prices and currency exchanges in Asian markets, and the September 9/11 terroristattack basically had no impact.
Chkili and Nguyen et al. (2014) examine the dynamic linkages between the exchange rates and stock market returns for the BRICS countries (Brazil, Russia, India, China, and South Africa) by using a regime switching VAR model. The dynamic linkages between stock and exchange rate returns show that exchange rate changes do not affect stock market returns of BRICS countries andthisresultdoes not changebased on the period they have been, namely in calm or turbulent periods. The impact of stock market returns on exchange rates is significant for all countries, exceptof South Africa during the bull period. The result of the study also shows that these empirical insights have significantaffects for portfolio investments.
8
Aggarwal (1981) finds that revaluation of the US dollar is positively related to stock market returns. In contrast, while Soenen & Hennigar (1988) find a significant negative relationship during the period of 1980-1986, Roll (1992), using daily data over the period lasting from 1988-1991, finds a positive relationship between the two markets. On the other hand, Chow et al. (1997), using monthly data, find no relationship for monthly excess stock returns and real exchange rate returns for the 1977-1989 period.
As one can see from the discussion above, there is a long list of literature on the macroeconomic variables and their effects on stock prices. The literature shows conflicting results in different analysis. Some researchers report either there is a negative or positive relationship between stock market returns and exchange rate or inflation rate in other words, these variables affected on stock market while other researchers have reported that there is not no significant relationship between stock market returns and exchange rate or inflation rate in other words, these variables do not affect stock returns. Therefore, these results show that the relationship between these variables may be country and/or period specific. I investigate these effects and their relationship in the pre- and post-global crisis for Turkey.
3 The 2008 Crisis
The world economy experienced a widespread crisis in 2008, which was the biggest economic crisis since the Great Depression of 1929 that was initiated with the bankruptcies of mortgage firms and banks in the USA. The effects of global crisis have affected the global economy for different
9
countries. In Turkey, the ISE, or the Istanbul Stock Exchange, was damaged and stock performances of the firms were also directly affected by the crisis. Foreign investors have more shares than domestic investors in the ISE. There was doubt about the future of the economy, which created bad conditions for the ISE. The construction sector in Turkey is another part of the economy, which was directly damaged by its subsections. After the 2008 crisis, the size of the construction sector diminished. Firms’ performances also declined in the foreign investments. Turkey entered serious economic instability. The result of this instability mostly affected debt which caused external debt to increase. Exports declined as a result of the crisis negative impact on the production industry.
As stated by Yeldan (2008), Turkey’s post-crisis adjustment under the AKP administration is similar to the adjustments of many developing countries. Turkish economy now is more dependent upon foreign capital and conditioned to contractionary policies. Turkey, with the AKP government, tried to manage the crisis. The most famous quote from R.Tayyip. Erdoğan was that the crisis will be tangential. Unfortunately, the global crisis did not tangentially pass by Turkey. The result of the crisis was that Turkey’s economy tightened. Turkey’s problematic growth strategy was going to end up with a domestic economic crisis. Capital flows reduced with the GDP growth, and it brought about the 2008-2009 recession.
10 4 Data and Methodology
4.1 Data
In this study, monthly data for the Stock Price Indices (SPI), Consumer Price Index (CPI) , and exchange rates are used. Since SPI and exchange rates are daily data we use the end of the month rate for these variables. Inflation is an unpredictable factor which affects the share prices either positively or negatively. An increase in inflation affects the stock market negatively and a decrease in inflation affects the stock market positively. The Consumer Price Index (CPI) is considered as measure of inflation and data for the period between February 2003 and October 2014 is retrieved from the Central Bank of Turkey’s online database.
The exchange rate is the rate at which one currency is being converted into another currency. The exchange rate taken for this study is taken against per US dollar from the period of February 2003 to October 2014. This data has also been collected from the Central Bank of Turkey.
The indices are calculated by the Turkish Statistical Institute (TURKSTAT), such as the Stock Price Indices. The Istanbul Stock Exchange’s main index, BİST-100 (TR:XU100), is also used. The period for BİST-100 is from February 2003 to October 2014. The periods are selected due to the availability of the data.
4.2 Methodology
In this study, the effects of three macroeconomic variables (inflation, the lagged value of return, and the exchange rate of both real stock returns) are
11
the aim. The Generalized Autoregressive Conditional Heteroscedastics, or the GARCH model, is used for modelling and forecasting volatility. The analysis includes volatility, so the most appropriate method appears to be Garch models. This model has two equations and is used as a variance formula to be estimated simultaneously with the normal regression model in the mean formula. The Exponential Generalized Autoregressive Conditional Heteroscedastic model (EGARCH) was proposed by Nelson (1991) which is the asymmetric form of the GARCH model. Nelson, who takes asymmetric impact into consideration, used a logarithmic form of conditional variance, which he also called “exponential”. GARCH model and the EGARCH model were used to capture the stochastic variations and asymmetries in the data. Based on the results using both models, the GARCH model of order (1; 1) and EGARCH model of order (1; 1), I decided to use EGARCH model since the goodness-of-fit test statistic indicate that it performs better than the GARCH model. I believe that the better performance of EGARCH model is due to the nature of the data having highly irregular fluctuation. Another strength of this model is that non-negativity constraints in the standard GARCH models are not assumed.
Although the volatility of the standard GARCH model has a complicated functional dependency on the innovations due to the additive structure, the volatility of the EGARCH model is measured by the conditional variance and formulated as explicit multiplicative function of lagged innovations. The specific EGARCH model that I used in this thesis is formulated as follows;
12 Rt = α + βinft+ γexcht+ δRt−1+ εt (1) log(σ2) = ω + τ log(σ t−1 2 ) + ϑεt−1 σt−1+ φ | εt−1 σt−1| (2)
where Rt is logarithmic stock return at time t, excht is the exchange rate
(USD/TL) at time t, logσt2 is the volatility at time t. σ2 is the conditional variance at time t, and εt is the error term at time t. One period lagged value of stock return, Rt−1, is also included in the model. τ is the persistence
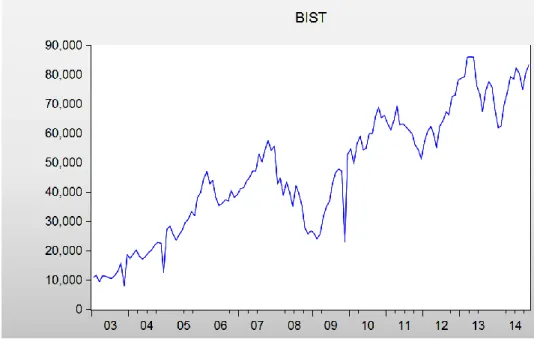
parameter, and ϑis the coefficient of asymmetry. If ϑ=0, volatility do not respond to good news and bad news asymmetrically.In this study, we take p=q=1. The EGARCH (1, 1) model expressed daily stock market returns as a function to explain the variation of the conditional mean. We examine the return-volatility relation through the EGARCH (1,1) model to take into account the impact of good and bad news on the volatility, knowing the fact that both types of news have different kinds of effect on the market. In addition, in the light of information asymmetry, the study has used the EGARCH (1,1) model, which allows for asymmetric volatility shocks. Our purpose is to see if there exists a relationship between these variables, and if it exsits, whether it has stable during the global crisis. We analyze the stock price data graphically to decide on the break-point in the data set. The graph suggest November 2008 as the break point and also the Chow test results support this hypothesis.
13
Figure 1: BIST index for the whole period.
The descriptive statistics for lagged return, inflation, and the exchange rate of Turkey is reported in Tables 1 through 3. In Table 1, the results for the whole period are reported, while Tables 2 and 3 report the results for the subperiods which are February 2003-October 2008 and November 2008-October 2014. The mean and standard deviation have been calculated for each variable taken for the analysis and it is tabulated below for the whole period, pre-crisis and post-crisis.
14
Table 1: Descriptive Statistics of stock returns, inflation and the exchange rate for the whole period.
Mean Standard Deviation
Stock Return 0.0141 0.1734
Inflation 0.0067 0.6906
Exchange Rate 0.0055 0.0332
Table 2: Descriptive Statistics of stock returns, inflation and exchange rate for first subperiod (February 2003 to November 2008)
Mean Standard Deviation
Stock Return 0.1726 0.1974
Inflation 0.0075 0.9944
15
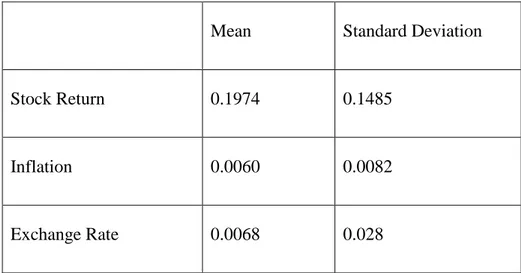
Table 3: Descriptive Statistics of stock returns, inflation and exchange rate for the second subperiod (November 2008 to October 2014)
Mean Standard Deviation
Stock Return 0.1974 0.1485
Inflation 0.0060 0.0082
Exchange Rate 0.0068 0.028
Mean of stock return, inflation, and exchange rate decreased after 2008. The maximum decline is observed in the inflation rate. This is because of the fact that the new government has been making novel arrangements in the economy. The Central Bank of the Republic of Turkey has aimed at a policy which includes price stability and financial stability. When evaluating the situation, according to price stability, one sees that the global price increases resulted in stable inflation declines after 2001. So there has been the problem of occasional inflation in the 2008-2012 period.
It is reported in Table 1 that means for monthly stock return, inflation and exchange rate are 1,4102%, 0.6784%, and 0.5521%, respectively, for the whole period. In Table 3, we see that the means of stock return is high since this period includes the years where BİST was at its peak point. The lowest rate of inflation is examined in the post-crisis period. Turkey has been one
16
of the riskiest countries, among the developing countries when coming against the crisis because real interest rates are still very high. The reason for the high rate is the need for foreign investment, but this is not the only reason. In developing countries, governments continue to increase real interest rates or continue to have high interest rates so as to avoid high inflation rates. However, since November 2008, inflation rates have started to decrease in the world economy, and in developing countries, the governments have started to reduce interest rates, albeitbya small percentage. For developed countries, the main reason for interest rate reductions is to obtain financial stability and its contribution to reductions in the inflation rate.
Moreover, in post-crisis period, mean of the exchange rate is higher than it is in the pre-crisis period. As a positive effect of the 2001 economic crisis in Turkey, Turkey had practiced in a deep crisis environment and has knowledge about dealing with crisis. Since 2001, a floating exchange rate regime has been implemented as a precondition for the inflation targeting regime. Until the 2008 global crisis, Turkey was almost ready for a global crisis as the Turkish government has fulfilled various stabilization programs. The floating exchange regime has made a significant contribution to the stability of the Turkish economy. As a result of these problems, Turkey has a better public finance balance and is now more experienced than before the crisis. Also, the auditing in the financial sector has been fortified.
17
In general, crises have a negative impact on stock returns for all sectors, with the banking sector being significant in the period of the global financial crisis to avoid any bankruptcy and no Turkish bank being bankrupted in the crisis process. The effects of the global financial crisis on the Turkish economy were limited to the banking sector which was regulated after the exchange rate crisis in 2001. These market conditions did not create big losses in the Turkish banking sector.
5 Results
Main results of the analysis can be summarized as follows. Before the crisis, inflation did not have any significant effect on the return; but after the crisis, the inflation rate’s coefficient became significant and it indicates that a 1% increase in inflation causes 3% decrease in stock return. In the pre-crisis period, the lagged return value is significant at a 10% significance level and it indicates a negative relationship between the stock return and the lagged value of the return; but it is not significant in the post-crisis period. Change in the exchange rate is significant and it has a negative effect on return in both periods, but its effect is slightly higher in the pre-crisis period.
18 Table 4: EGARCH model for the period prior to November 2008.
Return Equation
Variables Coefficient Std. Error Z-Statistic P-Value
Constant 0.01519 0.01165 2.504 0.0123 * Inf.Rate 0.0034 0.0306 -0.0417 0.9667 Lagged Return 0.0188 0.0659 -1.707 0.0877 * Exchange Rate -1.212 0.2682 -5.935 0.0000 * Volatility Equation 𝛚 -5.072 1.500 -3.380 0.0007 * 𝛕 0.1042 0.34014 0.3063 0.7593 𝛝 -0.2237 0.1761 -1.270 0.2040 𝛗 1.404 0.1824 7.700 0.0000 * R-squared 0.1232
19 Table 5: EGARCH model for the period after November 2008
Return Equation
Variables Coefficient Std. Error Z-Statistic P-Value
Constant 0.02108 0.0109 1.935 0.0529 Inf.Rate -3.704 0.8530 -4.341 0.0000 * Lagged Return 0.112 0.1015 1.102 0.2705 Exchange Rate -1.159 0.2943 -3.941 0.0001 * Volatility Equation 𝛚 -6.126 0.8878 -6.900 0.0000 * 𝛕 -0.0670 0.2118 -0.3163 0.7517 𝛝 0.2615 0.219 1.194 0.2322 𝛗 1.387 0.35 3.974 0.0001 * R-squared -0.0405
20
Any asymmetric response in the volatility in neither the pre- nor post-crises periods could be found. Furthermore, the persistence parameter estimates in both periods are not significant. The only significant parameter in both estimations is the coefficient of the absolute value term, and in terms of the value, it is similar in both periods.
On the other hand, the results for the whole period are quite different compared to the subperiod results, especially from the post-crisis period results. For the return equation, only the change in the exchange rate is significant. In terms of the volatility, the equation results still do not indicate any asymmetric response.
Table 6: EGARCH model results for the whole period.
Return Equation
Variables Coefficient Std. Error Z-Statistic P-Value
Constant 0.0151 0.0105 1.439 0.1501 *
Inf.Rate 0.0034 0.0306 0.1123 0.9105
Lagged Return 0.0188 0.0659 0.2853 0.7753
21 Volatility Equation 𝛚 -6.700 0.4245 -1.578 0.0000 * 𝛕 0.7595 0.1069 7.100 0.0000 * 𝛝 -0.0766 0.060619 -1.264 0.2061 𝛗 -0.5022 0.0839 -5.983 0.0000 * R-squared 0.038087
Note: “*” indicated variables are significant at 5% significance level.
These results suggest that, by analyzing the model based on the subperiods, we gain useful information about the dynamics of the stock return and its volatility. These dynamics are different in the pre- and post-crises periods. One should be careful about the existence of crises when analyzing the stock return and its volatility dynamics.
6 Conclusions
In this thesis I try to examine the effects of macroeconomic variables on stock returns. Furthermore, by using an EGARCH model, I analyze if volatility responds asymetrically to the good news and bad news. Finally, by dividing the sample period into two subperiods based on the timing of the
22
recent global crisis, I analyze whether if the relationship between these variables is stable during the crisis.
The results suggest that the relationship is not stable during the crisis and storck return responds differently to the increases in inflation rate, exchange rate and lagged return variable in two sub-periods. Volatility estimation results also show that there is not asymmetric response structure in the volatility of the stock return neither in pre- nor in post-crisis period. Furthermore although the GARCH parameter is significant for all three period the persistence parameter is only significant for the whole period.
23 References
Abu, H. 2005. “Modelling and Forecasting on the Malaysian Inflation Rates: An Application of GARCH models”. 1(13).
Acikalin, S., Aktas, R. and Unal, S. 2008. “Relationships between stock markets and macroeconomic variables: An Empirical Analysis of The Istanbul Stock Exchange”. Investment Management and Financial Innovations, 5(1).
Aggarwal, R. 1981. "Exchange Rates and Stock Prices: A Study of the US Capital Markets under Floating Exchange Rates". Akron Business and Economic Review, (Fall), 7(12).
Asmy, M., Rohilina, W., Hassama, A. and Fouad, M. 2009. ”Effects of Macroeconomic Variables on Stock Prices in Malaysia: An Approach of Error Correction Model”.
Baker, M. and Wurgler, J. 2007. ”Investor sentiment in the stock market”.
Balaban, N. 2009. “Global Economic Crisis and Turkey”. Journal of Ankara, 40,124-128.
Caroline, G., Rosle, M., Chandran, V. and Victoria, C. 2011. “The Relationship between Inflation and the Stock Market: Evidence from Malaysia, the United States, and China”. International Journal of Economicsand Management Sciences, 1(2), 1-16.
Chkili, W., DucKhuong, N. 2014. “ Exchange rate movements and stock market returns in a regime-switching environment: Evidence for BRICS countries”. Economics and Management Sciences, 1(2), 01-16.
Chkili, W., Aloui, C., Masood, O. and Fry, J. 2011. “Stock market volatility and exchange rates in emerging countries:A Markov-state switching approach”. Emerging Markets Review. 12, 272-292.
Chow, E.H., Le, W.Y. and Solt, M.S. 1997. "The Exchange Rate Risk Exposure of Asset Returns". Journal of Business, 70, 105-123.
Çiftçi, S.2014. ”The influence of macroeconomic variables on stock performance”.
Davis, N. and Kutan, A.M. 2003. “Inflation and output as predictors of stock returns and volatility: International evidence”. Applied Financial Economics, 13, 693-700.
Engle, R. F. and Ng, V. K. 1993. “Measuring and testing the impact of news on volatility”. Journal of Finance, 48 (5), 1749-1778.
Fama, E. F. 1981. “ Stock Returns, Real Activity, Inflation, and Money”. The American Economic Review, 545-565.
24
Fama, E. F. and Schwert, G. W. 1977. “Assets Return and Inflation”. Journal of Financial Economics, 5, 115-146.
Fama, E.F. and Schwert. G. W. 1997. “Asset return and inflation”. Journal of Financial Economics, 5, 115-46.
Fisher, I. 1930. ” The Theory of Interest”. New York, Macmillan, 43.
Gallagher, L. A. and Taylor, M. P. 2002. “The stock-return puzzle revisited”. Economics Letters, 75, 147-156.
Handroyiannis, G. and Papapetrou, E. 2006. “Stock returns and inflation in Greece: A Markov switching approach”. Review of Financial Economics, 15, 76-94. Hardouvelis, G. A. 1988. “The predictive power of the term structure during recent
monetary regimes”. Journal of Finance, 43 (2), 339-356.
Kandir, S. Y. 2008. “Macroeconomic Variables, Firm Characteristics and Stock Returns: Evidence from Turkey”. International Research Journal of Finance and Economics, (16).
Kasman, S. 2003. “The Relationship Between Exchange Rates and Stock Prices: A Causality Analysis”. Dokuz Eylül University Journal of Social Sciences Institute, 5 (2), 70-79.
Kim, S. and Francis, I. 2005. “The Relationship Between Stock Returns and Inflation: New Evidence from Wavelet Analysis”. Journal of Empirical Finance, 12, 435-444.
Kutan, A. M. and T. Aksoy. 2003. “ Public information arrival and fisher effect in emerging markets: evidence from stock and bond markets in Turkey”. Journal of Financial Services Research, 23(3):225-239.
Limpanithiwat, K. and Rungsombudpornkul, L. 2001.“Relationship of Inflation and Stock Price in Thailand”. Umeå School of Business, 4, 62
Lin, C. 2012. “The comovement between exchange rates and stock prices in the Asian emerging markets”. International Review of Economics and Finance, 22, 161-172.
Merika, G. A. and Anna, A. M. 2006. “Stock prices response to real economic variables: the case of Germany”. Managerial Finance, 32(5), 446-450.
Mohan, C. and Chitradevi, N. 2014. “Inflation Impact of Inflationand Exchange Rate on Stock Market Performance in India”. The IndıanJournal Of Applied Research, 4(3 ).
25
Muratoğlu, G., Metin, K. and Argaç, R. 2001. “Is there a long run relationship between stock returns and monetary variables: evidence from an emerging market”. Applied Financial Economics, 11,641-649.
Ozbay, K. 2009. “The Relationship between stock between stock returns and macroeconomic factors: Evidence from Turkey”. Fınancıal Analysis and Fund Management Unıversity of Exeter, 63.
Öniş, Z. 2012. "The Triumph of Conservative Globalism: The Political Economy of the AKPEra". Turkish Studies , 1-22.
Pan, M.S., Fok, W. and Liu, Y.A. 2007. “Dynamic linkages between exchange rates and stock prices: evidence from East Asian markets”. International Review of Economics and Finance, 16, 503–520.
Roll, R. 1992. "Industrial Structure and the Comparative Behavior of International Stock Market Indices". Journal of Finance, 47, 3-41.
Soenen, L.A. and Hennigar, E.S. 1988. "An Analysis of Exchange Rates and Stock Prices - The US Experience between 1980 and 1986". Akron Business and Economic Review, 7-16.
SEREL, A. and BAYIR, M. 2013. “2008 Finansal Krizinde Para Politikası Uygulamaları:Türkiye Örneği ”. Yönetim ve Ekonomi Araştırmaları Dergisi, 19.
Udegbunam, R. I. and Eriki, P.O. 2001. “Inflation and Stock Price Behavior: Evidence from Nigerian Stock Market”. Journal of Financial Management and Analysis, 20, 14(1), 1-10.
Yeldan, A.E. 2008. “Turkey and the long decade with the IMF”. Journal of Bretton Woods Projects Finance, 48(5), 1749-1778.