https://doi.org/10.1007/s40519-020-00980-x
ORIGINAL ARTICLE
Evaluation of the relationship between serum ferritin and insulin
resistance and visceral adiposity index (VAI) in women with polycystic
ovary syndrome
Büşra Başar Gökcen1 · Yasemin Akdevelioğlu2 · Sultan Canan3 · Nuray Bozkurt3
Received: 12 April 2020 / Accepted: 30 July 2020 © Springer Nature Switzerland AG 2020 Abstract
Purpose There is a relationship between polycystic ovary syndrome (PCOS) and adipose tissue dysfunction (ADD), but this relationship is not clear. It has been recently shown that iron accumulation in adipose tissue is among the causes of adi-pose tissue dysfunction. Data on adiadi-pose tissue dysfunction in women with PCOS are insufficient. In this study, we aimed to evaluate the relationship between serum ferritin levels (iron accumulation biomarker) and visceral adiposity index (an indicator of adipose tissue dysfunction).
Methods The study is a case–control study. Women with diagnosed PCOS with 2003 Rotterdam Diagnostic Criteria (n = 40) were compared with non-PCOS group (n = 40). In this study, the cholesterol ratios, the homeostatic model evaluation index for insulin resistance (HOMA-IR) and the quantitative insulin sensitivity control index were calculated using biochemical parameters, and the visceral adiposity index (VAI) and the lipid accumulation product (LAP) were calculated using both anthropometric and biochemical parameters. In this study, insulin resistance was evaluated by HOMA-IR and adipose tissue dysfunction was evaluated by VAI index.
Results According to the results of this study, women with PCOS have a worse metabolic status than women without PCOS. However, this has been shown only in overweight and obese women, not in women with normal weight.
Conclusion As a result, the presence of obesity in women with PCOS exacerbates metabolic status.
Level of evidence Level V, cross-sectional descriptive study.
Keywords Ferritin · Obesity · Insulin resistance · Polycystic ovary syndrome · Visceral adiposity index
Introduction
Polycystic ovary syndrome (PCOS) is a common metabolic, endocrine and reproductive disorder that affects women of reproductive age. The prevalence of PCOS varies between 6 and 20% depending on the diagnostic criteria used [1]. There are different diagnostic criteria for PCOS which have been
set by three organizations: the National Institutes of Health/ National Institute of Child Health and Human Disease (NIH/ NICHD) in 1990; the European Society for Human Repro-duction and Embryology/American Society for Reproduc-tive Medicine (ESHRE/ ASRM) in 2003 (referred to as the Rotterdam criteria) and the Androgen Excess and PCOS Society (AE-PCOS) in 2006 [2, 3]. According to NIH diag-nostic criteria, with the exclusion of other disorders associ-ated with androgen excess, PCOS has been identified not only by clinical and/or biochemical findings of hyperan-drogenism, but also by the presence of chronic anovulation [4]. Later, with the discovery that ovarian morphology is an important key component for diagnosis, in 2003, under the sponsorship of ESHRE and ASRM, “polycystic ovar-ian morphology in ultrasonography” was added to the NIH diagnostic criteria and added to the literature as Rotterdam Criteria [5]. According to the Rotterdam Criteria, with the exclusion of other disorders associated with androgen
* Büşra Başar Gökcen [email protected]
1 Department of Nutrition and Dietetics, Fethiye Faculty
of Health Sciences, Muğla Sıtkı Koçman University, Çalıca Mevkii, 48300 Fethiye/Muğla, Turkey
2 Department of Nutrition and Dietetics, Faculty of Health
Sciences, Gazi University, Ankara, Turkey
3 Department of Obstetrics and Gynecology, School
excess, the existence of two criteria of clinical and/or bio-chemical findings of hyperandrogenism, oligo/anovulation, and polycystic ovarian morphology in ultrasonography is sufficient for the diagnosis of PCOS [6]. Finally, according to the AE-PCOS diagnostic criteria, with the exclusion of other disorders associated with androgen excess, the clini-cal and/or biochemiclini-cal findings of hyperandrogenism and the coexistence of ovarian dysfunction (polycystic ovarian morphology and/or oligo or anovulation in ultrasonography) are considered sufficient for diagnosis [7].
PCOS is a syndrome characterized by clinical (acne, hirsutism, alopecia) and/or biochemical findings of hyper-androgenism and features of anovulation (amenorrhea, oligomenorrhea, irregular menstrual cycle) along with the appearance of polycystic ovaries on ultrasonography [8]. In addition to these gynecological symptoms, this syn-drome presents itself with many metabolic disorders such as increased visceral adiposity, insulin resistance, impaired glucose tolerance, type 2 diabetes, dyslipidemia, chronic low-grade pro-inflammatory condition, and cardiovascular diseases [9]. Especially among these metabolic disorders, insulin resistance and hyperinsulinemia are common in women with PCOS [10]. In order for insulin to act, it is necessary to bind to its specific receptor in the cell mem-brane, followed by tyrosine phosphorylation of the receptor [11]. However, there are abnormalities in the cellular mecha-nisms of the receptor functions in women with PCOS [12]. In women with PCOS, serine phosphorylation of the beta subunit of the insulin receptor and the insulin receptor sub-strate is increased, and thus, trozin autophosphorylation of the insulin receptor is inhibited. As a result, a post-receptor change occurs that prevents signaling pathways bound to the insulin receptor substrate. Serine phosphorylation of the beta subunit of the receptor causes insulin resistance, and serine phosphorylation of the enzyme p450c17 also causes hyper-androgenism [13, 14]. That is, insulin resistance and hyper-androgenism can be independently involved in the pathogen-esis of PCOS. In addition, the metabolic and gynecologic features of PCOS form a vicious cycle with each other and sometimes some nutritional factors are involved in this cycle. Insulin resistance, which is at the center of this cycle, is thought to play an important role in the pathogenesis of PCOS by contributing to hyperandrogenism [15]. Insu-lin resistance and compensatory hyperinsuInsu-linemia cause hyperandrogenism by increasing the synthesis of androgen in adipose tissue and ovarian. In addition, hyperinsulinemia causes decreased hepatic synthesis of sex hormone-binding globulin (SHBG), thereby increasing levels of circulating free androgens [12, 16, 17]. DHT (dihydrotestosterone), which is formed by the peripheral conversion of testoster-one, triggers insulin resistance by affecting the functions of pancreatic β-cells and causes hypertrophy and lipotoxic-ity in adipocytes [18]. Hyperandrogenism also triggers the
inflammatory process (chronic low-grade inflammation) in PCOS. However, the pro-inflammatory/inflammatory cytokine imbalance in PCOS also causes hyperandrogen-ism dependent of abdominal obesity and insulin resistance, forming a vicious cycle [19, 20]. On the other hand, nutrient-induced inflammation can induce ovarian androgen produc-tion even in the absence of abdominal obesity and insulin resistance in PCOS [19, 21]. Especially, dietary carbohydrate (glucose) induces oxidative stress to stimulate the inflamma-tory response even in the absence of excess adiposity and insulin resistance. Inflammation-induced hyperandrogenism triggers insulin resistance and compensatory hyperinsuline-mia which in turn stimulate further androgen synthesis. This vicious cycle exacerbates the symptoms of PCOS [22]. In this vicious circle in the pathogenesis of PCOS, nutrition can be seen as an additional component in defining a ‘deadly quartet’ of metabolic risk factors along with insulin resist-ance, hyperandrogenism and low-grade inflammation [21]. Obesity, a factor worsening the metabolic and gynecological symptoms of this vicious circle, exacerbates hyperandrogen-ism and menstrual irregularities, which are key features in PCOS [23]. In contrast, body weight loss and maintenance strategies improve all clinical and biochemical characteris-tics of women with PCOS. Therefore, lifestyle changes (diet, physical activity and behavior changes) and weight mainte-nance are recommended from the beginning of treatment of women with PCOS [24]. Especially in obese and overweight women with PCOS, it is recommended to include a nutrition program that will lose at least 5–10% of their body weight in initial treatment [25]. However, it is still inconclusive what is the most effective dietary model that should be adopted to lose weight in PCOS [26]. It is suggested that alternative dietary strategies adapted for insulin resistance and type 2 diabetes may be superior in PCOS [27]. Among the different nutritional strategies, Mediterranean Diet is accepted as a health-promoting dietary pattern. Barrea et al. found a direct relationship between PCOS and the adherence to Mediter-ranean diet. Some foods in this diet show the therapeutic effects by reducing the inflammatory status [26].
The similarity of the metabolic syndrome and the compli-cations associated with PCOS have led to the hypotheses that metabolic disorders in PCOS may be caused by adipose tis-sue dysfunction (ADD) [28]. There are two types of body fat distribution in adipose tissue: upper body (android or cen-tral) and lower body (gynoid or peripheral). The distribution of fat in women’s adipose tissue is normally gynoid [29]. However, the distribution of fat mass in postmenopausal women varies from gynoid pattern to android pattern [30]. In addition, even in the fertile period, women with PCOS may tend to have central/android-type fat accumulation. This change is definitively or relatively related to androgen excess in PCOS [31]. The relationship between androgens and body fat distribution led to the hypothesis that androgens have
direct effects on the differentiation of adipocytes [32]. In addition to hyperandrogenism in PCOS, the reduction of catecholamine-induced lipolysis in adipose tissue cells may be associated with hypertrophy in adipose tissue cells. In PCOS, adipose tissue dysfunction is characterized by hyper-trophic adipocytes which are more susceptible to fibrosis, apoptosis, inflammation and release of free fatty acids [33,
34]. Furthermore, the secretion of adipose tissue-specific adipokine and pro-inflammatory cytokines is impaired in PCOS [28]. ADD acts as a mediator between abdominal obesity, inflammation, and insulin resistance accompany-ing PCOS as it causes an increase in the release of pro-inflammatory adipocytokines and a decrease in the release of anti-inflammatory adipocytokines such as adiponectin [35].
Although there is known to be an association between PCOS and adipose tissue dysfunction (ADD), the underlying mechanisms are not fully understood and many hypotheses have been proposed [33]. This study is planned with the knowledge that iron has an effect on adipose tissue func-tions and that serum ferritin levels are higher in women with PCOS than the healthy control group [35–39]. We thought that there may be a relationship between ferritin and adipose tissue dysfunction in women with PCOS. In explaining this relationship, the knowledge that adipose tissue dysfunction is characterized by adipose tissue-specific insulin resist-ance and altered adipokine release is fundamental. It is well known that there is a relationship between serum ferritin and insulin resistance [40, 41]. Although this relationship is not fully understood, a reduced ability to burn carbohy-drates and altered adipose tissue functions have been sug-gested as possible mechanisms according to The European Association for the Study of the Liver (EASL) [42]. Apart from this, many hypotheses have been proposed. First, the catalytic effects of iron induce lipid peroxidation, causing inhibition of insulin internalization and actions, and result in hyperinsulinemia and insulin resistance [38, 39]. Second, excess body iron can affect insulin secretion and signaling [43]. Iron in pancreatic β cell is important for normal insu-lin secretion, either by producing reactive oxygen species (ROS) or by maintaining ATP production in the electron transport chain (ETC) in mitochondria. β cell produces hep-cidin, which is secreted out of the cell along with insulin. Hepcidin inhibits iron secretion via ferroportin. That is, in the presence of hyperinsulinemia, iron begins to accumulate in the β cell. Iron accumulation causes β-cell toxicity due to ROS formation via the Fenton reaction. ROS reduces ATP production in the ETC by causing mitochondrial dysfunc-tion, leading to impaired insulin secretion [44]. In addition to β cell, iron accumulation in adipocytes also leads to a decrease in adipogenic capacity, disrupts insulin signaling and adipocyte differentiation and in addition, changes the expression of adipose tissue-specific genes and the release of adipokine (for example, increasing the release of resistin)
[41, 45]. Finally, body iron increases the rate of lipolysis of adipose tissue triacylglycerol stores, thereby increasing the level of circulating free fatty acids (FFAs), thereby trigger-ing tissue-specific insulin resistance [46, 47]. As a result, many markers in iron metabolism are associated with adi-pocyte insulin resistance (defined by the product of fasting insulin and nonesterified fatty acids), an indicator of adipose tissue dysfunction [48, 49].
The relationship between ferritin and adipose tissue dys-function can also be explained by altered adipokine levels. Adipose tissue is an endocrine organ that secretes many hormones and signaling molecules, collectively called adi-pokine. These adipokines contribute to insulin resistance with their either pro-inflammatory or inflammatory prop-erties [50]. Adipose tissue is also an organ in which iron regulating proteins (ferritin, hepcidin) are expressed and is the main target organ where iron shows metabolic effects [49, 51]. The investigation of the relationship between serum adipokines and ferritin has been reported to be interesting [52]. Adiponectin is the most studied adipokine for this relationship. There are studies showing an inverse relation-ship between ferritin and adiponectin [49, 53–55]. Iron is required for the oxidation of lipids in the electron transport chain. As it is known, adiponectin also increases fatty acid oxidation, but its levels are reduced by iron [56]. Iron has an inhibitory effect on adiponectin production, secretion and transcription via the class O of Forkhead box transcription factors (FOXO1)-mediated repression [41, 54]. It is thought that this inhibitory effect may be a compensatory mechanism to protect the organism from additional oxidative stress. That is, iron reduces fatty acid oxidation by reducing adiponectin levels and decreased adiponectin levels may be the cause of adipose tissue dysfunction [56]. As a result, it has been sug-gested that high levels of serum ferritin may be an indicator of adipose tissue dysfunction [36].
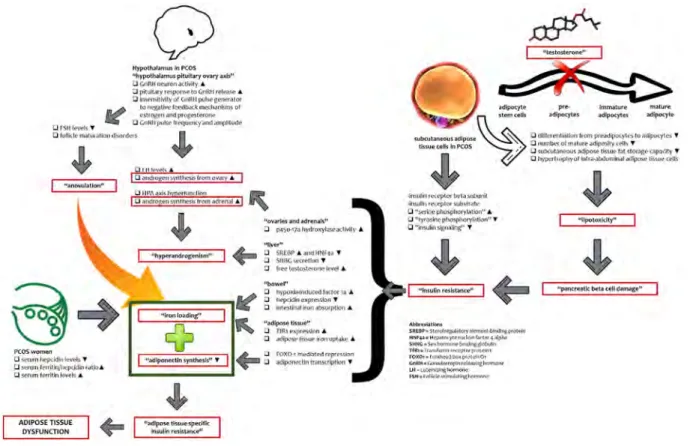
The possible mechanism among metabolic conditions associated with PCOS, body iron accumulation, and adi-pose tissue dysfunction is given in Fig. 1 [10, 13, 14, 18,
51, 57–71].
This study was planned and conducted to evaluate the relationship between serum ferritin levels and adipose tis-sue dysfunction (visceral adiposity index) in addition to the relationship between adipose tissue dysfunction and some metabolic disorders accompanying disease in PCOS and control subjects with similar age and BMI.
Materials and methods
Study populations
This is a cross-sectional case–control study aimed to evaluate the relationship between serum ferritin levels and
adipose tissue dysfunction (measured by visceral adiposity index) along with the relationship between adipose tissue dysfunction and some metabolic disorders accompany-ing disease. The study was carried out between April and November 2017 at Gazi University Medical School Hospi-tal, at the Clinic of Obstetrics and Gynecology and Repro-duction Treatment Center. The PCOS group included 40 women, between the ages of 18 and 45, who were diag-nosed with PCOS with the 2003 Rotterdam Diagnostic Criteria. The non-PCOS group, however, included 40 women, between the ages of 18 and 45, who were not diagnosed with PCOS with the 2003 Rotterdam Diagnos-tic Criteria and whose menstrual cycles were regular. For the non-PCOS group, women with irregular menstrual cycles, the appearance of polycystic ovaries on ultrasound or the clinical and biochemical signs and symptoms of hyperandrogenism have been excluded from the study. In addition, for the PCOS and non-PCOS group, women using any medication which affects the serum sex hor-mone profile and body composition as well as depression medication over the last three months; women undergoing pregnancy, lactation or menopause; women with diabetes mellitus or hematological or iron metabolism pathologies; and women with other conditions leading to hyperandro-genism and ovulation dysfunction (such as hypothyroid-ism, hyperprolactinemia, Cushing’s syndrome, congenital
adrenal hyperplasia, androgen secretory tumors) have been excluded from the study.
Assessment of participants
Anthropometric measurements [body weight (kg), height (cm), waist circumference (cm), hip circumference (cm)] body composition analysis [body fat percentage (%), and lean body mass (kg)] of all women participating in the study were performed by the researcher. Body weight measure-ments and body composition analyses of all women were performed using the Tanita BC 532 (Tanita Co., Ltd., Dong-guan, China) portable body analyzer [bioelectrical imped-ance device (BIA)] with light clothing after 8 h of fasting. Height measurement was performed with a stadiometer. At this time, the head should be placed in the Frankfurt plane and participants should breathe deeply with their feet adja-cent at the heels, with the back, hips, and heels touching the wall [72].
The BMI values of all women were calculated with the formula body weight (kg) ÷ [length (m)2] [73]. According to
the BMI classification made by WHO; a BMI value below 18.50 kg/m2 is “lean”, 18.50–24.99 kg/m2 is within the
range of “normal”, 25.00–29.99 kg/m2 is within the range
of “overweight”, 30.00–34.99 kg/m2 is within the range
of “1st degree obese”, 35.00–39.99 kg/m2 in the range of
Fig. 1 The possible mechanism among metabolic conditions associated with PCOS, body iron accumulation, and adipose tissue dysfunction
UJSlll~ls•
0
tfypotti.lam1n rn P(O$"ltrpotlyl.un1,15 p!tuibry ov;ary ••~"
U r.nRH ncuron~tiYity •
g
~~~;~;~~::·
~=
;
l:i> iwgalM! il?t!db,xk 1oedt.1nlsms ol l-s110,b'fll .-td ptogelt!f~
U (inMlt 111;kr t.f!f)tltnty,indollfl(llllufl~
lt;tlli~I~ n1rot!1.A1.,fbuJhofck,;.
PCOS"""'""
UK1lffll~ld1;i~•
• Sffllfll ll!'fr1tln,'ht.tpddin,o11b&
•~mi ~r\LlnM~ti•
ADIPOSE TISSUE
DYSFUNCTION
.
•
111-'d'f'OM. UUuHpttitk
l'lliUl!n,~!l<e'1
"'ovarle:l .-rid adrc~I,.''
:J p.1~0-17a hvdroxy~aclMly A.
...
.J ~tll P&:andHNto"Y .:J 'SltR C ~'f'
!:J !rttt\oJ,o'l.1,~of1t"k'~A. Mbow~f'
t,yPQ>Jn.lo<luteolllMIQf Ir. .A.
:J tlepeklinHp:1~\lon• :J •tt~lnii!iron IDSQ(J>lloo A 1":adl~ tis.~•"' ..J TIShwKJl"•°"""1A :] _.di!JOWl~iui11~olll-• 1'())(0 r m,,~tPd "'fK'"'r.br1 -ldlpo1w,ctl11 t~r~lol\ •
~
~
ldipocyte p,-e. fmm1t1.1rt: n,1.l11r~stm, <t:ll!i ~ ~fpo<ytes 2dipoqte,
ru==~==~=f:
~
1 Q=~~i::.::~=r~t~lo
~ipv(JtO
'f" •<u~til~ ~ ~l~ f ; l \ il\ ' I Q ~ ~ •'f
,lmidNl 1("1..t'J'h:n l~IU1.1l,11,1111it sil"'-.11b1 ,11'1..q'.IIDf ~ \ltJ,h•
"M:1ini:pl~Jli1f")l,tl10n••·
'1iY'l)Sint~l,,lkitl'''I' C -...,>ll..,f"'f' y
✓. 0 h)'pe,f11t,pHri.ll i . t t ~ T ilndll «f>eose lWitH! Cf'lls"
~ 1 1 : . V f ~ SIU.IIP'•3tN~l~a,'~~.fll'llC•"1 ttt,1F4,a11<1~ • N y r • ~ f ~ e 1 1 1 • ~ ~ ~ aS c ' J l . k l m W ! M ~ ~ Tffh•tr~lin!lt•~Nr,nJl,\tll ,¢-.xQ, • l~!t-!~J DO!lPf\.11W1'10, W.flll•t. ... w l t l f ~ ~ ~
~~
~,=hr_
“second degree obese”, and 40 kg/m2 and above is defined as
“third degree obese” [74]. In this study, the PCOS and non-PCOS groups were divided into two groups as BMI < 25 kg/ m2 (normal) and ≥ 25 kg/m2 (overweight or obese). The
waist circumference was measured with a flexible but non-stretchable tape passing through the midpoint of the distance between the lowest rib and the crystalline bone according to the WHO recommendation [75]. The hip circumference was measured as the widest area of the hip with the aid of a non-stretching tape, standing side by side with the legs of the participant adjacent. Waist/hip ratios were calculated using these measurements.
Body fat mass index (BFMI) (kg/m2) was calculated by
dividing body fat mass by the square of the height [body fat mass (kg) ÷ height (m)2]. Lean body mass index (FFMI) (kg/
m2) was calculated by dividing lean body mass by the square
of the height [lean body mass (kg) ÷ height (m)2] [76].
On the day of the questionnaire, a blood sample was taken from the participants after fasting for at least 8 h with the consent of the physician. The analysis of blood in terms of biochemical parameters [fasting blood glucose (mg/dL), serum insulin (μIU/mL), serum ferritin (ng/mL), serum iron and iron binding capacity (pg/mL), HDL cholesterol (mg/ dL), LDL cholesterol (mg/dL), total cholesterol (mg/dL), triglyceride (mg/dL)] required for the study was performed by purchasing services from the Biochemistry Laboratory of Gazi University Medical Faculty Hospital. Using these bio-chemical parameters, homeostatic model evaluation index for insulin resistance (HOMA-IR), the quantitative insulin sensitivity control index (QUICKI), lipoprotein ratios, lipid accumulation product index (LAP), and visceral adiposity index (VAI) were calculated for all participants.
HOMA-IR was calculated using the equation [fasting insulin levels (μIU/mL) × fasting blood glucose levels (mg/ dL) ÷ 405] [77]. Although there is no universal HOMA-IR cut-off value for insulin resistance [78], Turkey Endocri-nology and Metabolism Society (2009), it is defined as HOMA-IR and insulin resistance is ≥ 2.7 [79]. QUICKI was calculated using the equation “1/log [fasting serum insulin levels (mU/L)] + log [fasting blood glucose levels (mg/dL)] to evaluate insulin sensitivity [9]. The total cholesterol/HDL cholesterol ratio, the LDL/HDL cholesterol ratio, and the triglyceride (TAG)/HDL cholesterol ratio were calculated as lipoprotein ratios [80, 81].
The visceral adiposity index (VAI), considered to be a marker of visceral adipose dysfunction, is a gender-specific mathematical model which includes both anthropometric parameters [(BMI (kg/m2) and waist circumference (cm)]
and functional parameters [serum triglyceride (mmol/L) and HDL cholesterol (mmol/L) levels] [9].VAI index showed a strong association with both insulin sensitivity, evaluated by the hyperinsulinemic-euglycemic clamps technique and visceral adipose tissue, measured by the magnetic resonance
imaging (MRI) [82]. Visceral adipose dysfunction is tradi-tionally measured by body mass index (BMI), waist circum-ference (WC) and waist–hip ratio (WHR). However, BMI is not considered as a good marker since it does not include factors affecting visceral adipose mass and functions. WC is also considered limited marker as it cannot distinguish between subcutaneous and visceral fat area. Visceral adipose tissue can also be evaluated with Magnetic resonance imag-ing (MRI) and Computed tomography (CT) scan, but both of them are neither easily accessible nor cheap [83]. Therefore, it was planned to use the VAI index for the evaluation of adipose tissue dysfunction in this study. In this study, this index value was calculated using the equation proposed for women [84].
The lipid accumulation product (LAP) was first described by Kahn in 2005 as an “index based on the combination of waist circumference (cm) and fasting serum triglyceride levels (mmol/L)” [85]. LAP index was calculated using the equation (waist circumference (cm)—58) × fasting triglyc-eride levels (mmol/L) [9].
Statistical analysis
The SPSS for Windows version 20.0 (SPSS, Inc.; Chicago, USA) was used in performing the statistical analyses. Arith-metic mean (x̄) and standard deviation (SD) values were calculated for quantitative variables. In this study, correla-tion analyses were performed to examine the relacorrela-tionship between two quantitative variables. To evaluate the perfor-mance of some anthropometric data and some indexes in the diagnosis of insulin resistance in women with PCOS, ROC curve analyses were performed. All p values of less than 0.05 were considered statistically significant.
Before starting the study, the sample size calculation was made by a statistician in the 95% confidence interval. After the study was completed, power analysis was carried out once again. The post-power value was obtained as 72% with 95% confidence and 0.80 effect size.
Results
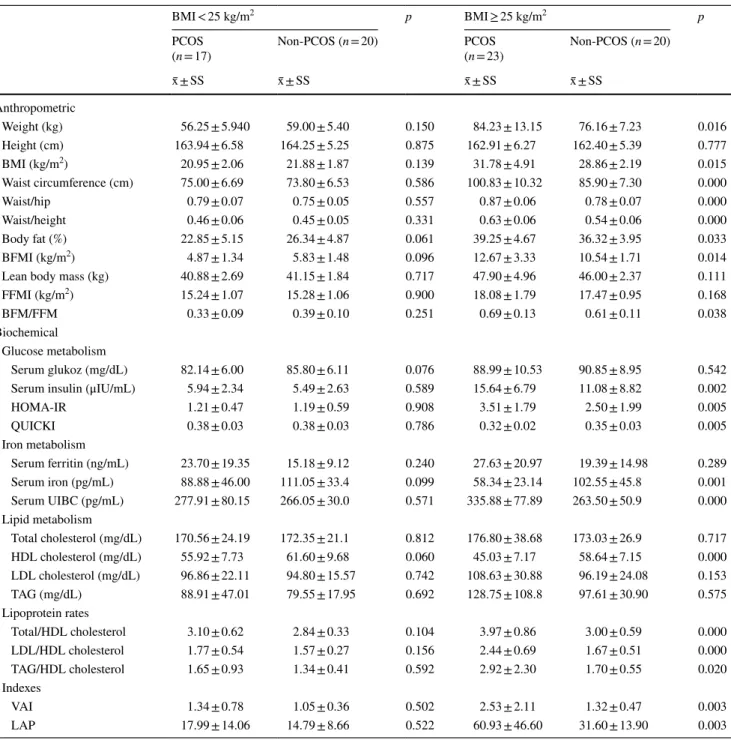
Forty women with and without PCOS participated in this study. Comparisons of some biochemical and anthropo-metric parameters in women with normal body weight and overweight/obese PCOS along with non-PCOS are given in Table 1. The mean age of women with PCOS was 25.25 ± 4.79 and the mean age of women in the non-PCOS group was 24.83 ± 3.17 (p > 0.05). The mean BMI was
VAI = [waist circumference ÷ (36.58 + 1.89 × BMI)] × (serum triglyceride ÷ 0.81) × (1.52 ÷ serum HDL)
27.23 ± 6.60 in women with PCOS and 25.37 ± 4.07 kg/ m2 in the non-PCOS group (p > 0.05). There was no
sta-tistically significant difference in body weight (kg), height (cm), BMI (kg/m2), waist circumference (cm), hip
circum-ference (cm), waist/hip ratio, and waist/height ratio between normal weight PCOS and non-PCOS women (p > 0.05). In contrast, overweight/obese women with PCOS had higher body weight, BMI, waist circumference, waist/hip ratio, and waist/height ratio compared to overweight/obese women with non-PCOS (p < 0.05). There was no statistically signifi-cant difference in terms of biochemical parameters related
to glucose, iron and lipid metabolism, lipoprotein ratios and VAI, and LAP indexes (p > 0.05). In contrast, overweight/ obese women with PCOS had higher fasting serum insulin levels, HOMA-IR, serum iron binding capacity, lipoprotein ratios, in addition to VAI and LAP index values, while they had lower QUICKI, serum iron, and HDL cholesterol lev-els compared to overweight/obese women with non-PCOS (p < 0.05).
The correlation of VAI and LAP with serum levels of glucose, insulin and ferritin in women with PCOS is given in Table 2. There was a positive correlation between serum
Table 1 Comparison of some biochemical and anthropometric parameters in PCOS and non-PCOS women according to BMI
BMI < 25 kg/m2 p BMI ≥ 25 kg/m2 p
PCOS
(n = 17) Non-PCOS (n = 20) PCOS(n = 23) Non-PCOS (n = 20)
x̄ ± SS x̄ ± SS x̄ ± SS x̄ ± SS Anthropometric Weight (kg) 56.25 ± 5.940 59.00 ± 5.40 0.150 84.23 ± 13.15 76.16 ± 7.23 0.016 Height (cm) 163.94 ± 6.58 164.25 ± 5.25 0.875 162.91 ± 6.27 162.40 ± 5.39 0.777 BMI (kg/m2) 20.95 ± 2.06 21.88 ± 1.87 0.139 31.78 ± 4.91 28.86 ± 2.19 0.015 Waist circumference (cm) 75.00 ± 6.69 73.80 ± 6.53 0.586 100.83 ± 10.32 85.90 ± 7.30 0.000 Waist/hip 0.79 ± 0.07 0.75 ± 0.05 0.557 0.87 ± 0.06 0.78 ± 0.07 0.000 Waist/height 0.46 ± 0.06 0.45 ± 0.05 0.331 0.63 ± 0.06 0.54 ± 0.06 0.000 Body fat (%) 22.85 ± 5.15 26.34 ± 4.87 0.061 39.25 ± 4.67 36.32 ± 3.95 0.033 BFMI (kg/m2) 4.87 ± 1.34 5.83 ± 1.48 0.096 12.67 ± 3.33 10.54 ± 1.71 0.014
Lean body mass (kg) 40.88 ± 2.69 41.15 ± 1.84 0.717 47.90 ± 4.96 46.00 ± 2.37 0.111
FFMI (kg/m2) 15.24 ± 1.07 15.28 ± 1.06 0.900 18.08 ± 1.79 17.47 ± 0.95 0.168
BFM/FFM 0.33 ± 0.09 0.39 ± 0.10 0.251 0.69 ± 0.13 0.61 ± 0.11 0.038
Biochemical Glucose metabolism
Serum glukoz (mg/dL) 82.14 ± 6.00 85.80 ± 6.11 0.076 88.99 ± 10.53 90.85 ± 8.95 0.542
Serum insulin (μIU/mL) 5.94 ± 2.34 5.49 ± 2.63 0.589 15.64 ± 6.79 11.08 ± 8.82 0.002
HOMA-IR 1.21 ± 0.47 1.19 ± 0.59 0.908 3.51 ± 1.79 2.50 ± 1.99 0.005 QUICKI 0.38 ± 0.03 0.38 ± 0.03 0.786 0.32 ± 0.02 0.35 ± 0.03 0.005 Iron metabolism Serum ferritin (ng/mL) 23.70 ± 19.35 15.18 ± 9.12 0.240 27.63 ± 20.97 19.39 ± 14.98 0.289 Serum iron (pg/mL) 88.88 ± 46.00 111.05 ± 33.4 0.099 58.34 ± 23.14 102.55 ± 45.8 0.001 Serum UIBC (pg/mL) 277.91 ± 80.15 266.05 ± 30.0 0.571 335.88 ± 77.89 263.50 ± 50.9 0.000 Lipid metabolism Total cholesterol (mg/dL) 170.56 ± 24.19 172.35 ± 21.1 0.812 176.80 ± 38.68 173.03 ± 26.9 0.717 HDL cholesterol (mg/dL) 55.92 ± 7.73 61.60 ± 9.68 0.060 45.03 ± 7.17 58.64 ± 7.15 0.000 LDL cholesterol (mg/dL) 96.86 ± 22.11 94.80 ± 15.57 0.742 108.63 ± 30.88 96.19 ± 24.08 0.153 TAG (mg/dL) 88.91 ± 47.01 79.55 ± 17.95 0.692 128.75 ± 108.8 97.61 ± 30.90 0.575 Lipoprotein rates Total/HDL cholesterol 3.10 ± 0.62 2.84 ± 0.33 0.104 3.97 ± 0.86 3.00 ± 0.59 0.000 LDL/HDL cholesterol 1.77 ± 0.54 1.57 ± 0.27 0.156 2.44 ± 0.69 1.67 ± 0.51 0.000 TAG/HDL cholesterol 1.65 ± 0.93 1.34 ± 0.41 0.592 2.92 ± 2.30 1.70 ± 0.55 0.020 Indexes VAI 1.34 ± 0.78 1.05 ± 0.36 0.502 2.53 ± 2.11 1.32 ± 0.47 0.003 LAP 17.99 ± 14.06 14.79 ± 8.66 0.522 60.93 ± 46.60 31.60 ± 13.90 0.003
insulin levels and VAI, and between serum glucose and insu-lin levels and LAP in women with PCOS (p < 0.05).
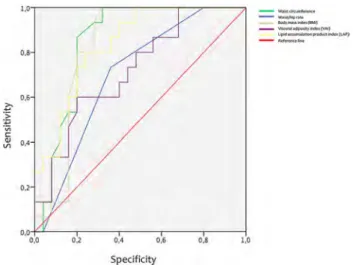
Cut-off values of VAI, LAP and some biochemical and anthropometric parameters in the determination of insulin resistance in women with PCOS are given Fig. 2. AUC, 95% CI, SS (%), SP (%) and cut-off values of VAI, LAP and some biochemical and anthropometric parameters in determining insulin resistance in women with PCOS are given Table 3. In
women with PCOS, the cut-off value of VAI and the cut-off value of LAP were found to be 1.65 and 32.97, respectively.
Discussion
Anthropometric measurements are widely used research tools to assess metabolic risk in women with PCOS [86]. In our study, body weight, BMI, waist circumference, and waist/hip ratios were found to be higher in women with PCOS than in non-PCOS women. However, a statistically significant result was found only in the overweight/ obese group (p < 0.05). In literature, body weight, BMI values, and waist circumference findings of women with PCOS are con-tradictory. In some studies anthropometric measurements did not show significant differences between PCOS and non-PCOS women [76, 87]; while, some studies showed signifi-cant differences similar to our study [88, 89]. In our study, body fat percentages were found to be higher in women with PCOS than in non-PCOS women. However, a statistically significant result was found only in the overweight/obese group (p < 0.05). In literature, in most studies comparing the body composition of women with PCOS and the non-PCOS group, no statistically significant differences were found between these two groups in terms of body fat percentage, lean body mass, and percentage [90, 91]. However, signifi-cant differences were found in some studies similar to our study [76, 92]. Higher body weight and waist circumference along with body fat percentage in women with PCOS can be explained by a decrease in postprandial thermogenesis and basal metabolic rate, impaired gastrointestinal hormone and appetite regulation, insulin resistance, hyperandrogenism, reduced physical activity, and reduced meal frequency. In a study, it was also found that obese women with PCOS had lower postprandial thermogenesis than women with BMI in the matched (obese/lean) PCOS women population. In a study, it was also found that obese women with PCOS had lower postprandial thermogenesis than lean women with PCOS. Hyperandrogenism may also cause weight gain by triggering appetite and bulimic behavior in women with PCOS [93, 94].
In our study, insulin resistance (HOMA-IR) was found to be higher in women with PCOS than in non-PCOS women.
Table 2 The correlation of VAI and LAP with serum levels of glu-cose, insulin and ferritin in women with PCOS
Pearson correlation coefficient is used to investigate the relationship between two quantitative variables with normal distribution. Spear-man correlation coefficient is used to investigate the relationship between two quantitative variables where at least one variable does not have a normal distribution
Variables VAI LAP
r p r p
Serum glucose (mg/dL) 0.305 0.056 0.368 0.020 Serum insulin (μIU/mL) 0.504 0.001 0.721 0.000 Serum ferritin (ng/mL) 0.270 0.092 0.257 0.109
Fig. 2 Cut-off values of VAI, LAP and some biochemical and anthro-pometric parameters in the determination of insulin resistance in women with PCOS
Table 3 AUC, 95% CI, SS (%), SP (%) and cut-off values of VAI, LAP and some biochemical and anthropometric parameters in determining insulin resistance in women with PCOS
AUC Area under the ROC curve, CI confidence interval, SS sensitivity, SP specificity
Variables (n = 40) AUC %95 CI p SS (%) SP (%) Cut-off
Waist circumference (cm) 0.837 0.729 0.972 0.000 86.7 80.0 91 Waist/hip 0.699 0.536 0.861 0.037 73.3 64.0 0.85 BMI (kg/m2) 0.825 0.691 0.960 0.001 93.3 72.0 25.4 VAI 0.721 0.561 0.881 0.020 60.0 76.0 1.65 LAP 0.851 0.716 0.958 0.000 80.0 76.0 32.97
-
---
=--=--,iMI
-
""'""'~-~
~__,_.,_.Wl>ti.,,1)1-
---SpecificityHowever, a statistically significant result was found only in the overweight/obese group (p < 0.05). Similar to our study, Durmuş et al. it was shown that women with PCOS have higher HOMA-IR [95]. To achieve insulin action in a healthy metabolism, it must bind to its specific receptor in the cell membrane and phosphorylation of tyrosine. Interest-ingly, however, serine phosphorylation of the insulin recep-tor occurs in women with PCOS, resulting in post-receprecep-tor abnormalities in insulin action [13].
In addition to insulin resistance, dyslipidemia is one of the common metabolic abnormalities associated with PCOS. In our study, no significant differences were found between normal weight PCOS and non-PCOS groups in terms of serum lipid profiles (total cholesterol, HDL cholesterol, LDL cholesterol, and triglyceride) (p > 0.05). On the other hand, significant differences were found only in HDL choles-terol levels between overweight/obese PCOS and non-PCOS groups. Women with overweight/obese PCOS have lower HDL cholesterol levels (p < 0.05). In addition to study [96] showing no statistically significant differences in serum lipid profiles between PCOS and non-PCOS women, there are also studies showing that women with PCOS have higher tri-glyceride levels [97] and lower HDL cholesterol levels [98]. The visceral adiposity index (VAI) is an indicator of adi-pose tissue dysfunction. It has been suggested that visceral adiposity induces metabolic and endocrine abnormalities that are essential to the progression of PCOS, and therefore assessment of VAI, independent of general obesity, may be important for future therapeutic strategies of PCOS [99]. In our study, VAI was not significantly different from the nor-mal weight PCOS group and the non-PCOS group. However, it was found to be higher in the overweight/obese PCOS group than in the non-PCOS group (p < 0.05). Durmus et al. found similar results in our study [95].
The lipid accumulation index (LAP) is presented as an inexpensive research tool to monitor and estimate total body fat accumulation [85]. In our study, the LAP value was found to be significantly higher only in the overweight/obese PCOS group compared to the non-PCOS group (p < 0.05). Macut et al. in their study found similar results to our study [100].
Many molecules involved in iron metabolism are identi-fied as potential biomarkers for PCOS [101]. One of these, ferritin, is the main iron-storing protein in maintaining iron homeostasis, and serum ferritin levels are widely used in the clinic routinely as an indicator of body iron stores [37]. In our study, it was found that women with normal weight and overweight/obese PCOS had higher serum ferritin lev-els. However, this was not statistically significant (p > 0.05). Similar to the results of our study in literature [38], there are no differences in the serum ferritin levels between PCOS and non-PCOS groups. However, there are studies [102, 103] showing that women with PCOS have significantly higher serum ferritin levels than non-PCOS women.
Escobar et al. found that overweight/obese women with PCOS had higher serum ferritin levels than the non-PCOS women group. However, there was no statistically significant difference between normal weight PCOS and non-PCOS women [104]. Factors contributing to potential iron over-load in women with PCOS include the iron protective effect of reduced menstrual losses associated with oligomenor-rhea and/or amenoroligomenor-rhea, obesity and inflammation, insulin resistance, increased hyperandrogenism-induced erythro-poiesis, decreased hepcidin expression, and increased Hp2/ Hp2 genotype [105]. Insulin resistance and hyperinsulinemia stimulate intestinal iron absorption by increasing the activity of hypoxia-induced factor-1 and reducing hepcidin expres-sion. Through this mechanism, hyperinsulinemia contributes to increased serum ferritin levels seen in PCOS [106]. In our study, although women with PCOS had higher insulin resistance and serum insulin levels compared to non-PCOS women, no significant correlation was found between these parameters and serum ferritin levels (p > 0.05).
A study examining the relationship between serum fer-ritin and adipose tissue dysfunction in the PCOS population is not available in literature. However, a study conducted in a population with vascular disease suggested that free iron may induce adipose tissue dysfunction because of its pro-inflammatory effect on pre-adipose tissue cells [35]. In another study, it was shown that insulin resistance of adi-pose tissue cells increased by 1.38%, serum non-esterified fatty acid levels increased by 1.94 mmol/L, and that there was a 0.62% decrease in serum adiponectin levels with each 10 mg/L increase in serum ferritin levels. In conclusion, serum ferritin levels may be associated with each parameter of adipose tissue dysfunction [49]. Visceral adiposity index is accepted as an indicator of adipose tissue dysfunction in literature [99]. Therefore, VAI were used in this study to evaluate adipose tissue dysfunction in women with PCOS. In our study, no significant correlation was found between serum ferritin levels and VAI (p > 0.05). The reason for this may be the presence of protective mechanisms against iron accumulation (increase in hepcidin synthesis).
In our study, no significant correlation was found between serum ferritin levels and serum insulin levels or serum glu-cose levels and insulin resistance in women with PCOS (p > 0.05). Ko et al. found significant positive correlations between serum ferritin levels and serum insulin levels in addition to serum glucose levels and insulin resistance in obese women with PCOS [105].
In our study, the diagnostic performance of VAI and LAP indexes was evaluated to determine insulin resist-ance in PCOS. In our study, the optimal cut-off values for determining insulin resistance in women with PCOS were 25.4 kg/m2 for BMI; 91 cm for waist circumference; 0.85 for
waist/hip ratio; 1.65 for VAI index value, and 32.97 for the LAP index value. In our study, LAP has been shown to have
good diagnostic performance. Tehrani et al., found that the optimal cut-off values for determining insulin resistance in women with PCOS were 26.1 kg/m2 for BMI; 79.5 cm for
waist circumference; 0.80 for waist/hip ratio; 1.80 for VAI index value, and 33.80 for the LAP index value. In addition, in this study, it was shown that the LAP index has the highest diagnostic accuracy in determining insulin resistance [107].
Also, Abruzzese et al. reported that the VAI and LAP indexes showed similar diagnostic accuracy in determining insulin resistance and both were good markers for insulin resistance [9].
Conclusions
The aim of this study was to evaluate the relationship among concomitant metabolic conditions, body iron accumulation, and adipose tissue dysfunction in women with PCOS. In this study, it was found that women with PCOS (overweight/ obese) had higher insulin resistance and lower HDL choles-terol than non-PCOS women. In parallel with literature, in our study, women with PCOS had more impaired glucose and lipid metabolism. However, no significant difference was found between the serum ferritin levels in PCOS and non-PCOS group. Iron accumulation due to long and irregular menstrual cycles may occur in women with PCOS. However, the presence of protective mechanisms against iron accumu-lation (such as an increase in the synthesis of hepcidin) can prevent iron accumulation. For this reason, more detailed studies on biochemical parameters such as hepcidin, hapto-globulin, and haptoglobulin genotypes in iron homeostasis in women with PCOS will provide us with clearer mechanisms.
Although the VAI index, which is an indicator of adipose tissue dysfunction, was higher in women with PCOS, there was no correlation between the VAI and serum ferritin levels in this study. In our study, evaluation of adipose tissue dys-function only with the VAI index is an important limitation. Therefore, further studies are needed to evaluate adipose tissue-specific insulin resistance and serum adiponectin lev-els associated with adipose tissue dysfunction. Differences between our study and other studies may be caused by small sample size and race differences. In addition, further studies with larger samples and more specific markers are needed to investigate the diagnostic performances of the VAI and LAP indexes and to determine insulin resistance in women with PCOS.
“What is already known on this subject?”
There is a relationship between PCOS and adipose tissue dys-function, but this relationship is not clear. It has been sug-gested for years that adipose tissue dysfunction is the basis of metabolic disorders in women with PCOS. It has been recently
shown that iron accumulation in adipose tissue is among the causes of adipose tissue dysfunction. However, there is no study that reveals the relationship between adipose tissue dys-function and iron deposition in women with PCOS.
“What does this study add?”
There is no study on the relationship between the VAI index, which is an indicator of adipose tissue dysfunction, and serum ferritin levels, which is an indicator of iron accumulation, in the population with PCOS. In this study, it is hypothesized that there will be a relationship between them. However, the result of the study was not as expected. There was no correlation between the VAI and serum ferritin levels in this study.
Acknowledgements We would like to thank all study participants and staff in Clinic of Obstetrics and Gynecology and Reproduction Treat-ment Center at Gazi University Medical School Hospital that contrib-uted to the project.
Author contributions Should individual references be required, all authors listed have contributed sufficiently to the study to be included as authors. However, BBG and YA contributed to the writing of the article. SC and NB contributed to the collecting of the data, if one needs to mention it individually.
Funding None.
Compliance with ethical standards
Conflict of interest On behalf of all the authors, the corresponding au-thor declares that there is no conflict of interest.
Ethics approval The “Ethics Committee Approval” of the present study was taken from the Zekai Tahir Burak Women’s Health Research and Education Hospital, the Directorate of the Clinical Research Ethics Committee dated 18.04.2017 under decision number 65/2017. All procedures performed in studies involving human participants were in accordance with the ethical standards of the institution and/or national research committee and with the 1964 Helsinki Declaration and its later amendments or comparable ethical standards. The reason we got our ethics committee approval from Zekai Tahir Burak Women’s Health Research and Education Hospital is because our case group is women with PCOS and this hospital is a branch hospital working in this field. However, considering the location, the case group was taken from Gazi Hospital.
Informed consent Informed consent was obtained from all individual participants included in the study in accordance with the declaration of Helsinki.
Consent to participate The patients have signed an informed consent form indicating that they volunteered to work.
References
1. Lee I, Cooney LG, Saini S, Smith ME, Sammel MD, Allison KC, Dokras A (2017) Increased risk of disordered eating in
polycystic ovary syndrome. Fertil Steril 107(3):796–802. https ://doi.org/10.1016/j.fertn stert .2016.12.014
2. Akgül S, Düzçeker Y, Kanbur N, Derman O (2018) Do different diagnostic criteria impact polycystic ovary syndrome diagnosis for adolescents? J Pediatr Adolesc Gynecol 31(3):258–262. https ://doi.org/10.1016/j.jpag.2017.12.002
3. Sirmans SM, Pate KA (2014) Epidemiology, diagnosis, and man-agement of polycystic ovary syndrome. Clin Epidemiol 6:1–13.
https ://doi.org/10.2147/CLEP.S3755 9
4. Mohammad MB, Seghinsara AM (2017) Polycystic ovary syndrome (PCOS), diagnostic criteria, and AMH. Asian Pac J Cancer Prev 18(1):17–21. https ://doi.org/10.22034 /APJCP .2017.18.1.17
5. Ndefo UA, Eaton A, Green MR (2013) Polycystic ovary syn-drome: a review of treatment options with a focus on pharmaco-logical approaches. P T 38(6):336–355
6. The Rotterdam ESHRE/ASRM-sponsored PCOS consensus workshop group (2004) Revised 2003 consensus on diagnostic criteria and long-term health risks related to polycystic ovary syndrome. Fertil Steril 81(1):19–25. https ://doi.org/10.1016/j. fertn stert .2003.10.004
7. Azziz R, Carmina E, Dewailly D, Diamanti-Kandarakis E, Escobar-Morreale HF, Futterweit W, Janssen OE, Legro RS, Norman RJ, Taylor AE (2006) Criteria for defining polycystic ovary syndrome as a predominantly hyperandrogenic syndrome: an androgen excess society guideline. J Clin Endocrinol Metab 91(11):4237–4245. https ://doi.org/10.1210/jc.2006-0178
8. Barbosa G, de Sá LBPC, Rocha DRTW, Arbex AK (2016) Polycystic ovary syndrome (PCOS) and fertility. Open J Endocr Metab Dis 6(1):58–65. https ://doi.org/10.4236/ojemd .2016.61008
9. Abruzzese GA, Cerrrone GE, Gamez JM, Graffigna MN, Belli S, Lioy G, Mormandi E, Otero P, Levalle OA, Motta AB (2017) Lipid accumulation product (LAP) and visceral adiposity index (VAI) as markers of insulin resistance and metabolic associ-ated disturbances in young argentine women with polycystic ovary syndrome. Horm Metab Res 49(01):23–29. https ://doi. org/10.1055/s-0042-11346 3
10. Moghetti P (2016) Insulin resistance and polycystic ovary syndrome. Curr Pharm Des 22(36):5526–5534. https ://doi. org/10.2174/13816 12822 66616 07201 55855
11. Boucher J, Kleinridders A, Kahn CR (2014) Insulin receptor signaling in normal and insulin-resistant states. Cold Spring Harb Perspect Biol 6(1):a009191. https ://doi.org/10.1101/cshpe rspec t.a0091 91
12. Marshall JC, Dunaif A (2012) Should all women with PCOS be treated for insulin resistance? Fertil Steril 97(1):18–22. https :// doi.org/10.1016/j.fertn stert .2011.11.036
13. Baptiste CG, Battista M-C, Trottier A, Baillargeon J-P (2010) Insulin and hyperandrogenism in women with polycystic ovary syndrome. J Steroid Biochem Mol Biol 122(1–3):42–52. https :// doi.org/10.1016/j.jsbmb .2009.12.010
14. Bremer AA, Miller WL (2008) The serine phosphorylation hypothesis of polycystic ovary syndrome: a unifying mecha-nism for hyperandrogenemia and insulin resistance. Fertil Steril 89(5):1039–1048. https ://doi.org/10.1016/j.fertn stert .2008.02.091
15. Zhou K, Zhang J, Xu L, Wu T, Lim CED (2016) Chinese herbal medicine for subfertile women with polycystic ovarian syn-drome. Cochrane Database Syst Rev 10:CD007535. https ://doi. org/10.1002/14651 858.CD007 535.pub3
16. Cadagan D, Khan R, Amer S (2014) Female adipocyte andro-gen synthesis and the effects of insulin. Mol Genet Metab Rep 1:254–263. https ://doi.org/10.1016/j.ymgmr .2014.05.002
17. Daka B, Rosen T, Jansson PA, Råstam L, Larsson CA, Lind-blad U (2013) Inverse association between serum insulin and
sex hormone-binding globulin in a population survey in Sweden. Endocr Connect 2(1):18–22. https ://doi.org/10.1530/EC-12-0057
18. Condorelli R, Calogero A, Di Mauro M, Cannarella R, Rosta G, La Vignera S (2018) Androgen excess and metabolic dis-orders in women with PCOS: beyond the body mass index. J Endocrinol Invest 41(4):383–388. https ://doi.org/10.1007/ s4061 8-017-0762-3
19. González F (2012) Inflammation in polycystic ovary syn-drome: underpinning of insulin resistance and ovarian dys-function. Steroids 77(4):300–305. https ://doi.org/10.1016/j. stero ids.2011.12.003
20. González F, Sia CL, Stanczyk FZ, Blair HE, Krupa ME (2012) Hyperandrogenism exerts an anti-inflammatory effect in obese women with polycystic ovary syndrome. Endocrine 42(3):726– 735. https ://doi.org/10.1007/s1202 0-012-9728-6
21. Barrea L, Marzullo P, Muscogiuri G, Di Somma C, Scacchi M, Orio F, Aimaretti G, Colao A, Savastano S (2018) Source and amount of carbohydrate in the diet and inflammation in women with polycystic ovary syndrome. Nutr Res Rev 31(2):291–301.
https ://doi.org/10.1017/S0954 42241 80001 36
22. Salama AA, Amine EK, Salem HAE, Abd El Fattah NK (2015) Anti-inflammatory dietary combo in overweight and obese women with polycystic ovary syndrome. N Am J Med Sci 7(7):310–316. https ://doi.org/10.4103/1947-2714.16124 6
23. Lim SS, Davies M, Norman RJ, Moran L (2012) Overweight, obesity and central obesity in women with polycystic ovary syndrome: a systematic review and meta-analysis. Hum Reprod Update 18(6):618–637. https ://doi.org/10.1093/humup d/dms03 0
24. Kataoka J, Tassone EC, Misso M, Joham AE, Stener-Victorin E, Teede H, Moran LJ (2017) Weight management interventions in women with and without PCOS: a systematic review. Nutrients 9(9):996. https ://doi.org/10.3390/nu909 0996
25. Merviel P, Bouée S, Menard M, Le Martelot M-T, Roche S, Lelièvre C, Chabaud J-J, Jacq C, Drapier H, Beauvillard D (2017) Quelles stimulations pour quelles femmes: le syndrome des ovaires polykystiques (SOPK). Gynécologie Obstétrique Fertilité Sénologie 45(11):623–631. https ://doi.org/10.1016/j. gofs.2017.10.001
26. Barrea L, Arnone A, Annunziata G, Muscogiuri G, Laudisio D, Salzano C, Pugliese G, Colao A, Savastano S (2019) Adherence to the mediterranean diet, dietary patterns and body composition in women with polycystic ovary syndrome (PCOS). Nutrients 11(10):2278. https ://doi.org/10.3390/nu111 02278
27. Moran L, Lombard C, Noakes M (2009) Is there a need for clini-cal practice guidelines for the dietary treatment of women with polycystic ovary syndrome? Nutr Diet 66(4):249–251. https :// doi.org/10.1111/j.1747-0080.2009.01379 .x
28. Villa J, Pratley RE (2011) Adipose tissue dysfunction in poly-cystic ovary syndrome. Curr Diab Rep 11(3):179–184. https :// doi.org/10.1007/s1189 2-011-0189-8
29. Kang SM, Yoon JW, Ahn HY, Kim SY, Lee KH, Shin H, Choi SH, Park KS, Jang HC, Lim S (2011) Android fat depot is more closely associated with metabolic syndrome than abdominal vis-ceral fat in elderly people. PLoS ONE 6(11):e27694. https ://doi. org/10.1371/journ al.pone.00276 94
30. Karastergiou K, Smith SR, Greenberg AS, Fried SK (2012) Sex differences in human adipose tissues–the biology of pear shape. Biol Sex Differ 3(1):13. https ://doi.org/10.1186/2042-6410-3-13
31. Delitala AP, Capobianco G, Delitala G, Cherchi PL, Dessole S (2017) Polycystic ovary syndrome, adipose tissue and meta-bolic syndrome. Arch Gynecol Obstet 296(3):405–419. https :// doi.org/10.1007/s0040 4-017-4429-2
32. O’Reilly MW, House PJ, Tomlinson JW (2014) Understanding androgen action in adipose tissue. J Steroid Biochem Mol Biol 143:277–284. https ://doi.org/10.1016/j.jsbmb .2014.04.008
33. Spritzer PM, Lecke SB, Satler F, Morsch DM (2015) Adipose tis-sue dysfunction, adipokines, and low-grade chronic inflammation in polycystic ovary syndrome. Reproduction 149(5):R219–R227.
https ://doi.org/10.1530/REP-14-0435
34. Mannerås-Holm L, Leonhardt H, Kullberg J, Jennische E, Odén A, Holm G, Hellström M, Lönn L, Olivecrona G, Stener-Victorin E (2011) Adipose tissue has aberrant morphology and function in PCOS: enlarged adipocytes and low serum adiponectin, but not circulating sex steroids, are strongly associated with insulin resistance. J Clin Endocrinol Metab 96(2):E304–E311. https :// doi.org/10.1210/jc.2010-1290
35. Westerink J, Olijhoek JK, Koppen A, Faber DR, Kalkhoven E, Monajemi H, van Asbeck BS, van der Graaf Y, Visseren FL (2013) The relation between body iron stores and adipose tissue function in patients with manifest vascular disease. Eur J Clin Invest 43(12):1240–1249. https ://doi.org/10.1111/eci.12165
36. Hubler MJ, Peterson KR, Hasty AH (2015) Iron homeostasis: a new job for macrophages in adipose tissue? Trends Endocrinol Metab 26(2):101–109. https ://doi.org/10.1016/j.tem.2014.12.005
37. Stechemesser L, Eder SK, Wagner A, Patsch W, Feldman A, Strasser M, Auer S, Niederseer D, Huber-Schönauer U, Paulwe-ber B (2017) Metabolomic profiling identifies potential path-ways involved in the interaction of iron homeostasis with glucose metabolism. Mol Metab 6(1):38–47. https ://doi.org/10.1016/j. molme t.2016.10.006
38. Al-Hakeim HK (2012) Correlation between iron status param-eters and hormone levels in women with polycystic ovary syn-drome. Clin Med Insights Womens Health 5:1–8. https ://doi. org/10.4137/CMWH.S8780
39. Kim JW, Kang KM, Yoon TK, Shim SH, Lee WS (2014) Study of circulating hepcidin in association with iron excess, metabolic syndrome, and BMP-6 expression in granulosa cells in women with polycystic ovary syndrome. Fertil Steril 102(2):548–554. e542. https ://doi.org/10.1016/j.fertn stert .2014.04.031
40. Acton RT, Barton JC, Barton JC (2015) Serum ferritin, insulin resistance, and metabolic syndrome: clinical and laboratory asso-ciations in 769 non-Hispanic whites without diabetes mellitus in the HEIRS study. Metab Syndr Relat Disord 13(2):57–63. https ://doi.org/10.1089/met.2014.0106
41. Fernández-Real JM, McClain D, Manco M (2015) Mecha-nisms linking glucose homeostasis and iron metabolism toward the onset and progression of type 2 diabetes. Diabetes Care 38(11):2169–2176. https ://doi.org/10.2337/dc14-3082
42. Dongiovanni P, Fracanzani AL, Fargion S, Valenti L (2011) Iron in fatty liver and in the metabolic syndrome: a promising thera-peutic target. J Hepatol 55(4):920–932. https ://doi.org/10.1016/j. jhep.2011.05.008
43. Liu B-w, Xuan X-m, Liu J-r, Li F-n, Yin F-Z (2015) The relation-ship between serum ferritin and insulin resistance in different glucose metabolism in nonobese Han adults. Int J Endocrinol 2015:1–5. https ://doi.org/10.1155/2015/64219 4
44. Backe MB, Moen IW, Ellervik C, Hansen JB, Mandrup-Poulsen T (2016) Iron regulation of pancreatic beta-cell functions and oxidative stress. Annu Rev Nutr 36:241–273. https ://doi. org/10.1146/annur ev-nutr-07171 5-05093 9
45. Dongiovanni P, Ruscica M, Rametta R, Recalcati S, Steffani L, Gatti S, Girelli D, Cairo G, Magni P, Fargion S (2013) Dietary iron overload induces visceral adipose tissue insulin resistance. Am J Pathol 182(6):2254–2263. https ://doi.org/10.1016/j.ajpat h.2013.02.019
46. Rumberger JM, Peters T, Burrington C, Green A (2004) Transfer-rin and iron contribute to the lipolytic effect of serum in isolated adipocytes. Diabetes 53(10):2535–2541. https ://doi.org/10.2337/ diabe tes.53.10.2535
47. Green A, Basile R, Rumberger JM (2006) Transferrin and iron induce insulin resistance of glucose transport in adipocytes.
Metabolism 55(8):1042–1045. https ://doi.org/10.1016/j.metab ol.2006.03.015
48. Hershkop K, Besor O, Santoro N, Pierpont B, Caprio S, Weiss R (2016) Adipose insulin resistance in obese adolescents across the spectrum of glucose tolerance. J Clin Endocrinol Metab 101(6):2423–2431. https ://doi.org/10.1210/jc.2016-1376
49. Wlazlo N, Van Greevenbroek MM, Ferreira I, Jansen EH, Feskens EJ, Van Der Kallen CJ, Schalkwijk CG, Bravenboer B, Stehouwer CD (2013) Iron metabolism is associated with adi-pocyte insulin resistance and plasma adiponectin: the cohort on diabetes and atherosclerosis maastricht (CODAM) study. Diabe-tes Care 36(2):309–315. https ://doi.org/10.2337/dc12-0505
50. Makki K, Froguel P, Wolowczuk I (2013) Adipose tissue in obesity-related inflammation and insulin resistance: cells, cytokines, and chemokines. ISRN Inflamm 2013:139239. https ://doi.org/10.1155/2013/13923 9
51. Ma X, Pham VT, Mori H, MacDougald OA, Shah YM, Bodary PF (2017) Iron elevation and adipose tissue remodeling in the epididymal depot of a mouse model of polygenic obesity. PLoS ONE 12(6):e0179889. https ://doi.org/10.1371/journ al.pone.01798 89
52. Kimura Y, Yasuda K, Kurotani K, Akter S, Kashino I, Hayabuchi H, Sato M, Mizoue T (2017) Circulating ferritin concentrations are differentially associated with serum adipokine concentra-tions in Japanese men and premenopausal women. Eur J Nutr 56(8):2497–2505. https ://doi.org/10.1007/s0039 4-016-1285-y
53. Aso Y, Takebayashi K, Wakabayashi S, Momobayashi A, Suga-wara N, Terasawa T, Naruse R, Hara K, Suetsugu M, Morita K (2010) Relation between serum high molecular weight adi-ponectin and serum ferritin or prohepcidin in patients with type 2 diabetes. Diabetes Res Clin Pract 90(3):250–255. https ://doi. org/10.1016/j.diabr es.2010.09.008
54. Gabrielsen JS, Gao Y, Simcox JA, Huang J, Thorup D, Jones D, Cooksey RC, Gabrielsen D, Adams TD, Hunt SC (2012) Adi-pocyte iron regulates adiponectin and insulin sensitivity. J Clin Invest 122(10):3529–3540. https ://doi.org/10.1172/JCI44 421
55. Juanola-Falgarona M, Cándido-Fernández J, Salas-Salvado J, Martínez-González MA, Estruch R, Fiol M, Arija-Val V, Bulló M, Investigators PS (2013) Association between serum ferritin and osteocalcin as a potential mechanism explaining the iron-induced insulin resistance. PLoS ONE 8(10):e76433. https ://doi. org/10.1371/journ al.pone.00764 33
56. Simcox JA, McClain DA (2013) Iron and diabetes risk. Cell Metab 17(3):329–341. https ://doi.org/10.1016/j. cmet.2013.02.007
57. Moreno-Navarrete JM, Ortega F, Rodríguez A, Latorre J, Becer-ril S, Sabater-Masdeu M, Ricart W, Frühbeck G, Fernández-Real JM (2017) HMOX1 as a marker of iron excess-induced adipose tissue dysfunction, affecting glucose uptake and respiratory capacity in human adipocytes. Diabetologia 60(5):915–926. https ://doi.org/10.1007/s0012 5-017-4228-0
58. Valenti L, Dongiovanni P (2012) Iron and the adipocyte: beware the liver. Immuno Gastroenterol 1(2):74. https ://doi.org/10.7178/ ig.14
59. Sam S (2015) Adiposity and metabolic dysfunction in polycystic ovary syndrome. Horm Mol Biol Clin Investig 21(2):107–116.
https ://doi.org/10.1515/hmbci -2015-0008
60. Moore AM, Campbell RE (2016) The neuroendocrine genesis of polycystic ovary syndrome: a role for arcuate nucleus GABA neurons. J Steroid Biochem Mol Biol 160:106–117. https ://doi. org/10.1016/j.jsbmb .2015.10.002
61. Moore AM, Campbell RE (2017) Polycystic ovary syndrome: understanding the role of the brain. Front Neuroendocrinol 46:1– 14. https ://doi.org/10.1016/j.yfrne .2017.05.002
62. Feng Y, Johansson J, Shao R, Mannerås L, Fernandez-Rod-riguez J, Billig H, Stener-Victorin E (2009) Hypothalamic
neuroendocrine functions in rats with dihydrotestosterone-induced polycystic ovary syndrome: effects of low-frequency electro-acupuncture. PLoS ONE 4(8):e6638. https ://doi. org/10.1371/journ al.pone.00066 38
63. Blank SK, McCartney CR, Helm KD, Marshall JC (2007) Neu-roendocrine effects of androgens in adult polycystic ovary syn-drome and female puberty. Seminn Reprod Med 25(5):352–359.
https ://doi.org/10.1055/s-2007-98474 1
64. Solorzano CMB, Beller JP, Abshire MY, Collins JS, McCart-ney CR, Marshall JC (2012) Neuroendocrine dysfunction in polycystic ovary syndrome. Steroids 77(4):332–337. https ://doi. org/10.1016/j.stero ids.2011.12.007
65. Goodarzi MO, Dumesic DA, Chazenbalk G, Azziz R (2011) Polycystic ovary syndrome: etiology, pathogenesis and diagno-sis. Nat Rev Endocrinol 7(4):219–231. https ://doi.org/10.1038/ nrend o.2010.217
66. Johansson J, Stener-Victorin E (2013) Polycystic ovary syn-drome: effect and mechanisms of acupuncture for ovulation induction. Evid Based Complement Alternat Med 2013:762615.
https ://doi.org/10.1155/2013/76261 5
67. Stamatiades GA, Kaiser UB (2018) Gonadotropin regulation by pulsatile GnRH: signaling and gene expression. Mol Cell Endo-crinol 463:131–141. https ://doi.org/10.1016/j.mce.2017.10.015
68. Lanzone A, Petraglia F, Fulghesu AM, Ciampelli M, Caruso A, Mancuso S (1995) Corticotropin-releasing hormone induces an exaggerated response of adrenocorticotropic hormone and corti-sol in polycystic ovary syndrome. Fertil Steril 63(6):1195–1199.
https ://doi.org/10.1016/s0015 -0282(16)57596 -7
69. Chazenbalk G, Singh P, Irge D, Shah A, Abbott DH, Dumesic DA (2013) Androgens inhibit adipogenesis during human adi-pose stem cell commitment to preadipocyte formation. Steroids 78(9):920–926. https ://doi.org/10.1016/j.stero ids.2013.05.001
70. Chirumbolo S, Rossi AP, Rizzatti V, Zoico E, Franceschetti G, Girelli D, Zamboni M (2015) Iron primes 3T3-L1 adipocytes to a TLR4-mediated inflammatory response. Nutrition 31(10):1266– 1274. https ://doi.org/10.1016/j.nut.2015.04.007
71. Echiburú B, Pérez-Bravo F, Galgani JE, Sandoval D, Saldías C, Crisosto N, Maliqueo M, Sir-Petermann T (2018) Enlarged adipocytes in subcutaneous adipose tissue associated to hyper-androgenism and visceral adipose tissue volume in women with polycystic ovary syndrome. Steroids 130:15–21. https ://doi. org/10.1016/j.stero ids.2017.12.009
72. Lee R, Nieman D (2012) Nutritional assessment 6th, edition edn. McGraw-Hill Education, New York
73. Nuttall FQ (2015) Body mass index: obesity, BMI, and health: a critical review. Nutr Today 50(3):117–128. https ://doi. org/10.1097/NT.00000 00000 00009 2
74. WHO (2000) Obesity: preventing and managing the global epi-demic Report of a WHO Consultation (WHO Technical Report Series 894)
75. Harrington DM, Staiano AE, Broyles ST, Gupta AK, Katzmarzyk PT (2013) Waist circumference measurement site does not affect relationships with visceral adiposity and cardiometabolic risk factors in children. Pediatr Obes 8(3):199–206. https ://doi.org/1 0.1111/j.2047-6310.2012.00106 .x
76. Ezeh U, Pall M, Mathur R, Azziz R (2014) Association of fat to lean mass ratio with metabolic dysfunction in women with polycystic ovary syndrome. Hum Reprod 29(7):1508–1517. https ://doi.org/10.1093/humre p/deu09 6
77. Sun W, Di Zhang ZW, Sun J, Xu B, Chen Y, Ding L, Huang X, Lv X, Lu J, Bi Y (2016) Insulin resistance is associated with total bile acid level in type 2 diabetic and nondiabetic population: a cross-sectional study. Medicine (Baltimore) 95(10):e2278. https ://doi.org/10.1097/MD.00000 00000 00277 8
78. Uzunlulu M, Oğuz A, Aslan G, Karadağ F (2009) Cut-off val-ues for waist circumference in Turkish population: is there a
threshold to predict insulin resistance. Turk Kardiyol Dern Ars 37(Suppl 6):17–23
79. Türkiye Endokrinoloji ve Metabolizma Derneği Metabolik Sendrom Çalışma Grubu (2009) Metabolik Sendrom Kilavuzu. Tuna Matbaacılık, Ankara
80. Wen J, Zhong Y, Kuang C, Liao J, Chen Z, Yang Q (2017) Lipoprotein ratios are better than conventional lipid parameters in predicting arterial stiffness in young men. J Clin Hypertens 19(8):771–776. https ://doi.org/10.1111/jch.13038
81. Du Y, Chen J, Chen M-H, Yang S-H, Li S, Guo Y-L, Zhu C-G, Xu R-X, Dong Q, Li J-J (2016) Relationship of lipid and lipoprotein ratios with coronary severity in patients with new on-set coronary artery disease complicated with type 2 diabet-ics. J Geriatr Cardiol 13(8):685–692. https ://doi.org/10.11909 /j.issn.1671-5411.2016.08.007
82. Amato MC, Giordano C, Galia M, Criscimanna A, Vitabile S, Midiri M, Galluzzo A (2010) Visceral adiposity index: a reliable indicator of visceral fat function associated with car-diometabolic risk. Diabetes Care 33(4):920–922. https ://doi. org/10.2337/dc09-1825
83. Agrawal H, Aggarwal K, Jain A (2019) Visceral adiposity index: simple tool for assessing cardiometabolic risk in women with polycystic ovary syndrome. Indian J Endocrinol Metab 23(2):232–237. https ://doi.org/10.4103/ijem.IJEM_559_18
84. Amato MC, Giordano C (2014) Visceral adiposity index: an indicator of adipose tissue dysfunction. Int J Endocrinol 2014:1–7. https ://doi.org/10.1155/2014/73082 7
85. Kahn HS (2005) The “lipid accumulation product” performs better than the body mass index for recognizing cardiovascular risk: a population-based comparison. BMC Cardiovasc Disord 5(1):26. https ://doi.org/10.1186/1471-2261-5-26
86. Kiranmayee D, Kavya K, Himabindu Y, Sriharibabu M, Mad-huri GLJ, Venu S (2017) Correlations between anthropometry and lipid profile in women with PCOS. J Hum Reprod Sci 10(3):167–172. https ://doi.org/10.4103/jhrs.JHRS_108_16
87. Deng Y, Zhang Y, Li S, Zhou W, Ye L, Wang L, Tao T, Gu J, Yang Z, Zhao D (2017) Steroid hormone profiling in obese and nonobese women with polycystic ovary syndrome. Sci Rep 7(1):1–9. https ://doi.org/10.1038/s4159 8-017-14534 -2
88. Behboudi-Gandevani S, Tehrani FR, Cheraghi L, Azizi F (2016) Could “a body shape index” and “waist to height ratio” predict insulin resistance and metabolic syndrome in polycystic ovary syndrome? Eur J Obstet Gynecol Reprod Biol 205:110– 114. https ://doi.org/10.1016/j.ejogr b.2016.08.011
89. Huddleston HG, Quinn MM, Kao CN, Lenhart N, Rosen MP, Cedars MI (2017) Women with polycystic ovary syndrome demonstrate worsening markers of cardiovascular risk over the short-term despite declining hyperandrogenaemia: Results of a longitudinal study with community controls. Clin Endocrinol (Oxf) 87(6):775–782. https ://doi.org/10.1111/cen.13497
90. Geronikolou SA, Bacopoulou F, Cokkinos D (2017) Bioim-pedance measurements in adolescents with polycystic ovary syndrome: a pilot study. Adv Exp Med Biol 987:291–299. https ://doi.org/10.1007/978-3-319-57379 -3_26
91. Macruz CF, Lima SM, Salles JE, da Silva GM, Scalissi NM (2017) Assessment of the body composition of patients with polycystic ovary syndrome using dual-energy X-ray absorp-tiometry. Int J Gynaecol Obstet 136(3):285–289. https ://doi. org/10.1002/ijgo.12066
92. Barber TM, Golding SJ, Alvey C, Wass JA, Karpe F, Franks S, McCarthy MI (2008) Global adiposity rather than abnormal regional fat distribution characterizes women with polycystic ovary syndrome. J Clin Endocrinol Metab 93(3):999–1004.
https ://doi.org/10.1210/jc.2007-2117
93. Robinson S, Chan SP, Spacey S, Anyaoku V, Johnston DG, Franks S (1992) Postprandial thermogenesis is reduced in
polycystic ovary syndrome and is associated with increased insulin resistance. Clin Endocrinol (Oxf) 36(6):537–543. https ://doi.org/10.1111/j.1365-2265.1992.tb022 62.x
94. Hirschberg AL (2012) Sex hormones, appetite and eating behaviour in women. Maturitas 71(3):248–256. https ://doi. org/10.1016/j.matur itas.2011.12.016
95. Durmus U, Duran C, Ecirli S (2017) Visceral adiposity index levels in overweight and/or obese, and non-obese patients with polycystic ovary syndrome and its relationship with metabolic and inflammatory parameters. J Endocrinol Invest 40(5):487– 497. https ://doi.org/10.1007/s4061 8-016-0582-x
96. Fulghesu A, Magnini R, Portoghese E, Angioni S, Minerba L, Melis GB (2010) Obesity-related lipid profile and altered insulin incretion in adolescents with polycystic ovary syndrome. J Ado-lesc Health 46(5):474–481. https ://doi.org/10.1016/j.jadoh ealth .2009.10.008
97. Kim JJ, Chae S, Choi Y, Hwang KR, Song SH, Yoon S, Kim SM, Ku S-Y, Kim S, Kim J (2013) Atherogenic changes in low-density lipoprotein particle profiles were not observed in non-obese women with polycystic ovary syndrome. Hum Reprod 28(5):1354–1360. https ://doi.org/10.1093/humre p/det05 7
98. Berneis K, Rizzo M, Hersberger M, Rini G, Di Fede G, Pepe I, Spinas G, Carmina E (2009) Atherogenic forms of dyslipidae-mia in women with polycystic ovary syndrome. Int J Clin Pract 63(1):56–62. https ://doi.org/10.1111/j.1742-1241.2008.01897 .x
99. Zheng S-H, Li X-L (2016) Visceral adiposity index as a predictor of clinical severity and therapeutic outcome of PCOS. Gynecol Endocrinol 32(3):177–183. https ://doi.org/10.3109/09513 590.2015.11113 27
100. Macut D, Antić IB, Bjekić-Macut J, Panidis D, Tziomalos K, Milutinović DV, Stanojlović O, Kastratović-Kotlica B, Petakov M, Milić N (2016) Lipid accumulation product is associated with metabolic syndrome in women with polycystic ovary syndrome. Hormones (Athens) 15(1):35–44. https ://doi.org/10.14310 / horm.2002.1592
101. Escobar-Morreale HF (2012) Iron metabolism and the polycys-tic ovary syndrome. Trends Endocrinol Metab 23(10):509–515.
https ://doi.org/10.1016/j.tem.2012.04.003
102. Sharifi F, Mazloomi S, Mousavinasab N (2011) High serum fer-ritin concentrations in polycystic ovary syndrome is not related to insulin resistance. Iran J Diabetes Obes 3(2):47–53
103. Lopez GP, Fernandez AB, Menacho M, Perez MJL, Araque NA, Molina JMR, Agelan JLL (2010) Serum ferritin in female-to-male transsexuals with polycystic ovary syndrome. Endocrine Abstracts 22:P474
104. Escobar-Morreale HF, Luque-Ramírez M, Álvarez-Blasco F, Botella-Carretero JI, Sancho J, San Millán JL (2005) Body iron stores are increased in overweight and obese women with poly-cystic ovary syndrome. Diabetes Care 28(8):2042–2044. https :// doi.org/10.2337/diaca re.28.8.2042
105. Ko PC, Huang SY, Hsieh CH, Hsu MI, Hsu C-S (2015) Serum ferritin levels and polycystic ovary syndrome in obese and non-obese women. Taiwan J Obstet Gynecol 54(4):403–407. https :// doi.org/10.1016/j.tjog.2014.06.005
106. Luque-Ramírez M, Alvarez-Blasco F, Botella-Carretero JI, Sanchón R, San Millán JL, Escobar-Morreale HF (2007) Increased body iron stores of obese women with polycystic ovary syndrome are a consequence of insulin resistance and hyperinsu-linism and are not a result of reduced menstrual losses. Diabetes Care 30(9):2309–2313. https ://doi.org/10.2337/dc07-0642
107. Ramezani Tehrani F, Minooee S, Azizi F (2014) Comparison of various adiposity indexes in women with polycystic ovary syndrome and normo-ovulatory non-hirsute women: a popula-tion-based study. Eur J Endocrinol 171(2):199–207. https ://doi. org/10.1530/eje-14-0094
Publisher’s Note Springer Nature remains neutral with regard to jurisdictional claims in published maps and institutional affiliations.