PANOECONOMICUS, 2019, Vol. 66, Issue 2, pp. 219-239
Received: 21 July 2016; Accepted: 03 May 2017.
UDC 316.728(430.1:430.2) https://doi.org/10.2298/PAN160721031U Original scientific paper
Meltem Ucal
Corresponding author
Kadir Has University, Department of Economics, Istanbul, Turkey https://orcid.org/0000-0003-3707-1948 [email protected] Simge Günay Kadir Has University, Department of Economics, Istanbul,
Turkey
Perceived Happiness, Perceived Trust
and Perceived Income Levels:
The Case of the Reunified Germany
Summary: This study explored the possible impact of perceived income on in-dividual (perceived) happiness in Eastern and Western Germany in relation to perceived trust and four socio-economic variables, namely gender, age, marital status and employment status. To examine the relationship between these vari-ables, a generalized ordered logit model was applied using the World Values Survey data. Bootstrapping and marginal effects were used to obtain a more robust model. The findings provided insights regarding the impact of perceived income and perceived trust on individual (perceived) happiness in both regions after reunification. Perceived income had a positive effect on all happiness cat-egories in both regions. Perceived trust had a stronger positive impact on indi-vidual happiness than that of perceived income, although its significance varied across individual (perceived) happiness categories. Analysis of marginal effects revealed differences between the base models.
Key words: Perceived happiness, Perceived income, East-West Germany, Re-unification, Generalized ordered logit models.
JEL: C50, C83, I31.
Pre-existing economic differences between former East and West Germany have con-tinued since reunification (Inna Petrunyk and Christian Pfeifer 2016, p. 217). Given that individual (perceived) happiness studies, which have proliferated in recent years, reveal that economic factors influence individual (perceived) happiness one way or another (Guglielmo Maria Caporale et al. 2009; Inder J. Ruprah and Pavel Luengas 2011; Dora G. Gudmundsdottir 2013; David G. Blanchflower et al. 2014; Rainer Win-kelmann 2014), this study investigates the relationship between individuals’ income perceptions rather than the actual level of income and individual (perceived) happi-ness, while controlling this relationship for perceived trust levels and various socio-demographic variables. Although it is now 26 years since Germany reunified, we think that it would be interesting to investigate selected variables in Eastern and Western Germany separately to see whether results would differ between them at the end of our analysis. In addition, assessing the impact of the specific variables in the model on individual (perceived) happiness levels can contribute to the rapidly developing indi-vidual (perceived) happiness literature.
220 Meltem Şengün Ucal and Simge Günay
The following section reviews research into the relationship between individual (perceived) happiness, perceived income and perceived trust before considering the specific relationship between these variables for both regions of Germany. The second section explains the methodology and data of this study, before the results of the em-pirical analysis are presented and discussed in the third section. The fourth section concludes the study.
1. Literature Review
The individual (perceived) happiness-income relationship is generally discussed in the literature in terms of two different types of income: absolute and relative. The seminal study regarding this relationship (Richard A. Easterlin 1974) revealed a positive rela-tionship between individual (perceived) happiness and relative income within coun-tries. In other words, people with higher income were happier than those with a lower income within that society. However, the relationship between countries was not so clear. Therefore, Easterlin (1974) suggested that differences in relative rather than ab-solute income levels may explain the results. According to the relative income hypoth-esis, people compare their actual income with some reference standard (e.g. the income of other people or their own previous income level), which determines their individual (perceived) happiness level (Easterlin 1974, p. 118). Caporale et al. (2009) found a positive relationship between individual (perceived) happinesss and absolute income, but when reference income was added to the analysis, it weakened this relationship. Their findings also suggest that while there is a negative relationship between refer-ence income and individual (perceived) happiness in Western European countries, the relationship between reference income and individual (perceived) happiness is positive in Eastern European countries. Other studies, Andrew E. Clark and Andrew J. Oswald (1996), Ed Diener and Robert Biswas-Diener (2002), Takashi Oshio, Kayo Nozaki, and Miki Kobayashi (2011) have found that both absolute and relative incomes deter-mine individual (perceived) happiness or subjective well-being. In contrast, Kostadin Kushlev, Elizabeth W. Dunn, and Richard E. Lucas (2015) reported no positive rela-tionship between absolute income and daily individual (perceived) happiness. Instead, they claimed in their article that although money can be used to reduce sadness, it does not increase individual (perceived) happiness. Other studies have considered the rela-tionship between social capital (trust) and individual (perceived) happiness. Robert D. Putnam (2000), for example, argued that social trust in the United States is declining rapidly while Ambrose Leung et al. (2011) claimed that social capital plays an im-portant role in individual (perceived) happiness although they reported that only trust in family has a significant relationship with individual (perceived) happiness rather than trust in other people. Different from these studies, Christian Bjornskov (2006) reported a positive relationship between (generalized) social trust and individual (per-ceived) happiness, using an international sample from over 80 countries in World Val-ues Survey.
Following this brief review of the relationship between individual (perceived) happiness, social trust and income levels, we can turn to East and West Germany spe-cifically. After the fall of the Berlin Wall on November 09, 1989, East and West Ger-many, which had been “separate entities” before the fall, were re-united (Paul Frijters,
221 Perceived Happiness, Perceived Trust and Perceived Income Levels: The Case of the Reunified Germany
John P. Haisken-DeNew, and Michael A. Shields 2004, p. 730). Since then, various studies have investigated the continued differences in life satisfaction or individual (perceived) happiness levels between individuals living in the East and West regions in terms of real household income and/or socio-demographic variables, such as marital status or employment. Frijters, Haisken-DeNew, and Shields (2004) for example, found a significant positive relationship between East Germans’ increasing real house-hold income and life satisfaction levels, after controlling for the impact of health, mar-ital status, number of children and employment status. They applied a fixed-effects ordered logit model to the German socio-economic panel data to determine the rela-tionship between the variables. They found that both employment status and real household income affect the life satisfaction of people living in East Germany while marriage only benefits men’s life satisfaction. They also found no evidence that di-vorce or separation affects East Germans’ life satisfaction (Frijters, Haisken-DeNew, and Shields 2004, p. 734). Aside from this study, Heinz Herbert Noll and Stefan Weick (2010) studied the cross-sectional analysis of correlates and determinants of several dimensions of subjective well-being in Germany. They compared Germany with other European countries in terms of differences in subjective well-being (Noll and Weick 2010, p. 70), noting that the quality of life conditions in East and West Germany has not yet converged despite reunification (Noll and Weick 2010, p. 73; Petrunyk and Pfeifer 2016, p. 217). While claiming that life conditions in East and West Germany have not yet converged, Petrunyk and Pfeifer (2016) refer to some studies (e.g. Werner Smolny 2012; Michael C. Burda 2013) to strengthen their argument about the gap be-tween Eastern and Western parts of Germany. Referred studies suggest that Eastern Germany still falls behind Western Germany in terms of employment levels, wages and productivity (Petrunyk and Pfeifer 2016, p. 217). Again, Noll and Weick (2010) stated that real household incomes have stagnated during the 1991-2007 period for both parts of Germany, contrary to individuals’ expectations in Western Germany and to the numbers Western Germany achieved in the past years following reunification. They also mentioned that during the recovery period that started in 2005, real incomes decreased. Between 1990 and 2007, they found that whereas life satisfaction levels in West Germany did not change very much, East Germans experienced a significant decline in subjective well-being following reunification because of unfulfilled or un-realistic expectations (Noll and Weick 2010, pp. 73-74). Felix R. FitzRoy et al. (2014, p. 9) also found that East Germans have lower life satisfaction than West Germans, which is consistent with the fact that unemployment has affected East Germans more and that household income is much lower in East Germany than West Germany. In their investigation of the income-individual (perceived) happiness relationship, Stefan Boes and Winkelmann (2004, p. 1) noted the inappropriateness of ordered logit and ordered probit models. They proposed using generalized threshold and sequential mod-els instead.
Winkelmann’s (2009) examination of the relationship between unemployment, social capital and subjective well-being, using German socio-economic panel data (1984-2004), showed that social capital is a significant predictor of well-being while Bo Rothstein (2010, p. 17) showed a positive relationship between social trust and individual (perceived) happiness, confirming previous studies (Eric M. Uslaner 2002;
222 Meltem Şengün Ucal and Simge Günay
Jan Delhey and Kenneth Newton 2003). Delhey and Newton (2003) explored social trust in seven countries, including East and West Germany (by considering them as separate regions), which they justified in terms of their “different socialization experi-ences” and “living conditions” (Delhey and Newton 2003, p. 102).
Although several studies have measured perceived income distribution (Guillermo Cruces, Ricardo Perez-Truglia, and Martin Tetaz 2013; Barbara Jancewicz 2016) and perceived income inequality (Yoram Amiel 1999) in the literature inde-pendently of studies about Eastern and Western Germany, no study has yet investi-gated the relationship between perceived income and individual (perceived) happiness while various studies can be found in the literature regarding the relationship between absolute/relative income and individual (perceived) happiness. Accordingly, this study explored the relationship between individual (perceived) happiness, perceived income levels and perceived trust1 in both East and West Germany, using the data from the
third and fifth waves of the World Values Survey (WVS 2017)2. It aimed to determine
whether the results obtained for the two regions of Germany differ by each region and provide an insight for subsequent studies into this subject so that a comparison can be made between our findings and with those that can be found in previous studies.
2. Methodology and Data
Model selection should be considered carefully before applying any model to the data; otherwise, the selected model may not be suitable to estimate the data in question properly (Meltem Şengün Ucal 2006, p. 41). For this reason, in Section 2.1, we explain which specific model was chosen and why.
2.1 Generalized Ordered Logit Model
Scholars and statisticians widely use the proportional odds model to estimate an ordi-nal dependent variable (Xing Liu and Hari Koirala 2012, p. 242). In the proportioordi-nal odds model, it is assumed that each explanatory variable affects different categories of the response variable in the same way. The terms parallel lines and proportional odds can be used interchangeably. Because it is applied to each independent variable in a strict order, using an ordered logistic model, this can restrict the analysis and violate the assumption of the proportional odds model. The formula of the proportional odds model (also known as an ordered logit model, which is a special case of the generalized ordered logit model) can be written as follows:
P(𝑌 > 𝑗 )= g (Xβ) = { }, 𝑗 = 1, 2, … , 𝑀 − 1. (1)
This formula is actually the same as that of generalized ordered logit model, except that in this formula, β’s, instead of α’s, are the same for all values of j. Since the assumption of the proportional odds model may be violated because real world
1 “Perceived” trust has the same meaning with “generalized social trust”.
2 World Values Survey (WVS). 2017. Documentation for Download. http://www.worldvaluessur-vey.org/WVSContents.jsp (accessed March 25, 2017).
223 Perceived Happiness, Perceived Trust and Perceived Income Levels: The Case of the Reunified Germany
data is used (Karen Grace-Martin 2017), the partial proportional odds model can be used instead.
Since the proportional odds assumption was violated in the ordered logistic re-gression analysis, we decided to use the generalized ordered logit model in examining the relationship between individual (perceived) happiness, perceived income levels and generalized perceived trust. Another reason for preferring this model was that it provides more consistent results than the multinomial logistic model. We did not use the multinomial logistic model because we knew that we could not clarify the ordinal nature of the outcome from this model. Because the multinomial logistic model greatly relaxes the parallel lines assumption, it suppresses the ordinal nature of the response variable (Boes and Winkelmann 2006; David W. Hosmer Jr. and Stanley Lemeshow 2000).
The generalized ordered logit model was first suggested by Vincent K. Fu (1999) to relax the assumption of the proportional odds model. In the generalized model, each independent variable has a different impact on different categories (cut-points) of the ordinal outcome variable. Therefore, this ensures flexibility to the model (Liu and Koirala 2012, p. 243).
The formula of the unconstrained generalized ordered model can be written as follows:
P(𝑌 > 𝑗 ) = 𝑔 𝑋𝛽 = , 𝑗 = 1, 2, … , 𝑀 − 1. (2)
If this form of the model is used, the comparison between logit, ordered logit and generalized ordered logit can be made and interpreted much more easily. In this formula, M indicates the number of categories of the ordinal outcome variable. The probabilities of Y for 1, 2, …, M can be written in three different ways:
1) P(𝑌 =1) = 1- g(𝑋 𝛽 );
2) P(𝑌 = j) = g(𝑋 𝛽 ) – g(𝑋 𝛽 ) j = 2, … , M – 1; 3) P(𝑌 =M) = g(𝑋 𝛽 ).
In addition, because all the β’s are the same in this formula, its results will be similar to those of the multinomial logistic model.
However, Fu’s (1999) form of the generalized ordered logit model (gologit1) is not compatible with the proportional odds or the partial proportional odds models. Therefore, Richard Williams (2006a, b) improved Fu’s (1999) model to make it comply with these models. The new model (gologit2) is stronger than Fu’s (1999) version, especially in terms of estimation and interpretation (Williams 2006a, p. 60). The formula of this version of the generalized ordered logit model can be written as follows:
P(𝑌 > 𝑗 )= { ( ) } , j = 1, 2,… , M – 1. (3)
In this form of the model, 𝛽 and 𝛽 are the same for 𝑥 and 𝑥 for all values of
j. However, 𝛽 can differ. In this sense, the model is relaxed.
Using Williams’ (2006a, b) version of the non-linear probability model, users can estimate the determinants and probability of each result generated without using a
224 Meltem Şengün Ucal and Simge Günay
latent variable (y*). The generalized ordered logit model also enables users to constrain selected variables, which meet the proportional odds assumption while it enables them to free up the variables, which violate this assumption. Regarding this statement, it can be inferred that there may be multiple y*’s that bring about a single observed y (Williams 2006b, pp. 22-23).
When examining relationships between selected variables using logistic models like the generalized ordered logit model, marginal effects should also be considered. They are important in revealing probability changes of dependent variables in an analysis when any independent variable increases by one unit. Probabilities may also vary depending on changes in the survey responses, for example, very happy, quite happy, not very happy, in an individual (perceived) happiness question so it is better to look at marginal effects when doing this kind of analysis (Oscar Torres-Reyna 2012). In our study, marginal effects provide insights about changes in the proportion of individuals within each specific individual (perceived) happiness level when any predictor variable increases by one response category. This enables our regression analysis to easily capture the impact of each category of predictor variables on individual (perceived) happiness level. The estimated marginal effects of the predictor variables are presented in Tables 6 and 7 in Section 2.5.2.
2.2 Data
This study used the third and the fifth waves of the World Values Survey (2017) cross-section data for modelling individual (perceived) happiness in the East and the West regions of Germany. While the data allowed the user to make a time series analysis, our purpose here was to use the pooled data (time-invariant) by separating it into the two regions of Germany in both waves.
Detailed explanations of the variables used in the regression analysis are presented in Table 1.
In the World Values Survey (2017), the question about individual (perceived) happiness was as follows: “Taking all things together, would you say you are (read out and code one answer): very happy, rather (quite) happy, not very happy, not at all happy?”.
The question about income scale (perceived income) was as follows: “Here is a scale of incomes and we would like to know in what group your household is, counting all wages, salaries, pensions and other incomes. Just give the letter of the group your household falls into, before taxes and other deductions”.
The question about perceived trust was as follows: “Generally speaking, would you say that most people can be trusted or you can’t be too careful in dealing with people?”.
The question about marital status was as follows: “Are you currently: (1) married; (2) living as married; (3) divorced; (4) separated; (5) widowed; (6) single”.
The question about people’s employment status was as follows: “Are you yourself employed or not? If yes: full time or part time? If more than one job: only for the main job. Has paid employment: (1) full time; (2) part time; (3) self-employed. If no paid employment: (4) retired/pensioned; (5) housewife not otherwise employed; (6) student; (7) unemployed; (8) other”.
225 Perceived Happiness, Perceived Trust and Perceived Income Levels: The Case of the Reunified Germany
Tables 2 and 3, which present the distribution of individual (perceived) happiness responses for East Germany (n = 2.058) and West Germany (n = 1.943), show that “rather/quite happy” is the most common answer between both East and West Germans.
Table 1 Description of Variables in the Regression Analysis
Dependent variable Independent variable Explanations
Individual (perceived) happiness categories:
Very happy: 1 Rather/Quite happy: 2 Not very happy: 3 Not at all happy: 4
Perceived income Lowest income decile: 1
Highest income decile: 10
Perceived trust Most people can be trusted: 1
Can’t be too careful: 2
Gender Male: 1
Female: 0
Marital status Married: 1
Living as married: 2 Divorced: 3 Separated: 4 Widowed: 5 Single: 6
Employment status Full time: 1
Part time: 2 Self-employed: 3 If no paid employment: Retired/Pensioned: 4
Housewife not otherwise employed: 5 Student: 6
Unemployed: 7 Other: 8
Age In years, ranging from 18 to 93 in the East region of Germany; from 18 to 91 in the West region of Germany.
Notes: “Don’t know” and “No answer” were not taken into consideration regarding each variable in the analysis.
Source: World Values Survey (2017).
Table 2 Distribution of Individual (Perceived) Happiness in East Germany
Happiness Frequency Percent (%) Cumulative
Very happy Rather/Quite happy Not very happy Not at all happy Total 336 1,264 390 68 2,058 16.33 61.42 18.95 3.30 100.00 16.33 77.75 96.70 100.00
Source: Authors’ calculations.
Table 3 Distribution of Individual (Perceived) Happiness in West Germany
Happiness Frequency Percent (%) Cumulative
Very happy Rather/Quite happy Not very happy Not at all happy Total 408 1,232 267 36 1,943 21.00 63.41 13.74 1.85 100.00 21.00 84.41 98.15 100.00
226 Meltem Şengün Ucal and Simge Günay
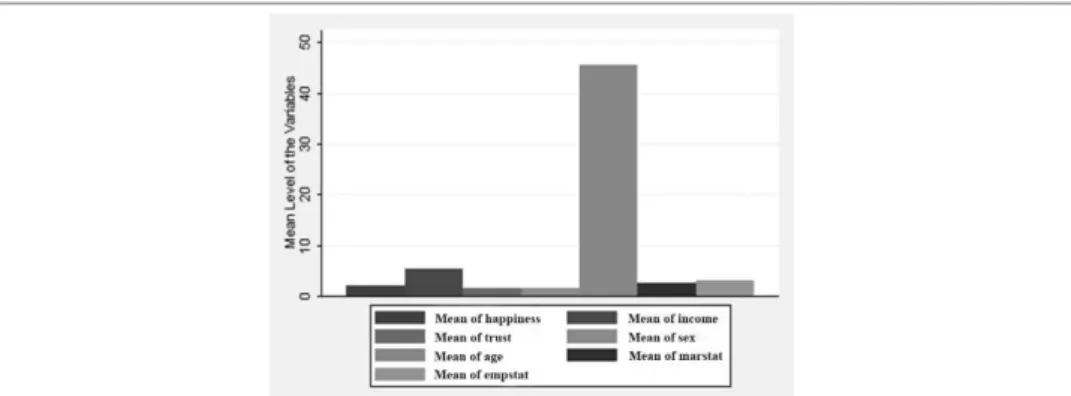
Figures 1 and 2 present the means for each variable for East and West Germany, respectively. Because age is the only continuous variable, its mean is much larger than the others’.
Source: Authors’ estimations.
Figure 1 Individual (Perceived) Happiness, Perceived Trust, Age, Employment Status, Perceived
Income, Gender and Marital Status in East Germany3
Notes: Gender is written as sex in Figures 1 and 2. “Trust” indicates “perceived” trust of individuals who responded to the
WVS. “Happiness” indicates “perceived” happiness.
Source: Authors’ estimations.
Figure 2 Individual (Perceived) Happiness, Perceived Trust, Age, Employment Status, Perceived
Income, Gender and Marital Status in West Germany4
3 The first column indicates “mean of happiness”. The second column indicates “mean of income”. The third column indicates “mean of trust”. The fourth column indicates “mean of sex”. The fifth column indicates “mean of age”. The sixth column indicates “mean of marital status”. The last column indicates “mean of employment status”.
4 The first column indicates “mean of happiness”. The second column indicates “mean of income”. The third column indicates “mean of trust”. The fourth column indicates “mean of sex”. The fifth column indicates “mean of age”. The sixth column indicates “mean of marital status”. The last column indicates “mean of employment status”.
227 Perceived Happiness, Perceived Trust and Perceived Income Levels: The Case of the Reunified Germany
2.2.1 Arguments about the Reliability of Individual (Perceived) Happiness Data
Within the individual (perceived) happiness literature, neoclassical researchers argue that because individual (perceived) happiness cannot actually be measured, using individual (perceived) happiness data cannot be justified. They assert instead that individual (perceived) happiness levels can only be estimated by deriving them from observed demand. Thus, they ignore cardinal utility happiness functions and surveys, which measure individual (perceived) happiness levels because such surveys measure “stated preferences” instead of indicating “revealed preferences” (Bernard M. S. Van Praag and Ada Ferrer-i-Carbonell 2011). This makes it important for us to justify why we think that individual (perceived) happiness can be measured, and to discuss the techniques that can be used to achieve this.
First, various psychological studies have attempted to measure individual (perceived) happiness while individual (perceived) happiness data can be validated by examining their appropriateness (Alberto Alesina, Rafael Di Tella, and Robert MacCulloch 2004, pp. 2014-2016). Ricardo Perez-Truglia (2015, p. 74), for example, argues that validation tests can determine a possible positive relationship between subjective measures, such as well-being or life satisfaction, and objective measures, such as suicide rates and smiling. Second, according to Carol Graham (2011), individual (perceived) happiness surveys provide individuals the opportunity to compare various countries because they have an open-ended nature and help policy makers to observe welfare consequences of the types of institutional arrangements. Finally, the reliability of life satisfaction or subjective well-being data are supported by neurobiological evidence (Ayça Yemişcigil and Paul Dolan 2015).
2.2.2 Limitations of the Data Used in the Model
One of the limitations of this study concerns our use of pooled cross-section data due to the lack of appropriate panel data. Since we could not do a panel data analysis because of the absence of continuous year data with regard to the selected variables in our model, we could not capture individual-level effects and possible selection bias in our analysis. In addition, it was impossible to infer causality between response and predictor variables.
There are also some challenges in the individual (perceived) happiness data. One is possible bias in the responses to the survey (Graham 2011). Problems in measuring individual (perceived) happiness are divided into two categories by Anna Maffioletti, Agata Maida, and Francesco Scacciati (2014, pp. 13-17): terminological and methodological. The terminological problem is concerned about whether the concepts of individual (perceived) happiness, life satisfaction and subjective well-being can be used interchangeably. How people comprehend the questions about these concepts is critical for enabling a common understanding between the researchers who ask questions and the individuals who respond to them. The methodological problem is using a cardinal value for survey responses although the questions have a numerical scale, using an incomprehensible scale for questions and self-evaluation in surveys. If individuals evaluate their feelings subjectively, will it really be helpful for public policies on the subject of improving a society’s individual (perceived) happiness level?
228 Meltem Şengün Ucal and Simge Günay
This study’s response to this question is that both objective and subjective factors are involved in advancing society’s individual (perceived) happiness levels.
2.3 Expected Outcomes
This study predicted a significant positive relationship between individual (perceived) happiness and perceived levels of income. It is also predicted that there will be a sig- nificant positive relationship between individual (perceived) happiness and perceived trust (trust in other people). The relationship between individual (perceived) happiness and age is predicted to be significant and negative while marriage is predicted to have a significant positive impact on individual (perceived) happiness levels. Based on pre- vious studies, it is predicted that being female (gender effect) has a significant positive impact on individual (perceived) happiness. Finally, it is predicted that having a full- time job will have a significant positive impact on individual (perceived) happiness. These effects are predicted to apply to both regions of Germany.
2.4 Empirical Strategy
This study aimed to explore differences in individual (perceived) happiness while con- sidering the impact of perceived income levels of individuals living in East and West regions of Germany and perceived trust as well as the impacts of other variables such as employment status, marital status, gender and age. In the end, the regression anal- yses revealed that both perceived income and perceived trust have statistically signif- icant positive impacts on individual (perceived) happiness levels in both regions, with perceived trust having a larger effect than perceived income.
To achieve these findings, our (base) generalized ordered logistic regression model was done as follows:
𝐻𝐴𝑃𝑃𝐼𝑁𝐸𝑆𝑆 = 𝛼𝑃𝐸𝑅𝐶𝐸𝐼𝑉𝐸𝐷𝐼𝑁𝐶𝑂𝑀𝐸 + 𝛽𝑀𝐼𝐶𝑅𝑂 + 𝛾𝐷𝐸𝑀𝑂𝐺𝑅𝐴𝑃𝐻𝐼𝐶 + 𝜀. (4)
It used the following model:
𝐻𝐴𝑃𝑃𝐼𝑁𝐸𝑆𝑆 = 𝑓 𝑃𝐸𝑅𝐶𝐸𝐼𝑉𝐸𝐷𝐼𝑁𝐶𝑂𝑀𝐸 , 𝑇𝑅𝑈𝑆𝑇 , 𝐸𝑀𝑃𝑆𝑇𝐴𝑇 , 𝑀𝐴𝑅𝑆𝑇𝐴𝑇 , 𝐺𝐸𝑁𝐷𝐸𝑅 , 𝐴𝐺𝐸 . (5)
This model was used for each region where i refers to individuals and ɛ refers to the error term. Since they are not shown as abbreviations in Section 2.2, it is im- portant to mention that Empstat refers to employment status while Marstat is mar- ital status.
2.5 Results of the Analysis
2.5.1 Regression Analysis Results for Germany (East and West Regions)
In this type of regression model analysis, the dependent variable has combined categories. In Section 2.1, we explained the model we used and also mentioned that the probabilities of the response variable for 1, 2, …, M can be written in three ways. In these formulas, since M represents the number of categories of the response variable,
j represents its cut-points. For instance, if j is equal to 1, then, 1 will be contrasted with
2, 3 and 4. If j is equal to 2, then 1 and 2 will be contrasted with 3 and 4. If j is equal to 3 then 1, 2 and 3 will be contrasted with 4 (Williams 2006a, p. 59).
229 Perceived Happiness, Perceived Trust and Perceived Income Levels: The Case of the Reunified Germany
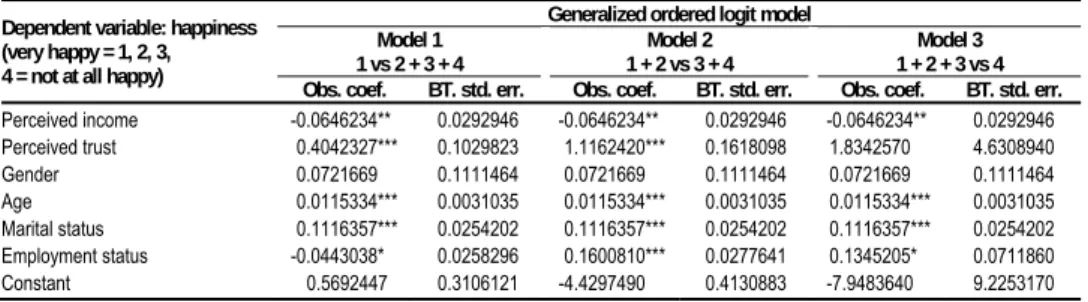
According to the regression analysis in Table 4, the coefficients for perceived income do not vary across the categories of the response variable, which is individual (perceived) happiness. This means perceived income has a positive impact on individ- ual (perceived) happiness in each category in East Germany. Similarly, the impact of gender on the response variable does not vary across the categories of individual (per- ceived) happiness. This means that being male has a negative impact on individual (perceived) happiness in the combined three categories in East Germany. However, it is statistically insignificant. In other words, gender has no significant effect on indi- vidual (perceived) happiness in each category in Eastern Germany. Similarly, the neg- ative impact of ageing (one-unit change in age) does not vary across the cut points of individual (perceived) happiness. Like the other variables mentioned, the impact of marital status on the response variable does not vary across the cut-points in East Ger- many. For each one-category change in marital status, individual (perceived) happi- ness level decreases. It means that married people have higher individual (perceived) happiness levels than those who are not. On the other hand, the coefficients of per- ceived trust, which do not meet the proportional odds assumption, vary across the cat- egories of individual (perceived) happiness. Thus, one-category change in perceived trust decreases individual (perceived) happiness at the first two cut-points of the re- sponse variable. However, the first cut indicates a higher individual (perceived) hap- piness level than the second cut. It means that at the second cut, the negative impact of mistrust increases, reaching its highest level at the third cut, although this effect is not statistically significant. In other words, the odds of being unhappy are 1.12 times higher at the second cut, if it is compared with the first cut. Similarly, the coefficients for employment status vary across the categories of the response variable, individual (perceived) happiness. Specifically, employment status has a more statistically posi- tive effect at the first cut, which indicates the happiest level, although its significance level is lower (p < 0.10) than the second cut (p < 0.05). One-category change in em- ployment status decreases individual (perceived) happiness level in East Germany at the second and the third cuts, with the negative impact being greater at the second cut. At the third cut, the impact of employment status is not statistically significant.
Table 4 Regression Analysis Results for East Germany
Dependent variable: happiness (very happy = 1, 2, 3, 4 = not at all happy)
Generalized ordered logit model
Model 1 Model 2 Model 3
1 vs 2 + 3 + 4 1 + 2 vs 3 + 4 1 + 2 + 3 vs 4
Obs. coef. BT. std. err. Obs. coef. BT. std. err. Obs. coef. BT. std. err.
Perceived income Perceived trust Gender Age Marital status Employment status Constant -0.0646234*** -0.4042327*** -0.0721669*** -0.0115334*** -0.1116357*** -0.0443038*** -0.5692447 0.0292946 0.1029823 0.1111464 0.0031035 0.0254202 0.0258296 0.3106121 -0.0646234*** -1.1162420*** -0.0721669*** -0.0115334*** -0.1116357*** -0.1600810*** -4.4297490*** 0.0292946 0.1618098 0.1111464 0.0031035 0.0254202 0.0277641 0.4130883 -0.0646234*** 1.8342570*** 0.0721669*** 0.0115334*** 0.1116357*** 0.1345205*** -7.9483640*** 0.0292946 4.6308940 0.1111464 0.0031035 0.0254202 0.0711860 9.2253170
Notes: * indicates p < 0.10 level of significance. ** indicates p < 0.05 level of significance. *** indicates p < 0.01 level of
significance. BT refers to bootstrap. “Obs.” is an abbreviation of “observed”.
230 Meltem Şengün Ucal and Simge Günay
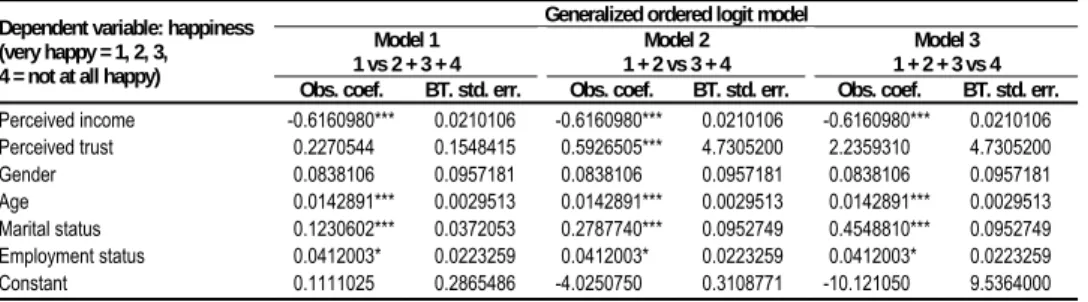
Table 5 shows that one-category change in perceived income increases individual (perceived) happiness levels in all categories of the response variable, individual (perceived) happiness, with no variation in its coefficients across the cut points of the response variable. Similar to the findings of East Germany, the coefficients for gender do not vary across the cut points of individual (perceived) happiness level, although the negative impact of being male is not statistically significant in West Germany. The negative impact of ageing on individual (perceived) happiness level also does not vary across the categories of individual (perceived) happiness, as is the case for the coefficients of employment status. Age has a negative impact on individual (perceived) happiness level in both countries. One-category change in employment status reduces individual (perceived) happiness levels along the cuts. In contrast, the negative impact of one category change in perceived trust (mistrust) varies across the cut points of individual (perceived) happiness, with the significant negative impact occurring at the lower individual (perceived) happiness levels (second cut) while being statistically insignificant at the first and the third cuts. It could be said that the odds of being unhappy are 0.59 times higher in the second cut compared to the other cuts. The coefficients for marital status also vary across the cut points of individual (perceived) happiness levels, meaning that one-category change in marital status decreases individual (perceived) happiness levels at all categories of individual (perceived) happiness, although it has a greater negative impact at lower individual (perceived) happiness levels (third and fourth cut) than the first and the second cut. That is, there is a positive relationship between marriage and individual (perceived) happiness in West Germany.
Table 5 Regression Analysis Results for West Germany
Dependent variable: happiness (very happy = 1, 2, 3, 4 = not at all happy)
Generalized ordered logit model
Model 1 Model 2 Model 3
1 vs 2 + 3 + 4 1 + 2 vs 3 + 4 1 + 2 + 3 vs 4
Obs. coef. BT. std. err. Obs. coef. BT. std. err. Obs. coef. BT. std. err.
Perceived income Perceived trust Gender Age Marital status Employment status Constant -0.6160980*** -0.2270544*** -0.0838106*** -0.0142891*** -0.1230602*** -0.0412003*** -0.1111025*** 0.0210106 0.1548415 0.0957181 0.0029513 0.0372053 0.0223259 0.2865486 -0.6160980*** -0.5926505*** -0.0838106*** -0.0142891*** -0.2787740*** -0.0412003*** -4.0250750*** 0.0210106 4.7305200 0.0957181 0.0029513 0.0952749 0.0223259 0.3108771 -0.6160980*** -2.2359310*** -0.0838106*** -0.0142891*** -0.4548810*** -0.0412003*** -10.121050*** 0.0210106 4.7305200 0.0957181 0.0029513 0.0952749 0.0223259 9.5364000
Notes: * indicates p < 0.10 level of significance. ** indicates p < 0.05 level of significance. *** indicates p < 0.01 level of
significance. BT refers to bootstrap. “Obs.” is an abbreviation of “observed”.
Source: Authors’ calculations.
2.5.2 Robustness Checks of the Model
Since the “autofit” option cannot be used while using the bootstrapping method, we examined the model with “auto” option and found bootstrapped standard errors. The reason we used bootstrapping was to evaluate the distribution of statistics based on random sampling (Weihua Guan 2003, p. 71). In this way, we obtained resamples (50 resamples for this model) from the original data in the sample used in contrast to the data from the population in the theoretical calculation based on the assumption that the sample used for the analysis is representative of the population (Guan 2003, p. 71). In
231 Perceived Happiness, Perceived Trust and Perceived Income Levels: The Case of the Reunified Germany
addition, the method is useful in correcting for a biased estimator (The Bootstrap 2011)5.
Along with these changes, we also calculated the marginal effects of the predic- tor variables used in our model. The table, which presents these results, reveals several differences from the base model. For instance, in East Germany, the marginal effect of perceived income was negative for the first and second categories of individual (per- ceived) happiness but positive for the third and fourth categories. However, it was in- significant for the second and the fourth categories of individual (perceived) happiness. The marginal effect of perceived trust was positive for the first and second categories of individual (perceived) happiness but negative for the third category and insignifi- cant for the fourth. The marginal effect of gender was insignificant while the marginal effect of age was positive for the first and second categories of individual (perceived) happiness but negative for the third and fourth categories. In the fourth category, the marginal effect of age was not statistically significant. The marginal effect of marital status was positive for the first and second categories of individual (perceived) happi- ness but negative for the third and fourth. In the fourth category, the marginal effect of marital status was insignificant. The marginal effect of employment status was nega- tive for the first category, positive for the second and negative for the third and fourth. In the fourth category, the marginal effect of employment status was not statistically significant.
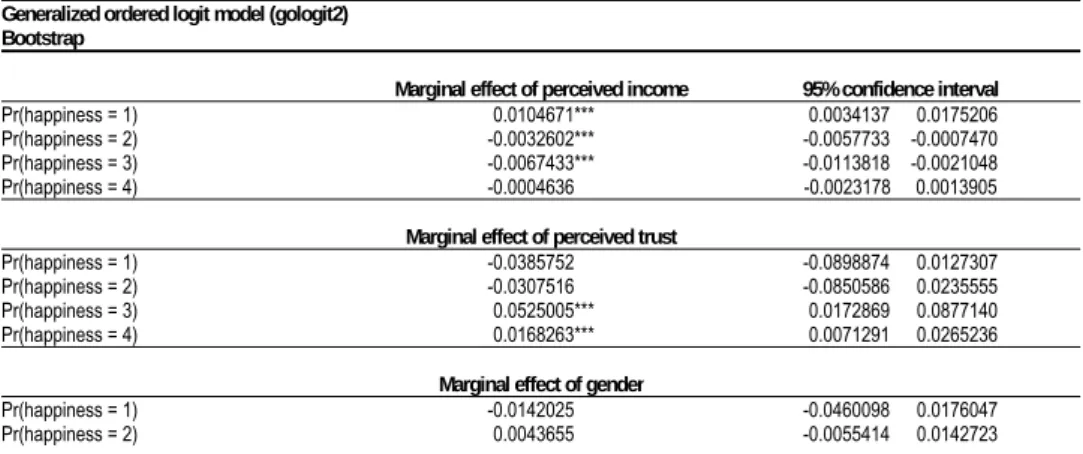
Although the results of the first three categories are significant, the reason con- fidence interval ranges from the negative point to the positive one could be because employment status had a low significance level in the first category. In West Germany, the marginal effect of perceived income was negative for the first category of individ- ual (perceived) happiness but positive for the second and the third categories. It was again negative in the fourth category; however, it was not statistically significant. The marginal effect of perceived trust was positive for the first and the second categories but negative for the third and fourth. In the first two categories, the marginal effect of perceived trust was not statistically significant. Gender had an insignificant marginal effect in West Germany. The marginal effect of age was positive for the first category of individual (perceived) happiness but negative for the others. In the fourth category, the marginal effect of age was statistically insignificant. The marginal effect of marital status was positive in the first and the second categories but negative for the third and the fourth. In the fourth category, the marginal effect of marital status was not statisti- cally significant. The reason confidence interval ranges from the negative to the posi- tive point in marital status in the fourth category of individual (perceived) happiness could be because it had low significance level compared to the 0.05 and 0.01 levels. The marginal effect of employment status was positive in the first category but nega- tive for the second and the third categories and insignificant for the fourth. The reason confidence interval ranges from the negative to the positive point in employment status could be because it had low significance level compared to the 0.05 and 0.01 levels.
232 Meltem Şengün Ucal and Simge Günay
Table 6 Marginal Effects of the Variables Used in the Model on Individual (Perceived) Happiness
Levels in East Germany
Generalized ordered logit model (gologit2) Bootstrap
Marginal effect of perceived income 95% confidence interval
Pr(happiness = 1) Pr(happiness = 2) Pr(happiness = 3) Pr(happiness = 4) -0.0084506*** -0.0020992*** -0.0090525** -0.0014973*** -0.0011746 -0.0157265 -0.0005395 -0.0047379 -0.0177804 -0.0003245 -0.0052997 -0.002305
Marginal effect of perceived trust
Pr(happiness = 1) Pr(happiness = 2) Pr(happiness = 3) Pr(happiness = 4) -0.0528601*** -0.1293666*** -0.1397270*** -0.0424998*** -0.079818 -0.0259023 -0.1799099 -0.0788234 -0.0243776 -0.2550764 -0.0703218 -0.1553214
Marginal effect of gender
Pr(happiness = 1) Pr(happiness = 2) Pr(happiness = 3) Pr(happiness = 4) -0.0094109*** -0.0023987*** -0.0101307*** -0.0016789*** -0.0378771 -0.0190553 -0.0098495 -0.0050521 -0.0202316 -0.0404929 -0.0051541 -0.0085119
Marginal effect of age
Pr(happiness = 1) Pr(happiness = 2) Pr(happiness = 3) Pr(happiness = 4) -0.0015082*** -0.0003746*** -0.0016156*** -0.0002672*** -0.0022912 -0.0007252 -0.0007217 -0.0000276 -0.0005518 -0.0026794 -0.0003749 -0.0009093
Marginal effect of marital status
Pr(happiness = 1) Pr(happiness = 2) Pr(happiness = 3) Pr(happiness = 4) -0.0145982*** -0.0036263*** -0.0156379*** -0.0025866*** -0.0210327 -0.0081637 -0.0066141 -0.0006386 -0.0056051 -0.0256708 -0.0033287 -0.0085019
Marginal effect of employment status
Pr(happiness = 1) Pr(happiness = 2) Pr(happiness = 3) Pr(happiness = 4) -0.0057935*** -0.0319267*** -0.0230164*** -0.0031168*** -0.0009359 -0.0125228 -0.0415163 -0.0223371 -0.0119136 -0.0341192 -0.0053172 -0.0115508
Notes: * indicates p < 0.10, ** indicates p < 0.05, *** indicates p < 0.01 significance levels. Generalized ordered logit model,
the gologit2 version by Williams (2006a, b).
Source: Authors’ calculations.
Table 7 Marginal Effects of the Variables Used in the Model on Individual (Perceived) Happiness
Levels in West Germany
Generalized ordered logit model (gologit2) Bootstrap
Marginal effect of perceived income 95% confidence interval
Pr(happiness = 1) Pr(happiness = 2) Pr(happiness = 3) Pr(happiness = 4) -0.0104671*** -0.0032602*** -0.0067433*** -0.0004636*** -0.0034137 -0.0175206 -0.0057733 -0.0007470 -0.0113818 -0.0021048 -0.0023178 -0.0013905
Marginal effect of perceived trust
Pr(happiness = 1) Pr(happiness = 2) Pr(happiness = 3) Pr(happiness = 4) -0.0385752*** -0.0307516*** -0.0525005*** -0.0168263*** -0.0898874 -0.0127307 -0.0850586 -0.0235555 -0.0172869 -0.0877140 -0.0071291 -0.0265236
Marginal effect of gender
Pr(happiness = 1) Pr(happiness = 2) -0.0142025*** -0.0043655*** -0.0460098 -0.0176047 -0.0055414 -0.0142723
233 Perceived Happiness, Perceived Trust and Perceived Income Levels: The Case of the Reunified Germany
Pr(happiness = 3)
Pr(happiness = 4) --0.00920340.0006337****** -0.0114472 -0.0022430 --0.0298539 0.0035104
Marginal effect of age
Pr(happiness = 1) Pr(happiness = 2) Pr(happiness = 3) Pr(happiness = 4) -0.0024276*** -0.0007561*** -0.0015640*** -0.0001075*** -0.0034339 -0.0014213 -0.0003715 -0.0011407 -0.0007537 -0.0023743 -0.0003083 -0.0005234
Marginal effect of marital status
Pr(happiness = 1) Pr(happiness = 2) Pr(happiness = 3) Pr(happiness = 4) -0.0209072*** -0.0117031*** -0.0291871*** -0.0034232*** -0.0334789 -0.0083355 -0.0236857 -0.0002795 -0.0146241 -0.0437502 -0.0095560 -0.0164023
Marginal effect of employment status
Pr(happiness = 1) Pr(happiness = 2) Pr(happiness = 3) Pr(happiness = 4) -0.0069997*** -0.0021802*** -0.0045095*** -0.0003100*** -0.0143958 -0.0003964 -0.0002566 -0.0046170 -0.0003924 -0.0094114 -0.0009316 -0.0015517
Notes: * indicates p < 0.10, ** indicates p < 0.05, *** indicates p < 0.01 significance levels. Generalized ordered logit model,
the gologit2 version by Williams (2006a, b).
Source: Authors’ calculations.
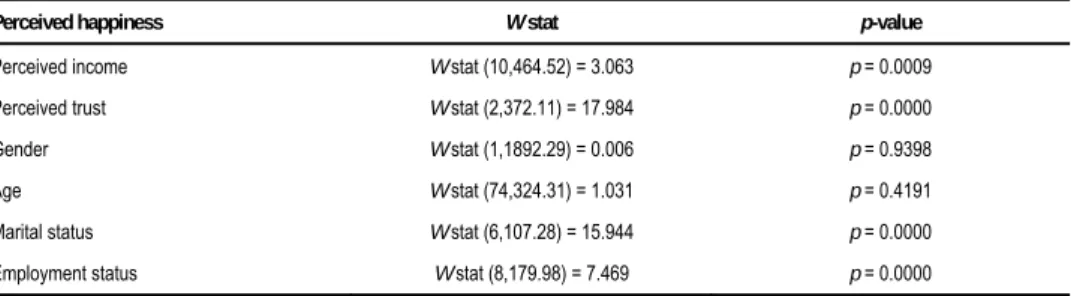
Finally, we tested our analysis for violation of the homogeneity of variance assumption (Institute for Digital Research & Education 2017). This showed gender in East Germany’s data to be problematic while gender and age were problematic in West Germany’s data (p values were greater than 0.05 significance level). The details are shown in Tables 8 and 9 in the Appendix.
3. Discussion
Our finding about the positive relationship between perceived income and individual (perceived) happiness in both East and West Germany is important in that it is con- sistent with Grazia M. Pittau, Roberto Zelli, and Andrew Gelman (2010, p. 357). Ac- cording to their study, personal income is more important for poorer regions than richer ones. Frijters, Haisken-DeNew, and Shields (2004, p. 734) also found a large effect of real household income on individual (perceived) happiness levels in East Germany. However, whereas they found that employment status significantly affects individual life satisfaction levels, we found that employment status had a significant effect only at lower individual (perceived) happiness levels in East Germany. In addition, contrary to their finding that being divorced or separated does not reduce individual (perceived) happiness, we found that one category change in marital status reduces individual (per- ceived) happiness levels in East Germany compared to the base model6. After applying
generalized threshold and sequential models to the German socio-economic panel data, Boes and Winkelmann (2004, p. 21) concluded that “money can somewhat buy happiness”. This finding is important for our study because we also used generalized ordered logit models for our analysis of the relationship between individual (perceived) happiness and perceived income levels. In another study, Easterlin and Anke Zimmer- mann (2006, p. 1) explored the relationship between life satisfaction and economic outcomes in Germany both before and after re-unification. They found that although
234 Meltem Şengün Ucal and Simge Günay
real incomes have increased since 1991, life satisfaction has increased in East Germany but decreased in West Germany. This decline in West Germany reversed a 7-year pe- riod of increasing life satisfaction prior to unification, which was experienced by Ger- man citizens, and European and Turkish nationals residing in Germany. Easterlin and Zimmermann (2006) reported a relationship mostly between income satisfaction and life satisfaction whereas the weakest association was between real income and life satisfaction. Ferrer-i-Carbonell (2005, p. 1008), who also explored the relationship between income and well-being in East and West Germany, found that individual well- being is impacted by income to a small degree with income having a larger impact on East Germans than West Germans because East Germany is poorer. They also found that relative income affects individual (perceived) happiness in both regions. Although our findings are similar to those of Frijters, Haisken-DeNew, and Shields (2004, p. 734), we did not find a large impact of income on individual (perceived) happiness, probably because we used perceived instead of real income, and also because percep- tions may be affected by different circumstances. Our results are somewhat similar to those of Ferrer-i-Carbonell (2005, p. 1008) in that perceived income has a larger im- pact on individual (perceived) happiness in East Germany than in West Germany. However, this impact is slightly different with regard to our regression analyses of East and West regions of Germany. On the other hand, our findings contradict those of Easterlin and Zimmermann (2006, p. 1) because we found a significant positive (alt- hough small) impact of perceived income on individual (perceived) happiness levels in both East and West Germany.
4. Conclusion
Individual (perceived) happiness studies have proliferated in diverse academic disci- plines, from philosophy to psychology, from sociology to political science and even to economics. Thus, individual (perceived) happiness can be investigated by using many different approaches, such as considering its meaning from past to present, its deter- minants, and measurement (modelling) methods.
The literature indicates that there is disagreement regarding the relationship be- tween income and life satisfaction whereas there is a consensus regarding the relation- ship between unemployment and life satisfaction (Frijters, Haisken-DeNew, and Shields 2004, p. 730). Given this background, one of our purposes in this study was to explore whether any change will happen when examining the relationship between “perceived” income levels and individual (perceived) happiness in the East and the West regions of Germany.
In this study, we explored the relationship between perceived income levels of individuals and their individual (perceived) happiness levels depending on whether they live in East or West Germany, using generalized ordered logit modelling for the analysis. For both regions, we predicted a positive relationship between individual (perceived) happiness and perceived income levels; a positive relationship between individual (perceived) happiness and perceived trust; a negative relationship between individual (perceived) happiness and age; a positive relationship between individual (perceived) happiness and marriage; a positive relationship between individual (per- ceived) happiness and being female; and a positive relationship between individual
235 Perceived Happiness, Perceived Trust and Perceived Income Levels: The Case of the Reunified Germany
(perceived) happiness and having a full-time job. Our analysis showed that perceived income significantly increases individual (perceived) happiness, although this impact is not as strong as the impact of perceived trust. However, this finding may be due to the use of perceived levels of income in that the significance of the effect varies ac- cording to the model. That is, the first model indicates individual (perceived) happiness category 1 versus 2 + 3 + 4; the second model indicates category 1 + 2 versus 3 + 4; the third model indicates 1 + 2 + 3 versus 4. Note also that gender had no significant impact on individual (perceived) happiness in both regions while employment status (moving away from full-time employment) had a significant negative impact on indi- vidual (perceived) happiness in East Germany, but only at lower individual (perceived) happiness levels, with 0.01 and 0.05 significance levels, respectively. The impact of one-category change in employment status was not statistically significant for the first and second cuts in the West region of Germany but significant at p < 0.10 at the third cut.
Further research using different data sets with the help of a diverse range of studies from different disciplines will be extremely helpful for revealing new linkages and patterns regarding the determinants of individual (perceived) happiness.
236 Meltem Şengün Ucal and Simge Günay
References
Alesina, Alberto, Rafael Di Tella, and Robert MacCulloch. 2004. “Inequality and
Happiness: Are Europeans and Americans Different?” Journal of Public Economics, 88(9): 2009-2042. http://dx.doi.org/10.1016/j.jpubeco.2003.07.006
Amiel, Yoram. 1999. “The Subjective Approach to the Measurement of Income Inequality.”
In Handbook of Income Inequality Measurement, ed. Jacques Silber, 227-243. Berlin: Springer. http://dx.doi.org/10.1007/978-94-011-4413-1_8
Bjornskov, Christian. 2006. “The Multiple Facets of Social Capital.” European Journal of Political Economy, 22(1): 22-40. http://dx.doi.org/10.1016/j.ejpoleco.2005.05.006 Blanchflower, David G., David N. F. Bell, Alberto Montagnoli, and Mirko Moro. 2014.
“The Happiness Trade-Off between Unemployment and Inflation.” Journal of Money,
Credit and Banking, 46(S2): 117-141. http://dx.doi.org/10.1111/jmcb.12154 Boes, Stefan, and Rainer Winkelmann. 2004. “Income and Happiness: New Results from
Generalized Threshold and Sequential Models.” Institute for the Study of Labor Discussion Paper 1175.
Boes, Stefan, and Rainer Winkelmann. 2006. “Ordered Response Models.” In Modern Econometric Analysis: Survey on Recent Developments, ed. Olaf Hübler and Jachim
Frohn, 167-181. Berlin: Springer. http://dx.doi.org/10.1007/3-540-32693-6_12
Burda, Michael C. 2013. “The East German Economy in the Twenty-First Century.” In The East German Economy, 1945-2010: Falling Behind or Catching Up?, ed. Hartmut
Berghoff and Uta Andrea Balbier, 1945-2010. Cambrigde, MA: Cambridge University Press.
Caporale, Guglielmo Maria, Yannis Georgellis, Nicholas Tsitsianis, and Ya Ping Yin.
2009. “Income and Happiness across Europe: Do Reference Values Matter?” Journal
of Economic Psychology, 30(1): 42-51. http://dx.doi.org/10.1016/j.joep.2008.06.004 Clark, Andrew E., and Andrew J. Oswald. 1996. “Satisfaction and Comparison Income.”
Journal of Public Economics, 61(3): 359-381.
http://dx.doi.org/10.1016/0047-2727(95)01564-7
Cruces, Guillermo, Ricardo Perez-Truglia, and Martin Tetaz. 2013. “Biased Perceptions
of Income Distribution and Preferences for Redistribution: Evidence from a Survey Experiment.” Journal of Public Economics, 98(C): 100-112.
http://dx.doi.org/10.1016/j.jpubeco.2012.10.009
Delhey, Jan, and Kenneth Newton. 2003. “Who Trusts? The Origins of Social Trust in
Seven Societies.” European Societies, 5(2): 93-137. http://dx.doi.org/10.1080/1461669032000072256
Diener, Ed, and Robert Biswas-Diener. 2002. “Will Money Increase Subjective
Well-Being?” Social Indicators Research, 57(2): 119-169. http://dx.doi.org/10.1023/A:1014411319119.
Easterlin, Richard A. 1974. “Does Economic Growth Improve the Human Lot? Some
Empirical Evidence.” In Nations and Households in Economic Growth: Essays in
Honor of Moses Abramovitz, ed. Paul A. David and Melvin W. Reder, 89-125. New
York: Academic Press. http://dx.doi.org/10.1016/B978-0-12-205050-3.50008-7
Easterlin, Richard A., and Anke Zimmermann. 2006. “Life Satisfaction and Economic
Outcomes in Germany Pre- and Post-Unification.” Institute of Economic Policy Research Working Paper 06.58.
237 Perceived Happiness, Perceived Trust and Perceived Income Levels: The Case of the Reunified Germany
Ferrer-i-Carbonell, Ada. 2005. “Income and Well-Being: An Empirical Analysis of the
Comparison Income Effect.” Journal of Public Economics, 89(5): 997-1019. http://dx.doi.org/10.1016/j.jpubeco.2004.06.003
FitzRoy, Felix R., Michael A. Nolan, Max F. Steinhardt, and David Ulph. 2014. “Testing
the Tunnel Effect: Comparison, Age and Happiness in UK and German Panels.” IZA
Journal of European Labor Studies, 3(24): 1-30.
http://dx.doi.org/10.1186/2193-9012-3-24
Frijters, Paul, John P. Haisken-DeNew, and Michael A. Shields. 2004. “Money Does
Matter! Evidence from Increasing Real Income and Life Satisfaction in East Germany Following Reunification.” The American Economic Review, 94(3): 730-740.
http://dx.doi.org/10.1257/0002828041464551
Fu, Vincent K. 1999. “Estimating Generalized Ordered Logit Models.” Stata Technical Bulletin, 8(44).
Grace-Martin, Karen. 2017. “Generalized Ordinal Logistic Regression for Ordered
Response Variables.” http://www.theanalysisfactor.com/generalized-ordinal-logistic regression/ (accessed March 25, 2017).
Graham, Carol. 2011. The Pursuit of Happiness: An Economy of Well-Being. Washington,
DC: Brookings Institution Press.
Guan, Weihua. 2003. “From the Help Desk: Bootstrapped Standard Errors.” The Stata Journal, 3(1): 71-80.
Gudmundsdottir, Dora G. 2013. “The Impact of Economic Crisis on Happiness.” Social Indicators Research, 110(3): 1083-1101. http://dx.doi.org/10.1007/s11205-011-9973-8 Hosmer Jr., David, and Stanley Lemeshow. 2000. “Introduction to the Logistic Regression
Model.” In Applied Logistic Regression, ed. Walter A. Shewhart and Samuel S. Wilks, 1-30. New York: John Wiley. http://dx.doi.org/10.1002/0471722146.ch1
Institute for Digital Research & Education. 2017. “Using Stata to Deal with Violations of
The Homogeneity of Variance Assumption in ANOVA.” http://www.ats.ucla.edu/stat/stata/library/homvar.htm.
Jancewicz, Barbara. 2016. “Measurement of Income Inequality Re-examined Constructing
Experimental Tests by Questionnaire.” Myśl ekonomiczna i polityczna, 2(53): 17-42.
Kushlev, Kostadin, Elizabeth W. Dunn, and Richard E. Lucas. 2015. “Higher Income Is
Associated with Less Daily Sadness but Not More Daily Happiness.” Social
Psychological and Personality Science, 6(5):483-489.
http://dx.doi.org/10.1177/1948550614568161
Leung, Ambrose, Cheryl Kier, Tak Fung, Linda Fung, and Robert Sproule. 2011.
“Searching for Happiness: The Importance of Social Capital.” Journal of Happiness
Studies, 12(3): 443-462. http://dx.doi.org/10.1007/s10902-010-9208-8
Liu, Xing, and Hari Koirala. 2012. “Ordinal Regression Analysis: Using Generalized
Ordinal Logistic Regression Models to Estimate Educational Data.” Journal of
Modern Applied Statistical Methods, 11(1): 242-254.
Maffioletti, Anna, Agata Maida, and Francesco Scacciati. 2014. “More Terminological
and Methodological Problems in Measuring Happiness, Life Satisfaction and Well-Being: Some First Empirical Results.” In The Pursuit of Happiness and the Traditions
of Wisdom, 13-21. Berlin: Springer. http://dx.doi.org/10.1007/978-3-319-04744-7_2 Noll, Heinz Herbert, and Stefan Weick. 2010. “Subjective Well-Being in Germany:
Evolutions, Determinants and Policy Implications. In Happiness and Social Policy in
238 Meltem Şengün Ucal and Simge Günay
Oshio, Takashi, Kayo Nozaki, and Miki Kobayashi. 2011. “Relative Income and Happiness
in Asia: Evidence from Nationwide Surveys in China, Japan, and Korea.” Social
Indicators Research, 104(3): 351-367. http://dx.doi.org/10.1007/s11205-010-9754-9 Perez-Truglia, Ricardo. 2015. “A Samuelsonian Validation Test for Happiness Data.”
Journal of Economic Psychology, 49(C): 74-83.
http://dx.doi.org/10.1016/j.joep.2015.05.002
Petrunyk, Inna, and Christian Pfeifer. 2016. “Life Satisfaction in Germany after
Reunification: Additional Insights on the Pattern of Convergence.” Jahrbücher Für
National Ökonomie Und Statistik, 236(2): 217-239.
http://dx.doi.org/10.1515/jbnst-2015-1010
Pittau, Grazia M., Roberto Zelli, and Andrew Gelman. 2010. “Economic Disparities and
Life Satisfaction in European Regions.” Social Indicators Research, 96(2): 339-361. http://dx.doi.org/10.1007/s11205-009-9481-2
Putnam, Robert D. 2000. “Bowling Alone: America’s Declining Social Capital.” In Culture and Politics, ed. Lane Crothers and Charles Lockhart, 223-234. London: Palgrave
Macmillan. http://dx.doi.org/10.1007/978-1-349-62397-6_12
Rothstein, Bo. 2010. “Corruption, Happiness, Social Trust and the Welfare State: A Causal
Mechanisms Approach.” Quality of Government Working Paper 9.
Ruprah, Inder J., and Pavel Luengas. 2011. “Monetary Policy and Happiness: Preferences
over Inflation and Unemployment in Latin America.” Journal of Socio-Economics, 40(1): 59-66. http://dx.doi.org/10.1016/j.socec.2010.08.001
Smolny, Werner. 2012. “Cyclical Adjustment, Capital-Labor Substitution and Total Factor
Productivity Convergence - East Germany after Unification.” Journal of Economics
and Statistics, 232(4): 445-459. http://dx.doi.org/10.1515/jbnst-2012-0405 Torres-Reyna, Oscar. 2012. “Getting Started in Logit and Ordered Logit Regression.”
https://www.princeton.edu/~otorres/Logit.pdf.
Ucal, Meltem Şengün. 2006. “Ekonometrik Model Seçim Kriterleri Üzerine Kısa Bir
İnceleme. http://eskidergi.cumhuriyet.edu.tr/makale/1327.pdf.
Uslaner, Eric M. 2002. The Moral Foundations of Trust. Cambridge, MA: Cambridge
University Press.
Van Praag, Bernard M. S., and Ada Ferrer-i-Carbonell. 2011. Happiness Economics: A New Road to Measuring and Comparing Happiness. Boston: Now Publishers Inc. Williams, Richard. 2006a. “Generalized Ordered Logit/Partial Proportional Odds Models for
Ordinal Dependent Variables.” Stata Journal, 6(1): 58-82. http://dx.doi.org/10.1177/1536867X0600600104
Williams, Richard. 2006b. “Interpreting and Using Heterogeneous Choice and Generalized
Ordered Logit Models.” Paper presented at the North American Stata Users’ Group Meeting, Boston.
Winkelmann, Rainer. 2009. “Unemployment, Social Capital, and Subjective Well-Being.” Journal of Happiness Studies, 10(4): 421-430.
http://dx.doi.org/10.1007/s10902-008-9097-2
Winkelmann, Rainer. 2014. “Unemployment and Happiness.” Institute for the Study of
Labor Working Paper 94. http://dx.doi.org/10.15185/izawol.94
Yemişcigil, Ayça, and Paul Dolan. 2015. “‘Mutluluk’ Nedir, Nasıl Ölçülür? Kalkınma
Literatüründe Teorik ve Metodolojik Yaklaşımlar.” In İktisatta Davranışsal
Yaklaşımlar, ed. Devrim Dumludağ, Özge Gökdemir, Levent Neyse, and Ester Ruben,
239 Perceived Happiness, Perceived Trust and Perceived Income Levels: The Case of the Reunified Germany
Appendix
Table 8 Homogeneity Test (W stat) for East Germany
Perceived happiness W stat p-value
Perceived income W stat (10,268.03) = 3.799 p = 0.0001
Perceived trust W stat (2,202.34) = 31.438 p = 0.0000
Gender W stat (2,5329.45) = 0.108 p = 0.8976
Age W stat (73,367.00) = 1.508 p = 0.0081
Marital status W stat (6,66.71) = 9.483 p = 0.0000
Employment status W stat (8,189.84) = 8.975 p = 0.0000
Source: Authors’ calculations.
Table 9 Homogeneity Test (W stat) for West Germany
Perceived happiness W stat p-value
Perceived income W stat (10,464.52) = 3.063 p = 0.0009
Perceived trust W stat (2,372.11) = 17.984 p = 0.0000
Gender W stat (1,1892.29) = 0.006 p = 0.9398
Age W stat (74,324.31) = 1.031 p = 0.4191
Marital status W stat (6,107.28) = 15.944 p = 0.0000
Employment status W stat (8,179.98) = 7.469 p = 0.0000
240 Meltem Şengün Ucal and Simge Günay