Investigating the effect of indoor soundscaping towards employee’s speech privacy
6
0
0
Tam metin
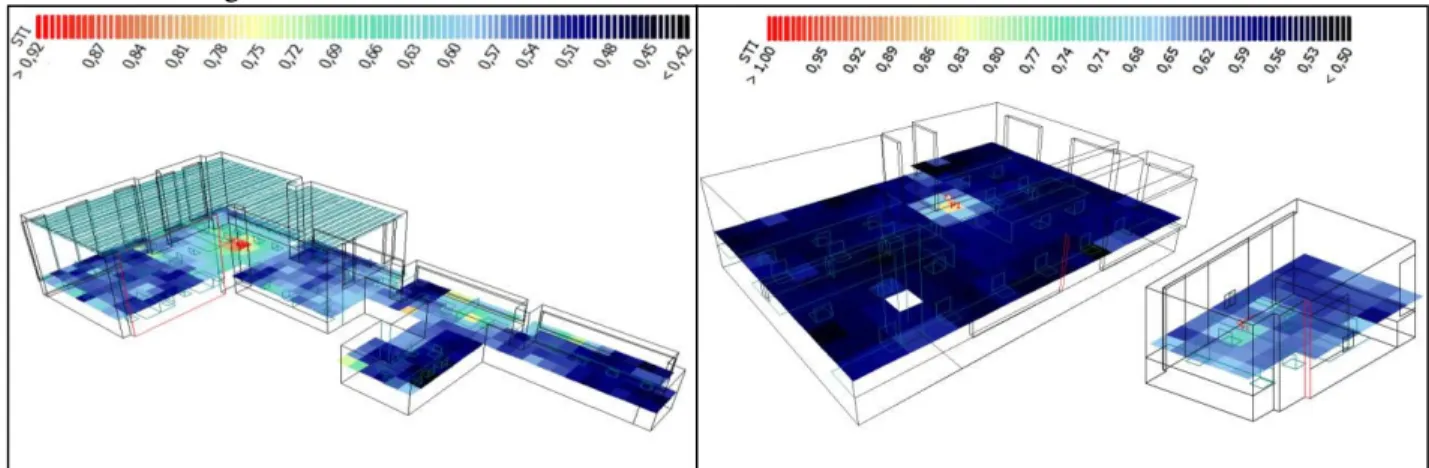
(2) V. Acun et al.: Investigating.... EuroNoise 2015 31 May - 3 June, Maastricht. apartment building, with 2 floors used as an office space and rest as service and management floors. The office floors consists of; one central open office space (E1), a subspace (E2) which is the office of structural design team and rooms for project leaders. Required permissions are obtained from the relevant department of companies.. 2.2. Objective Measurements In order to analyze the acoustical characteristics of the office spaces, a combination of in-situ measurements and Odeon Room Acoustics Software are used. Measurements are done during working hours using Bruel & Kjaer Sound Level Meter type 2230. Sound level meter is placed at central locations of both offices at the height of 125cm and measured over 15 minute time intervals. Odeon Room Acoustics Software is used to measure Reverberation Time (RT) and Speech Transmission Index (STI).. 2.3. Subjective Measurements Thematic analysis, as part of grounded theory is used to create a conceptual model that reflects HPSOR\HH¶V SHUFHSWLRQ RI WKHLU ZRUN HQYLURQPHQW Semi structured interviews are conducted with 25 employees from Company A with 24 employees from Company E as the collected data no longer produced significant conceptual variations [6][7]. This paper uses random sample of 10 employees per office. An interview schedule is prepared DFFRUGLQJ WR FRPSDQLHV¶ ZRUNORDG ,QWHUYLHZ process lasted for 2 working days at both companies. Interviews are held at meeting rooms and their duration varied between 6-17 minutes. All interviews are recorded and transcribed. Transcriptions are manually coded to derive themes and categories.. Figure 1. Reverberation times (RT30) between 125 HZ and 8000 HZ in Architecture Company (A), main office space (E1) and Subspace (E2) of Engineering Company.. 3. Results and Discussion 3.1. Objective Results In order to get clear results from ODEON Room Acoustics Software, &RPSDQ\ (¶V office space is divided into two separate models. One model for the main open office space (E1) and the other for the subspace (E2). Reverberation times for all spaces can be seen at Figure 1 and STI values can be seen at Figure 2. Mean Continuous A weighted sound levels (Leq(A)) are 0,54 dBA at Company A, 0,58 at main office space of Company E (E1) and 0,64 at subspace of Company E (E2). These results are used to give an idea about the acoustical characteristic of office space which can help with the comparisons of two offices.. Figure 2. Odeon simulation showing the STI values of Architecture Company (A) , main office space (E1) and Subspace (E2) of Engineering Company.. 2462.
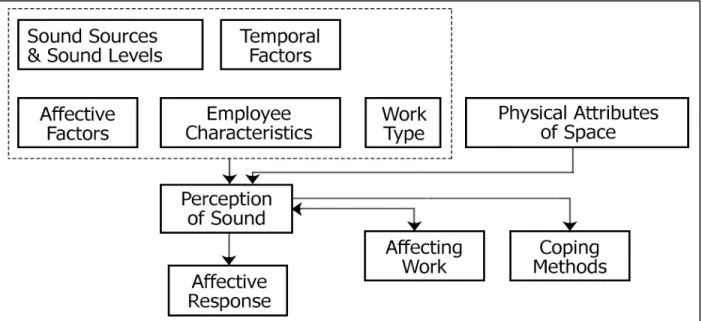
(3) EuroNoise 2015 31 May - 3 June, Maastricht. V. Acun et al.: Investigating.... seating arrangement at Company E which placed relevant departments together, such as structural engineering and design departments. Some employees reflect that with this recent change people started to engage in group conversation much more often. Even though this rearrangement seemed to be done to increase efficiency, due to the probable increase in sound levels, employees who prefer silence reflected negative feelings about it.. Figure 3. Conceptual Model shows the patterns between themes. 3.2. Subjective Results Interview transcriptions are analyzed to derive themes. These themes are searched for patterns which rearranged the themes into Main themes and categories. During this process irrelevant themes are eliminated. Based on the patterns, a conceptual model is created which is used to understand HPSOR\HHV¶ perception of his workspace and its effects on speech privacy.. Employees of Company E also reported that conversation sounds coming from the meeting rooms and the management floor to be most dominant sound (n=7). It has been observed that employees expressed this regardless of their location and proximity to the meeting rooms. When they were asked, what they expect to hear in their work space most of the employees said that they expect to hear speech. From this point on, discussion will include direct quotations from HPSOR\HHV¶ responses, to show their perception explicitly. Study aimed to compare two open offices spaces and construct a conceptual model for each one of them as they were expected to be different from each other. However, analyses of the data showed similar patterns for both of the offices. Therefore one conceptual model is generated for both cases (Figure 3). This analysis of data revealed 10 themes (Table 2) which are divided into 29 categories.. 3.2.1. Auditory Environment. Perception. of. A (Employee of Company A): , GRQ¶W NQRZ ZKDW WKH ideal is but I think I expect to hear human dialogue, which is the ideal sound for me, not a printer sound.. Work. In order to investigate the soundscape quality of their work environment employees of both companies are asked what they expect to hear and briefly list the sound sources within their work environment. These sound sources can be seen at table 1.. Interviews showed that second most frequent sound sources are mechanical sounds such as computer fans and printers. As it was expected, all employees seated near the printer room at Company E reported that they expect to hear the sound of printer while those seated away from the printer room barely mentioned about it.. Employees answers revealed that the most frequently perceived sound sources are different for offices both offices. Employees of Company A reported phone conversations to be the most frequent sound (n=6) while employees of Company E reported Group Conversation (n=8). At this point it should be added that, recently there have been a new. E (Employee of Company E): As the printer is right around the corner its sound is associated with office LQ P\ PLQG :KHQ , GRQ¶W KHDU WKH QRLVH RI SULQWHU ,¶P WKLQNLQJ LI LW¶V EURNHQ RU VRPHWKLQJ. 2463.
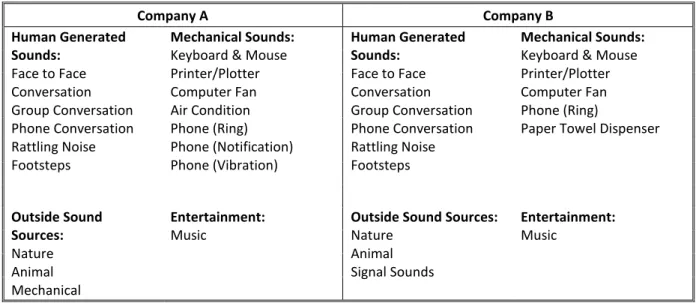
(4) V. Acun et al.: Investigating.... EuroNoise 2015 31 May - 3 June, Maastricht. Company A Human Generated Mechanical Sounds: Sounds: Keyboard & Mouse Face to Face Printer/Plotter Conversation Computer Fan Group Conversation Air Condition Phone Conversation Phone (Ring) Rattling Noise Phone (Notification) Footsteps Phone (Vibration). Company B Human Generated Mechanical Sounds: Sounds: Keyboard & Mouse Face to Face Printer/Plotter Conversation Computer Fan Group Conversation Phone (Ring) Phone Conversation Paper Towel Dispenser Rattling Noise Footsteps. Outside Sound Sources: Nature Animal Mechanical. Outside Sound Sources: Nature Animal Signal Sounds. Entertainment: Music. Entertainment: Music. On contrary, two employees reflected negative feeling about this source. But it also shows that there is an underlying theme beneath their perception of this source. For example:. Table 1. Sound sources perceived by employees. E: This is a planning office there should be a buzzing sound, for example computer. There should be background sound, printers or plotters should work.. A: The colleague working next to me uses the keyboard very roughly. He types like he is punching the keyboard which disturbs me a lot.. When they were asked to differentiate sounds as positive and negative, some employees of Company E reported ringing of a certain telephone to be the most disturbing sound within their work environment.. E: When someone is typing an angry email or trying to rush a job, they type really really hard which breaks all my concentration.. E: There is a phone here which has a different sound then others. Its sound is the most disturbing thing ever.. These examples indicate some of the factors that affect HPSOR\HHV¶ perception of sound sources. Regular typing sound is perceived positive or neutral, but when it is combined with affective factors such as anger or rushing the job it can be perceived as negative. Same situation applies to other cases also. Employees of both offices consider speech as positive (n=7) or neutral (n=4). But when speech becomes a group conversation or yelling at each other, it becomes negative source. Unfortunately, some of the employees of Company E associated yelling with their work environment.. E: :HOO , GRQ¶W JHW DQQR\HG E\ VRXQGV HDVLO\ Eut there is this telephone whose sound is quite annoying. 7KLV GRHVQ¶W ULQJ YHU\ RIWHQ WKDQNIXOO\ As it can be seen from these examples, sound of this phone is perceived as same as the way signal sounds do which is introduced by Schafer [8]. An interesting finding is employees from both offices listed the sound of keyboard and mouse as positive sound (n=4) and said that they expect to hear it within their work environment (n=6). Employees expressed that the sound of keyboard and mouse means that they are working at that moment, there are other people around, they are not working alone and not working overtime. An employee even said that it motivates her.. E: When I think about this space, yelling is the first thing that comes into my mind. This is tense environment. E: When people at meeting rooms or the upper floor (management floor) yell at each other we can directly hear it. A: Conversations disturb me. Sometimes 3-5 people gather around and start talking which disturbs me. A WKLQJ WKDW \RX GRQ¶W SDUWLFLSDWH WHQGV WR GLVWXUE \RX. E: Well as for the positive ones, keyboard sound GRHVQ¶W DIIHFW PH QHJDWLYHO\ ,W VKRZV WKDW WKHUH LV work. Sometimes when I slow down it even motivates me.. 2464.
(5) EuroNoise 2015 31 May - 3 June, Maastricht. V. Acun et al.: Investigating.... something they GRQ¶W OLNH PXVLF EHFRPHV D PDMRU negative sound source.. Sound Sources: Sounds that contribute to soundscape. A: It is very important what is playing. ,I LW¶V VRPHWKLQJ , GRQ¶W OLNH LW¶V EHWWHU WR KDYH QR PXVLF at all.. Affective Factors Emotional Factor that affect employees perception. Further investigation of this situation revealed that when employees said they preferred music, what they actually meant was, they preferred hear their own music. 18 out of 20 employees said that they are using earphones while they work. Responses indicate that using earphones is much more than just listening to music. Employees are using earplugs to isolate themselves, to cope with speech interference, to cope with high sound levels and even with low sound levels. In some extreme situations it has been stated that employees leave their workstation in order to avoid the sound levels.. Temporal Factors Comments about duration or frequency of actives Perception of Sound Employees perception of sound sources Employee Characteristics Comments regarding personal preference or behavioral tendency Coping Methods Comments related to coping methods developed by employees. A: Sometimes it gets so noisy that I feel like just to go and get a tea just to avoid exposure to sound for a while.. Affecting Work Performance Comments showing effect of sound towards work performance Job Type Employees comments regarding his work. A: Sometimes this place gets very noisy, but we deal with it using earphones. Sometimes I keep them on even without music.. Physical Attributes of Space Physical features of space affecting employees perception. E: When it gets really silent it bothers, it feels like there is a distance between us and everything I do is creates a noise. It bothers me so much that I put on earphones.. Affective Response Employees emotional response to soundscape. Results showed that employees use earplugs for two main reasons; to isolate themselves from their workplace and when they want to listen to music. It has been also found that employees tends to react more positively towards semantic sound sources, such as music and speech, when they are performing visual based tasks. On contrary, employees performing semantic tasks stated a negative attitude towards nearly all kinds of sound sources and preferred absence of sound.. Table 2. Themes derived from the interviews.. When they are asked what they prefer to hear, vast majority of employees from both offices said that they prefer to hear music (n=17). However, using music as source of background sound is a problematic situation. Company E already has central music broadcast available but even though employees preferred to hear music in theory, they do not prefer to do so in practice. They do not use the central broadcast system unless they leave their workstations for lunch. Some of the new employees are not even aware that there is a music broadcast.. Findings indicate that, other than some behavioral tendencies, employees are uncomfortable with low sound levels nearly as much as they are with high sound levels. Due to lack of background sound, employees often expressed concern during silent periods which indicates problems with privacy. It has been mentioned that employees tend to reduce their voices in order to avoid disturbing others and due to speech privacy issues. Those who were working there for a shorter period of time are more concerned with speech privacy but in time they habituate and become far less concerned about it.. E: , ZRXOG SUHIHU PXVLF EXW , GRQ¶W NQRZ LI it would ZRUN , WKLQN LW¶V UHDOO\ KDUG WR LPSOHPHQW EHFDXVH LW¶V YHU\ hard for people to find a common ground. Reponses indicate that the main reason why people GRQ¶W ZDQW PXVLF EURDGFDVW LV EHFDXVH LW LV YHU\ KDUG to find a music genre that everybody would appreciate, even impossible. Employees say that genre of the music is very important; if it is. 2465.
(6) V. Acun et al.: Investigating.... EuroNoise 2015 31 May - 3 June, Maastricht. E: At the beginning I was bit concern. But after sometime I got used to it and started talking without being concerned about what third person would think.. Half of the employees of Company E stated that they are unhappy with acoustic. Their dissatisfaction are associated with materials and distribution of spaces. Observations also confirmed that there are very few absorbent surfaces. 10 cm plasterboard walls and door materials are very vulnerable to speech transmission. Even employees that are seated further away from the toilets said that they can hear the sound of paper towel dispenser which makes them feel like anyone can keep track of who goes to toilet. This situation causes both distraction and privacy concerns.. In general employees are not very concerned with speech privacy other than private conversation. In both offices, employees answer private phones in a location other than their workstation. In Company A, employees go outside to answer their phones, while in Company E there is a special room meant for this activity. The important point here is, in Company A, employees came up with this method of making private phone calls at outside. For Company E, it is a company rule to make every single private phone call at the telephone room and they express discomfort about it (n=7). On the other hand, only 2 employees, from Company A expressed discomfort. They did not express need of a telephone room also. This is very likely that it is their method of coping with lack of speech privacy as there is not enough background VRXQG DQG KDV D IDLU 67, — ,W should also be noted that when Company E dictates a special place to talk to phone, it is received more negatively than the actual problem, which is speech privacy. Responses imply that people like to have the freedom of answering their phones in their workstations regardless of speech privacy.. 4. Conclusion Study successfully created the lived experience of open-planed offices. Results confirm that auditory environment of a workplace cannot be properly evaluated by only using objective measurement. Responses of the employees indicate that there various different factors affecting HPSOR\HHV¶ perception of soundscape. Among all these factors, HPSOR\HHV¶ mood has significant effect on perception of soundscape. Further studies should be conducted to investigate this relationship which could lead to increased workplace satisfaction, work performance and even a more positive mood in general. References. E: It times you want to answer the phone without changing location. For example my mom calls, it could be an emergency, but the telephone hangs off before I get to the phone room.. [1] Kim, J., & de Dear, R. (2013). Workspace satisfaction: The privacy-communication trade-off in openplan offices. Journal of Environmental Psychology, 36, 1826. [2] Jahncke, H., Hongisto, V., & Virjonen, P. (2013). Cognitive performance during irrelevant speech: Effects of speech intelligibility and office-task characteristics. Applied Acoustics, 74(3), 307-316.. Even though, they are not as concerned with speech privacy as it was anticipated, they still expressed a need of background sound. As it was stated previously, too low sound levels cause concern and anxiety on employees. One employee from Company E explained this situation as:. [3] Brown, A. L., Kang, J., & Gjestland, T. (2011). Towards standardization in soundscape preference assessment. Applied Acoustics, 72(6), 387-392. [4] Mackrill, J. Cain, R., Jennings, P., (2013) Experiencing the hospital ward soundscape: Towards a model, Journal of Environmental Psychology, Vol. 36, pp. 1-8.. E: When its silent it feel like people are not bonding with each other, it feel like there is a conflict. If SHRSOH GRQ¶W FRPPXQLFDWH ZLWK HDFK RWKHU LW PHDQV there is no teamwork.. [5]Davies, W. et al., (2013) Perception of soundscape: An interdisciplinary approach. Applied Acoustics. Vol. 74, pp. 224-231. [6] Dey, I. (1999). Grounding grounded theory: Guidelines for qualitative inquiry. Academic Press.. At the end of the interview, employees are asked whether they are satisfied with the acoustical performance of their work space and if not why? 8 out of 10 employees working at Company A sated that even though there are some issues they are happy with the acoustics. Employees of Company E on the other hand, are very unsatisfied ZLWK WKHLU FRPSDQ\¶V acoustics and concerned with privacy. [7] Corbin, J., & Strauss, A. (1998). Basics of qualitative research: Techniques and procedures for developing grounded theory. Sage publications. [8] Schafer, R. M. (1977). The Soundscape: our sonic environment and the Turning of the world. Rochester, Vermont: Destiny Books.. E: I am not really sure if it only occurs during quite moments but when you talk with someone it can be head from all around the office. 2466.
(7)
Şekil
Benzer Belgeler
The German philosopher Immanuel Kant’s rendition of cosmopolitanism and the sublime have been quite popular separately in various discussions on politics and
Again, all of our financial market instruments clearly dominate Bayesian VAR–based forecasts of the federal funds rate, but this time the forecasting performance across our
Figure 1.1: Representation of current clinical decision in treatment of colorectal cancer based on conventional risk factors ...3 Figure 1.2: Survival graphs of colon cancer
Purpose: This study was conducted to evaluate the relationships of inner/outer segment (IS/OS) junction disruption, macular thickness, and epiretinal membrane (ERM) grade
(2002) kemoterapinin neden olduğu oral mukoziti önlemek için ağız bakım protokolü oluşturmak amacıyla, kemoterapi tedavisi uygulanan 6-17 yaş aralığındaki 14
MODELING USING MATRIX PENCIL METHODS 15 Figure 3.3: Mo deling 0.25 λ E φ data using MPM: real and imaginary parts of the data, mo del and absolute error.... Figure 3.4: Mo deling 0.25
This paper provides a comparative study on the different techniques of classifying human activities that are performed using body-worn miniature inertial and magnetic sensors..
In our study, we performed particle migration experiments with PS particles suspended in (II) deionized (DI) water as well as (IV) PEO-based neutral and (V) hyaluronic acid (HA)-
