PREDICTION OF PROGNOSIS AND CHEMOSENSITIVITY IN
GASTROINTESTINAL CANCERS
A DISSERTATION SUBMITTED TO
THE GRADUATE SCHOOL OF ENGINEERING AND SCIENCE
OF BILKENT UNIVERSITY
IN PARTIAL FULFILLMENT OF THE REQUIREMENTS FOR
THE DEGREE OF
DOCTOR OF PHILOSOPHY
IN
MOLECULAR BIOLOGY AND GENETICS
BY
SEÇİL DEMİRKOL
ii
PREDICTION OF PROGNOSIS AND CHEMOSENSITIVITY IN GASTROINTESTINAL CANCERS
By Seçil Demirkol December 2017
We certify that we have read this dissertation and that in our opinion it is fully adequate, in scope and in quality, as a thesis for the degree of Doctor of Philosophy.
____________________ Ali Osmay Güre (Advisor)
____________________ Özlen Konu Karakayalı
__________________ Bala Gür Dedeoğlu ____________________ Özgür Şahin ____________________ Ayşegül Üner
Approved for the Graduate School of Engineering and Science:
__________________ Ezhan Karaşan
iii
ABSTRACT
PREDICTION OF PROGNOSIS AND CHEMOSENSITIVITY IN GASTROINTESTINAL CANCERSBS
TRACT
Seçil Demirkol
Ph.D. in Molecular Biology and Genetics Supervisor: Ali Osmay Güre
December 2017
Colon and gastric cancers are the third and fifth cancer types with the poorest survival. Surgery is considered the primary treatment option, which can be curative. However the decision as to whether chemotherapy administration after surgery is needed, is critical for especially stage 2 colon cancer; since a group of patients who receive chemotherapy do not have significantly improved clinical outcome. For this purpose, clinical risk factors are currently evaluated to determine patients with a high risk of progression. However this is not standardized by guidelines yet. Therefore, in this thesis my first aim was to ex vivo validate two novel independent mRNA based biomarkers, ULBP2 and SEMA5A, which have been previously identified in our lab, and to generate a prognostic signature which could stratify colon cancer patients with differential prognostic profiles using the best stratification method. I showed that a 3-group prognostic signature, SU-GIB, based on expression of these two genes is associated with cancer-specific, disease-free, and overall survival independent of clinical confounding factors in colon cancer. I performed in silico analysis in order to understand the biological details of the prognostic distinction, and revealed that patients with poorer prognosis show higher expression of pro-inflammatory cytokines and a more mesenchymal profile. Patients with better clinical outcome exhibit a more epithelial profile with higher levels of phosphorylated EGFR and Shc proteins. Analysis of high-throughput drug cytotoxicity databases also showed that colon cancer cell lines with „Bad‟ SU-GIB signature are more sensitive to a dual PI3K-MTOR inhibitor, BEZ235.
In this thesis, my second goal was to define prognostic and molecular sub-groups for gastric cancer and characterize the specific biology of each sub-group. Utilizing an unsupervised approach on publicly available microarray data, I identified 3 biological groups, which harbor differential characteristics related to ECM involvement, EMT, proliferation and cell cycle. Moreover I identified distinct prognostic groups which are related to this molecular
iv classification which can further stratify patients with known pathologic subtypes (diffuse and intestinal).
I found that EMT was an important parameter for molecular and prognostic classifications for both types of cancers. I therefore, studied high-throughput drug cytotoxicity databases in order to identify selective compounds with selective growth inhibition on epithelial or mesenchymal cancer cells. I identified EGFR inhibitors as being significantly more effective on epithelial cancer cells regardless of the tissue type. My future plans include the large scale validation of SU-GIB, ex vivo validation of the gastric prognostic signature, and in vitro studies that would demonstrate effectivity of EGFR inhibitors on epithelial cancer cells and combination of EGFR inhibitors with MET inducers.
v
ÖZET
GASTROİNTESTİNAL KANSERLERDE PROGNOZ VE TEDAVİ CEVABI TAHMİNİ
1.1ABSTRACT
Seçil Demirkol
Moleküler Biyoloji ve Genetik, Doktora Tez Danışmanı: Ali Osmay Güre
Aralık 2017
Kolon ve mide kanserleri en kötü sağkalım görülen üçüncü ve beşinci kanser türleridir. Her iki kanserde de cerrahi rezeksiyon temel tedavi seçeneği olarak sunulmakta ve kuratif olabilmektedir. Ancak operasyon sonrası adjuvan kemoterapi ihtiyacı olup olmadığı kararı, özellikle evre 2 hastalar için önem arz etmektedir. Zira kemoterapi alan hastalardan bir kısmının prognozunda anlamlı bir iyileşme gözlenememektedir. Rekurans riski yüksek hastaları tahmin etmek amacıyla klinik risk faktörleri değerlendirilmektedir, ancak bu yaklaşım henüz standart bir uygulama haline getirilememiştir. Bu sebepten, bu tezde ilk amacım daha önce laboratuarımızda keşfi yapılmış olan iki özgün mRNA temelli biyobelirteci, ULBP2 ve SEMA5A,
ex vivo doğrulamak ve en iyi stratifikasyon metodunu kullanarak kolon kanseri hastalarını farklı
prognoz gösteren gruplara ayırabilecek bir genetik test oluşturmaktı. Bu genlerin ifadeleri temelli oluşturduğum 3-gruplu bir prognostik imzanın (SU-GIB) kanser spesifik, hastalıksız ve genel sağkalım ile klinik karıştırıcı faktörlerden bağımsız olarak ilişkili olduğunu gösterdim. Bu prognostik ayrımın biyolojik temellerini anlayabilmek için yaptığımız in siliko çalışmalar ile kötü prognozlu hastaların tümörlerinde proinflammatuar sitokinlerin ifadesinin arttığını ve daha mezenkimal bir profil sergilediklerini gösterdim. İyi prognozlu hastalarin tümörlerinin ise daha epitel bir profil gösterdiğini, ve EGFR ve Shc proteinlerinde de artmış fosforilasyon bulundurduklarını gözlemledim. Geniş ölçekli ilaç hassasiyet veri tabanlarının kullanarak yaptığım analizler ise „Kötü‟ SU-GIB imzasına sahip kolon kanserli hücrelerin ikili bir PI3K-MTOR inhibitörü olan BEZ235‟e daha hassas olduğunu gösterdi.
Bu tezdeki ikinci amacım mide kanserinde prognoztik ve moleküler grupları tanımlamak ve her alt-grubun kendine özel biyolojisini karakterize etmekti. Kullanıma açık mikroarray verisetlerine uyguladığımız yönlendirilmemiş yaklaşım ile ECM, EMT, proliferasyon ve hücre döngüsü ile alakalı farlılıklar içeren 3 biyolojik grup tanımladım. Buna ek olarak, bu moleküler
vi gruplar ile alakalı ve bilinen patolojik alt-grupları (difüz ve intestinal) da ayırabilen prognoztik gruplar tanımladım.
Çalışmalarımda EMT‟nin iki gastrointestinal kanser türünde de moleküler ve prognoztik tiplemeyle alakalı olan önemli bir parametre olduğu sonucuna vardım. Burdan yola çıkarak, epitel ve mezenkimal kanser hücreleri üzerinde seçici etkisi olabilecek bileşikleri bulmak amacıyla büyük ölçekli ilaç sitotoksisite verisetleri ile çalıştım. EGFR inhibitörlerinin epitel kanser hücreleri üzerinde, doku tipinden bağımsız ve istatistiksel olarak anlamlı şekilde daha etkili olduğunu gösterdim. Gelecekteki çalışma planlarımız dahilinde; SU-GIB‟nin büyük ölçekli doğrulanması, mide kanseri prognoztik imzasının ex vivo doğrulanması ve EGFR inhibitörlerinin epitel kanser hücreleri üzerinde MET indükleyen bileşiklerle kombine edilerek çalışılması yer almaktadır.
vii I dedicate my thesis to my family for their endless support and love…
viii
ACKNOWLEDGEMENTS
I would like express my sincere gratitude to my advisor Dr. Ali O. Güre for his endless patience, support and guidance during times of both success and failure. He always lead me to ways of finding the answer rather than giving me the answer directly which is the only way I believe to develop scientific thinking in the way to become an independent researcher. I also would like to thank my advisor for being the politest person I have ever known, and being understanding whenever I needed. I am grateful to his trust in me, which was very valuable to me.
I would like to thank my thesis progression committee members Dr. Özlen Konu and Dr. Bala Gür Dedeoğlu for their contributions and valuable insights in terms of science, and also their positivity and warm smiles which gave me relief in every committee presentation.
I thank Murat İşbilen who had irreplaceable contributions to my PhD study and for being always there when I needed help about R even after his studies finished in Bilkent.
I owe special thanks to my dear friends Şükrü, Mehdi, Seyhan, Barış, Alper, Gülçin and Waqas for the joy they brought to my daily lab routine. I also thank Pınar, Şahika, Damla and Bircan for their precious friendship; Zeynep for being more than a friend and all the wonderful memories together. I thank Özlem and Erdem for being a huge support even from overseas distances. The biggest thanks should go to my mother for letting me ask all the questions I had during my childhood, and her endless patience for trying to answer all my „Why‟s, which routed me to ask more questions in science. Without her, I definitely would not be here. I thank my father for his absolute faith in me and for being besides me whatever the decision I make during all these years. I am grateful to my dear uncle for always supporting me in my academic and non-professional life. I also would like to thank my sister for being a part of me during good and bad times. I owe many thanks to my fiancée for all his priceless love, patience and mental support. I thank TUBITAK BIDEB 2211 scholarship for their financial support during my PhD study.
ix
CONTENTS
1.
INTRODUCTION ... 1
1.1. Colon cancer survival - treatment ...1
1.2. Colon cancer clinical prognostic markers ...4
1.2.1. Major clinical factors ...4
1.2.2. Microsatellite stability ...5
1.2.3. Mutations ...5
1.3. Colon cancer prognostic gene lists ...6
1.4. In silico discovery of two novel prognostic genes for colon cancer ...8
1.5. ULBP2 and SEMA5A ...12
1.7. Gastric cancer statistics ...14
1.8. Gastric cancer heterogeneity ...14
1.9. Gastric cancer biomarkers ...15
1.10. EMT and cancer ...17
1.10.1. E-cadherin and Vimentin as epithelial and mesenchymal markers ...18
2.
AIM ... 19
3.
MATERIALS AND METHODS ... 20
3.1. MATERIALS ...20
3.1.1. General laboratory reagents ...20
3.1.2. General Lab Equipment ...21
3.1.3. Cell Culture Reagents ...21
3.1.4. General lab solutions ...21
3.1.5. Cell Culture Solutions ...22
3.1.6. Primers and probes ...22
3.1.7. In silico cohorts and datasets ...23
3.1.8. Ex vivo validation Cohort ...24
x
3.2.1. Cell Culture Methods ...24
3.2.2. General Lab Methods ...26
3.2.3. Bioinformatic Methods ...29
4.
RESULTS ... 33
4.1. NOVEL MRNA BASED BIOMARKERS OF PROGNOSIS AND TREATMENT IN COLON CANCER ...33
4.1.1. Analysis of ULBP2 and SEMA5A at multiple cut-offs and in stage 2&3 disease ...33
4.1.2. SSAT true positivity analysis ...37
4.1.3. Ex vivo validation of ULBP2 and SEMA5A gene expression in Turkish cohort ...39
4.1.4. Generation of „SU-GIB‟ prognostic signature ...40
4.1.5. SU-GIB based prognostic classification of MSI and MSS tumors ...45
4.1.6. Association SU-GIB with disease-free survival (DFS)...46
4.1.7. Comparison of SU-GIB with other molecular and prognostic classifiers ...51
4.1.8. Biological characteristics of SU-GIB groups ...54
4.1.9. Response to chemotherapeutics in SU-GIB groups ...58
4.2. NOVEL mRNA BASED BIOMARKERS OF PROGNOSIS IN GASTRIC CANCER ...60
4.2.1. Development of a methodology for the identification of prognostic genes in gastric cancer ...60
4.2.2. APPROACH 1 – Identification of prognostic groups in gastric cancer...62
4.2.3. APPROACH 2 – Identification of molecular group-specific prognostic markers in gastric cancer ...76
4.2.4. EMT based classification of gastric cancer cell lines ...94
4.3. IN SILICO IDENTIFICATION OF COMPOUNDS WITH SELECTIVE ACTION ON EPITHELIAL AND MESENCHYMAL CELLS ...96
4.3.1. Generation of a in-house EMT scoring method ...96
4.3.2. Identification of novel compounds that are preferentially effective on epithelial or mesenchymal cells, independent of tissue-of-origin in NCI60 ...99
4.3.3. Identification of novel compounds that are preferentially effective on epithelial or mesenchymal cells, independent of tissue-of-origin in CCLE and CGP ... 104
xi 4.3.4. Identification of novel and tissue-independent parameters in addition to EMT, which
will improve the prediction of sensitivity to EGFR ... 109
5.
DISCUSSION AND CONCLUSION ... 121
5.1. Prognostic SU-GIB signature identified in colon cancer ... 121
5.2. Molecular and prognostic sub-groups of gastric cancer ... 125
5.3. Selective targeting of epithelial and mesenchymal cells in cancers... 128
6.
BIBLIOGRAPHY ... 131
7.
APPENDIX ... 138
7.1. APPENDIX A ... 138 7.2. APPENDIX B ... 139 7.3. APPENDIX C ... 141 7.4. APPENDIX D ... 146 7.5. APPENDIX E ... 148 7.6. APPENDIX F ... 151 7.7. APPENDIX G... 156 7.8. APPENDIX H ... 160 7.9. APPENDIX I ... 162 7.10. APPENDIX J... 164 7.11. APPENDIX K ... 166 7.12. APPENDIX L ... 167 7.13. APPENDIX M ... 169 7.14. APPENDIX N ... 170 7.15. APPENDIX O... 1718.
PUBLICATION ... 173
xii
List of Figures
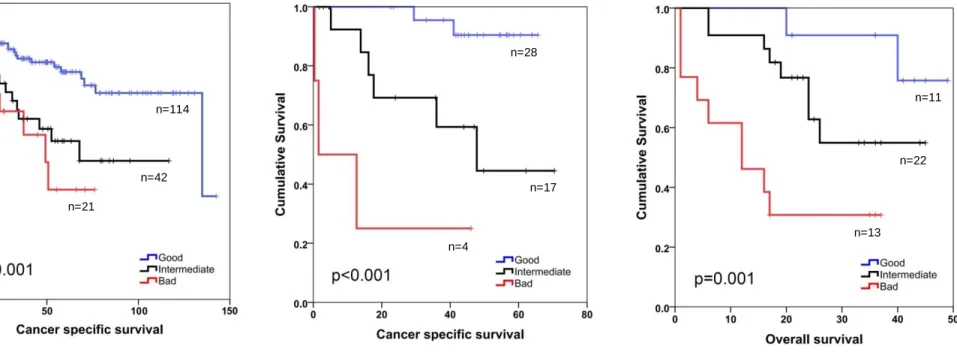
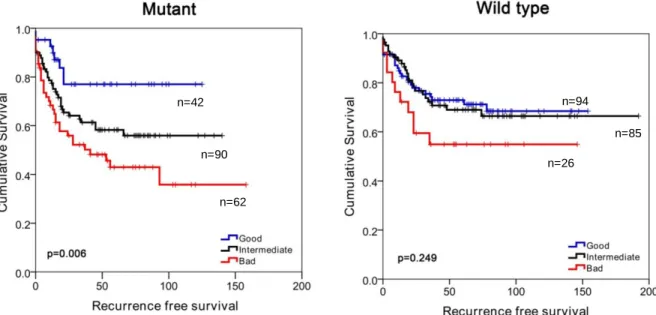
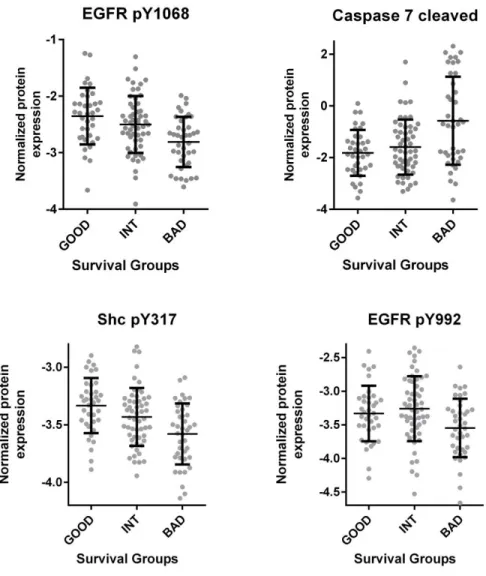
Figure 1.1: Representation of current clinical decision in treatment of colorectal cancer based on conventional risk factors ...3 Figure 1.2: Survival graphs of colon cancer patients stratified based on either ULBP2 or SEMA5A gene expression I (GSE17536). ...11 Figure 1.3: Survival graphs of colon cancer patients stratified based on either ULBP2 or SEMA5A gene expression II (GSE17537). ...11 Figure 4.1: Log rank multiple cut-off (LRMC) graphs of colon cancer patients stratified based on either ULBP2 or SEMA5A gene expression (GSE17536-GSE17537). ...35 Figure 4.2: Kaplan-Meier graphs for CSS of GSE17536 stratified based on either ULBP2 or SEMA5A gene expression for stage 2&3 patients ...36 Figure 4.3: Survival graphs of colon cancer patients stratified based on either ULBP2 or SEMA5A gene expression III (ex vivo analysis). ...39 Figure 4.4: SEMA5A/ULBP2 (SU) gene signature for colon cancer prognostication. ...41 Figure 4.5: Kaplan-Meier graphs based on the SU-GIB signature for GSE17536 (A), GSE17537 (B) and the Ankara cohort (C); restricted to stage 2&3 patients for in silico (A&B) and stage 3 patients for ex vivo (C) analysis ...43 Figure 4.6: Kaplan-Meier graphs for CSS of GSE17536 microsatellite-instable (MSI) and stable (MSS) patients as stratified by SU-GIB. ...45 Figure 4.7: Kaplan-Meier graphs for DFS of GSE17536 and GSE17537 patients as stratified by SU-GIB. G, I and B stratification of patients in both cohorts reveals that this can predict disease-free survival in both cohorts. ULBP2 and SEMA5A cut-offs were determined by SSAT (4 and 6, respectively). Log-rank test p values are shown. ...47 Figure 4.8: SU-GIB can predict RFS especially for microsatellite stable patients in GSE39582.. ...47 Figure 4.9: SU-GIB can predict recurrence-free survival for microsatellite stable patients with stage 2 or 3 disease in GSE39582 ...48 Figure 4.10: Kaplan-Meier graphs for SU-GIB of MSS patients in GSE39582 as stratified by KRAS&BRAF mutational status ...50 Figure 4.11: Kaplan-Meier graphs for SU-GIB of patients in GSE39582 as stratified by tumor location. Cut-off values for both genes were the most significant within the 25th and 75th interquartile range. Log rank p values were shown. ...50 Figure 4.12: TCGA based proteome analysis of colon cancer tumor tissue in SU-GIB prognostic groups ...55
xiii Figure 4.13: TCGA based RNA seq. analysis of colon cancer tumor tissue reveals increased
inflammatory cytokine gene expression in the bad prognosis group ...56
Figure 4.14: SU-GIB stratification is associated with EMT. Scatter plot for tumors in the GSE39582 dataset based on E-cadherin (201131_S_AT) and Vimentin (201426_S_AT) gene expression ...57
Figure 4.15: Chemosensitivity profiles of colon cancer cell lines corresponding to SU G, I and B phenotypes ...58
Figure 4.16: In silico selection of prognostic genes for gastric cancer. ...62
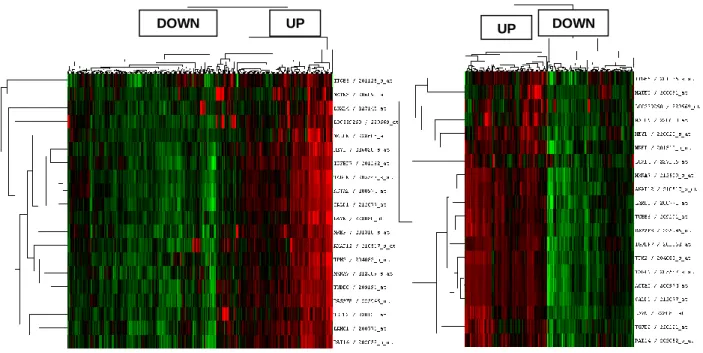
Figure 4.17: Hierarchical clustering analysis of gastric cancer tumors with prognostic genes ....63
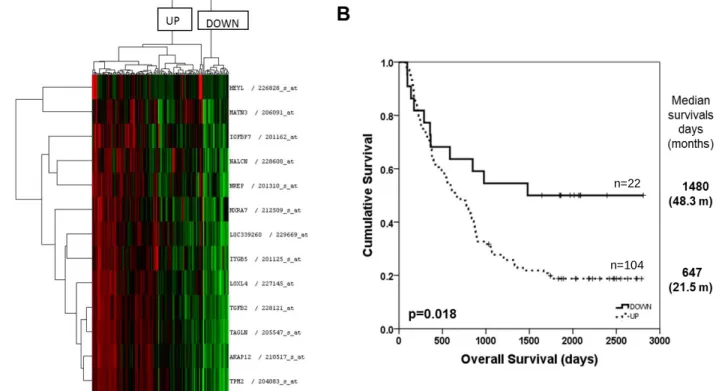
Figure 4.18: Kaplan Meier plots for prognostic groups of gastric cancer tumors ...64
Figure 4.19: Hierarchical clustering and kaplan meier analysis of gastric cancer tumors with prognostic genes in validation cohort ...65
Figure 4.20: Kaplan Meier plot for prognostic groups of gastric cancer tumors with disease free survival as an end point measure ...68
Figure 4.21: Kaplan Meier plot for prognostic groups of tumors in diffuse and intestinal type gastric cancers ...70
Figure 4.22: Prognostic classification of TCGA gastric tumors based on RNAseq data. ...71
Figure 4.23: Enrichment plots of highly enriched gene sets listed in Table 4.14 in GSE62254 dataset indicating an enrichment of genes related to the extracellular matrix, cytoskeleton and a reduction of metabolic processes and cell growth ...74
Figure 4.24: Enrichment plots of highly enriched gene sets listed in Table 4.14 in GSE15459 dataset show a similar pattern to that observed for GSE62254 ...75
Figure 4.25: Summary of high variance based stratification in gastric cancer ...76
Figure 4.26: Determination of molecular classification via unsupervised hierarchical clustering 77 Figure 4.27: Enrichment plots of top 4 genesets enriched in GSE29272 HIGH group show an enrichment of extracellular matrix related genes ...79
Figure 4.28: Enrichment plots of top 4 genesets enriched in GSE29272 LOW group indicate increased cell cycle, proliferation and mitosis ...80
Figure 4.29: Molecular classification of gastric tumors in GSE62254 dataset ...82
Figure 4.30: Molecular classification of gastric tumors in GSE35809 dataset ...85
Figure 4.31: Hierarchical clustering of GSE29272 dataset with generic EMT marker genes...88
Figure 4.32: Molecular and EMT based classification of gastric tumors in GSE22377 dataset. .90 Figure 4.33: Molecular classification of gastric tumors in GSE15459 dataset ...91
Figure 4.34: Kaplan Meier plots for molecular sub-groups of gastric cancer tumors ...93
xiv Figure 4.36: Hierarchical clustering analysis of gastric cancer cell lines with Tan et al. [1] generic
EMT signature for cell lines ...95
Figure 4.37: Scatter plot of EMT scoring of NCI60 cancer cell lines ...97
Figure 4.38: Correlation of a multi-gene EMT score and the CDH1-VIM score ...98
Figure 4.39: Correlation plot of the multi-gene EMT score and CDH1-VIM score ...98
Figure 4.40: Stem cell marker expression in EMT groups determined by CDH1-VIM score. ...99
Figure 4.41: Pubchem 2D structure of compounds selectively effective on mesenchymal cells. ... 102
Figure 4.42: Correlation matrix of drugs which are effective on epithelial cancer cells. ... 103
Figure 4.43: Sensitivity of epithelial and mesenchymal NCI60 cell lines to berberine derivatives ... 104
Figure 4.44: Equalization of distribution of epithelial and mesenchymal cells in CGP. ... 105
Figure 4.45: Equalization of distribution of epithelial and mesenchymal cells in CCLE. ... 105
Figure 4.46: Sensitivity of CDH1-VIM based epithelial (EPI) and mesenchymal (MES) CGP and CCLE cell lines to EGFR inhibitors. ... 106
Figure 4.47: Tissue specific sensitivity of epithelial and mesenchymal CGP cell lines to BIBW2992, EGFR inhibitor... 107
Figure 4.48: Tissue-specific sensitivity of epithelial and mesenchymal CCLE cell lines to Lapatinib and Erlotinib, EGFR inhibitors. ... 108
Figure 4.49: Analysis of mutational profile for associations with sensitivity to EGFR inhibitors 112 Figure 4.50: Microarray based expression level of EGFR in NCI60 cancer cell lines ... 113
Figure 4.51: Microarray based expression level of EGFR ligands in NCI60 cancer cell lines. .. 114
Figure 4.52: Venn diagram of probesets which significantly linearly correlated with cytotoxicity of BIBW2992. ... 115
Figure 4.53: Venn diagram of non-coding transcripts which significantly linearly correlated with cytotoxicity of BIBW2992. ... 115
Figure 4.54: Correlation of cRAF protein level expression and EGFR inhibitors in CCLE and CGP databases. ... 117
Figure 4.55: Linear regression analysis of cRAF and p38 MAPK for prediction of sensitivity to BIBW2992. ... 118
Figure 4.56: Sensitivity to EGFR inhibitors in 4 groups of endometrial cancer cells divided by EMT and cRAF-p38. ... 119
Figure 4.57: Sensitivity to EGFR inhibitors in 4 groups of breast cancer cells divided by EMT and cRAF-p38. ... 120
xv
List of Tables
Table 1.1: Prognostic and predictive roles of clinicopathological parameters in colorectal cancer
...4
Table 1.2: Genes with strongest survival associations by SSAT...9
Table 3.1: General laboratory reagents ...20
Table 3.2: Cell Culture Reagents ...21
Table 3.3: Primers ...22
Table 3.4: GEO Datasets used ...23
Table 4.1: Clinicopathological characteristics of patient cohorts II (DFS)...34
Table 4.2: Univariate cox regression analysis of ULBP2 and SEMA5A gene expression - CSS 36 Table 4.3: O`Connell genes validated via SSAT ...38
Table 4.4: Multivariate analysis of clinicopathological parameters and SU-GIB ...42
Table 4.5: Stage 2&3 restricted MVA of clinicopathological parameters and SU-GIB in GSE17536 - CSS ...44
Table 4.6: Cox regression analysis with GSE39582 MSS samples - DFS ...49
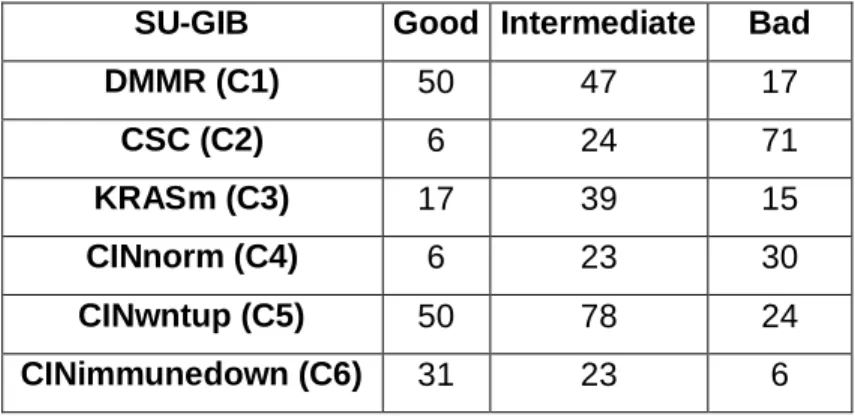
Table 4.7: Molecular sub-groups in Marisa et al. and SU-GIB ...51
Table 4.8: MVA analyses for stage 2 & 3 patients ...52
Table 4.9: MVA analyses for stage 2 & 3 patients including both Oncotype and SU-GIB ...53
Table 4.10: Drugs that are significantly correlated with both SEMA5A and ULBP2 expression in colon cancer cell lines according to CGP ...59
Table 4.11: Methodology of biomarker identification in colon and gastric cancers ...61
Table 4.12: Univariate Cox regression analysis of clinical parameters in discovery and validation cohorts – OS ...66
Table 4.13: MVA cox regression analysis of prognostic classification and stage in discovery cohorts - OS ...67
Table 4.14: Gene set enrichment analysis comparing UP-DOWN prognostic groups ...73
Table 4.15: Univariate Cox regression analysis of 134 probesets (significant associations reported) in GSE29272 dataset – OS ...78
Table 4.16: Genesets enriched common in HIGH group ...83
Table 4.17: Genesets enriched common in LOW group ...84
Table 4.18: Genesets enriched common in LOW group ...86
Table 4.19: Molecular and EMT based classification of gastric cancer tumors –GSE29272 ...89
Table 4.20: Molecular and EMT based classification of gastric cancer tumors –GSE22377 ...89
xvi Table 4.22: Molecular and prognostic classification of gastric cancer tumors –GSE15459 & GSE62254 ...92 Table 4.23: Cell and gene distribution in hierarchical clustering analysis in terms of epithelial-mesenchymalness ...95 Table 4.24: Selection of compounds in NCI60... 100 Table 4.25: NSC codes and Pubchem IDs of compounds selectively effecting mesenchymal cells ... 101 Table 4.26: List of in silico analyses performed ... 109 Table 4.27: GSEA analysis between cells lines which are sensitive and resistant to EGFR inhibitor, BIBW2992 ... 110 Table 5.1: Characteristics associated with 'GOOD' and 'BAD' prognostic groups of SU-GIB ... 124
1
CHAPTER 1
1.
INTRODUCTION
The gastrointestinal system (GIS) is comprised of gastrointestinal tract (GI tract) and organs which are involved in digestion; pancreas, liver, gallbladder and salivary glands. Food ingestion and digestion, absorption of nutrients and disposal of waste are performed by gastrointestinal system. The GI tract includes oral cavity, pharynx, esophagus, stomach, small and large intestine, rectum, anal canal and anus. The layers of gut are mucosa, sub mucosa, muscularis externa and either adventitia or serosa. These layers are critical in evaluating tumor stage [4].
Although the parts of gastrointestinal system are composed of similar layers, the driver mutations and other risk factors, incidence and prognosis are variable among cancers of the GIS [5].
We have worked on gastrointestinal cancers originating from colon and stomach and identified biomarkers for prognosis and response to therapy. In addition to that we consistently observed a relationship of EMT with prognosis, molecular heterogeneity and drug sensitivity of the tumors/cancer cells. From this viewpoint, we studied other cancer types originating from various tissues in the body, and found that EMT is a major biological process which has a role in determining chemosensitivity in cancer regardless of the tissue of origin.
1.1. Colon cancer survival - treatment
Colorectal cancer is the third leading cancer type and the third leading cause of cancer death in both men and women in USA [6]. Almost 130,000 new cases and 50,000 deaths were recorded for colorectal cancer in 2015 [6]. According to the statistics of the Health ministry of the Turkish Republic, colon cancer is the third most common cancer among women with an incidence of 7.8%, and the fourth among men with an incidence of 7.5 [7]. 5 year survival of patients with colorectal cancer is 58% according to Cancer Research UK`s statistics [8]. Although the primary treatment option for stage 2 and 3 colon cancer is surgery followed by adjuvant chemotherapy, patients receiving the same treatment regimen are known to have very different outcomes. Therefore it is of utmost importance to especially identify stage 2 patients with bad, and stage 3 patients with good prognosis, who need, and don‟t need therapy,
2 respectively. Surgery is considered curative for earlier stages of colon cancer, but still 30-50% of patients undergoing curative resection have recurrence after surgery [9].
Clinical decision making based on risk stratification in early-mid stage colon cancer is summarized in Figure 1.1. As can be seen, while treatment decision for stage 1 and 3 patients are standardized (stage 1 patients are kept under observation without therapy and stage 3 patients receive standard chemotherapy after surgery) the treatment decision for stage 2 patients is dependent on the assessment of high risk factors (high grade, lymphovascular invasion, perforation, obstruction, <12 lymph node examination, perineural invasion and indeterminate or positive margin) [10]. However The National Comprehensive Cancer Network (NCNN) Guidelines for colon cancer do not state clear decision routes for patients in these situations, in other words how those patients who would benefit from adjuvant chemotherapy can be determined is still unclear [11]. Therefore direct methods of assessing risk groups are essential for critical decision making in colon cancer.
FU- based chemotherapy has been a standard therapy since 1990s in order to reduce risk of recurrence [12]. Postoperative chemotherapy is recommended for stage 3 patients, however it is still under debate for stage 2 patients [13]. Fluoropyrimidine based therapies reduce risk of death 10-16 % in stage 3, which was increased 4-6% more with oxaliplatin addition, whereas FU-based treatment results in only 2-5% absolute survival benefit in stage 2 disease [14]. In other words, a group of stage 2 and 3 patients with good prognosis do not benefit from treatment but still receive chemotherapy and are exposed to toxic effects of the treatment unnecessarily. In contrast there are stage 2 patients who develop post-operative recurrence but do not receive chemotherapy because no risk of recurrence was predicted with available clinical data of the patient. In large studies, it has been shown that patients who receive post-operative chemotherapy at stage 2 or later, have recurrence of more than 20% [15], showing the need for new and most likely molecular methods for assessment of recurrence risk groups, and in line with this; potential patient subgroups with appreciable treatment benefit. Additionally, given the 5% survival benefit of standard chemotherapy as described above, novel targeted therapy options should be also utilized for specified patient groups.
3
Figure 1.1: Representation of current clinical decision in treatment of colorectal cancer based on conventional risk factors. Adopted from [10]
4
1.2. Colon cancer clinical prognostic markers
1.2.1. Major clinical factors
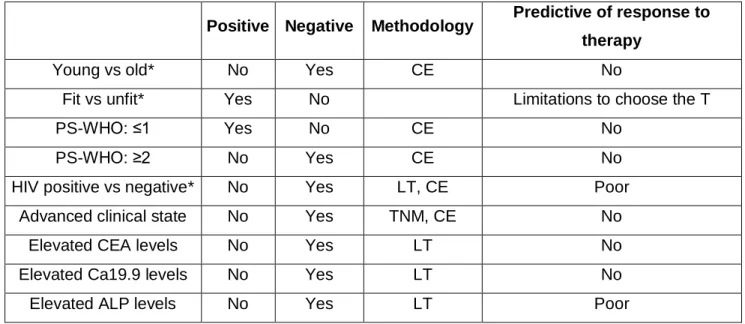
Many studies on more than 400 patients in total, have evaluated the prognostic value of clinical parameters as, WBC (white blood cell), serum albumin, liver transaminases, hemoglobin, platelets, age, body fitness, performance status, elevated CEA, Ca19.9, ALP levels and pathological grading, location of the primary tumor. However it is still unstandardized which of these factors should be considered and taken into account for the assessment of prognosis [16]. Divitiis et al. summarized the major clinical prognostic factors for colon cancer (Table 1.1), and although prognostic value exists for these factors, prediction of response to therapy can be only poorly addressed or cannot be assessed. This non-consensus created the need for molecular tests for prediction of patient outcome that could be used with a standardized methodology. This was the driving force for the studies presented in this thesis which resulted in the validation of two novel mRNA based prognostic biomarkers and generated a combined prognostic signature which is independent of all available clinical confounding factors.
Table 1.1: Prognostic and predictive roles of clinicopathological parameters in colorectal cancer
Positive Negative Methodology Predictive of response to therapy
Young vs old* No Yes CE No
Fit vs unfit* Yes No Limitations to choose the T
PS-WHO: ≤1 Yes No CE No
PS-WHO: ≥2 No Yes CE No
HIV positive vs negative* No Yes LT, CE Poor
Advanced clinical state No Yes TNM, CE No
Elevated CEA levels No Yes LT No
Elevated Ca19.9 levels No Yes LT No
Elevated ALP levels No Yes LT Poor
PS-WHO: Performance status- World Health Organization. CE: Clinical evaluation; LT: Laboratory test; T: Treatment (including surgery, chemotherapy, radiation therapy); TNM: Tumor node metastasis. Negative: association with poor survival. Positive: association with good survival. *For categorical analysis, the latter group was considered as reference. Adopted from [16].
5 Accumulation of transcriptomic and genomic data in recent years indicates that tumor location should be also considered as a confounding factor for colon cancer. It has been found that proximal tumors harbor higher levels of genome-wide hypermethylation, microsatellite instability and BRAF mutation [17]. In terms of clinical outcome, 5-year survival of patients with proximal tumors were 13 % less when compared to distal tumors (OR 0.87; 95% CI, 0.82–0.91) [18] and mortality of proximal disease is significantly higher than distal tumors [19]. Our prognostic signature was a predictor of prognosis primarily in distal cancers.
1.2.2. Microsatellite stability
Colon cancer patients with microsatellite instability (MSI) have been defined as a patient group with favorable prognosis, and with less aggressive clinical behavior when compared to patients with stable microsatellites (MSS). This prognostic pattern of MSI-high patients has been shown in recent large trials and a meta-analysis and many smaller scale retrospective studies [20]. Microsatellite instability status is also known to be associated with chemotherapy response. Patients with dMMR (deficient mismatch repair status) receiving FU showed no improvement in DFS (disease free survival) whereas patients with pMMR (proficient mismatch repair status) significantly improved DFS [21].
The underlying biology behind the better prognostic profile of colon cancer patients with MSI tumors is not clear yet [22]. However it has been shown that coding microsatellites and mutations in TGFBR2 and ACVR2A cause loss of their protein expression in MSI patients [23]. The allele loss or mutation in DCC, TP53 and KRAS which are associated with worse survival are not common in MSI tumors [24,25]. Researchers were also interested in likelihood of a cellular immune response caused by accumulation of frameshift proteins as an outcome of MSI. In this line, a higher lymphocyte infiltration rate was observed in tumors with MSI [26,27]. Furthermore, absence of MSI phenotype has been associated with expression of EMT markers [28], which could also have a role in prognostic profile of MSI tumors. Me and my colleagues work resulted in the definition of prognostic sub-groups of especially MSS tumors in colon cancer.
1.2.3. Mutations
As evaluated in 2721 patients from 13 countries, around 40% of colon cancers patients harbor a particular KRAS mutation [24] which is associated with both worse prognosis and resistance to treatment. Codon 12 glycine to valine mutation of KRAS is significantly associated with failure-free survival (P = 0.004, HR 1.3) and overall survival (P = 0.008, HR 1.29) [29]. More
6 importantly, KRAS mutation status is now considered as the only standard clinical biomarker for EGFR-targeted therapies in colon cancer, since many reports supported that patients with KRAS mutation do not respond to cetuximab or panitumumab [30].
BRAF mutations that occur in 7.9% of tumors have not been associated with relapse-free survival but have been found prognostic for overall survival in the PETACC-3 study which included 3278 colorectal cancer patients with stage 2 and 3 disease [31]. In case of stage 4 colorectal cancer patients, another study showed that BRAF V600E mutation, which was observed in 8.7% of the patients, was an indicator of shorter progression-free and overall survival [32]. BRAF mutant metastatic colorectal cancer patients were reported as unresponsive to EGFR-targeted therapies [33].
Furthermore, while NRAS mutations have been also found as poor prognostic indicators, studies about prognostic associations of PTEN and PIK3CA were contradictory [34-36].
Although these achievements pave the way for the prediction of response to EGFR- targeted therapy for metastatic colon cancer patients to a certain extent, other molecular tests are still required in order to make clinical decisions for the other patients with wild type tumors.
Our prognostic signature was independent of KRAS&BRAF mutational status, while patients with poor prognosis as defined by our method harbor more KRAS&BRAF mutations when compared to patients with good prognosis.
1.3. Colon cancer prognostic gene lists
Gene expression profiling assays are being investigated as an alternative approach for prediction of prognosis. Among many gene sets studied, Oncotype Dx® (Genomic Health, Inc., CA, USA) and Coloprint (Agendia, BV., Holland) are the most promising, but still are not used in routine patient care [37]. These prognostic gene expression based tests were designed to assess the risk of recurrence after surgical removal of the primary tumor via generating risk groups.
Coloprint is an 18-gene signature which was used for 188 fresh frozen tumor tissues from stage 1 to 4 using Agilent microarray technology and validated in an independent cohort of 206 patients from stage I to III; concluding that Coloprint classified low risk stage 2 patients had significantly longer RFS (HR:2.5, p=0.005) [38]. A revalidation by Salazar et al. in 416 stage 2 colon cancer patients showed that the Coloprint defined risk groups were significantly
7
associated with risk of relapse, independent of microsatellite instability and number of lymph nodes assessed in stage 2 colon cancer [39].
Studies based on fresh frozen tumor samples like Coloprint have limited clinical utility as they do not utilize the parafin embedded sections of the pathology archives [40]. In contrast, Oncotype Dx Colon, a 12 gene qPCR based assay, was applied to formalin-fixed paraffin embedded (FFPE) tissues, which are widely used for many clinical tests and archived for each patient, and therefore have been tested in more than 1800 patients from 4 large trials [41]. The QUASAR trial [42], include 1436 patients among which 711 were treated with surgery alone and 725 patients with surgery plus chemotherapy. Patients who were treated with surgery only were divided into low, intermediate and high risk groups depending on the recurrence score of 0 to 100 (<30:low risk, 30-40:intermediate risk, >40: high risk) with Oncotype Dx. 12%, 18% and 22% risk recurrence was observed for each risk group respectively, with a HR of 1.47 (high vs low risk) and p=0.046. However the 11 gene based treatment score of Oncotype Dx could not be validated for prediction of fluorouracil and leucovorin based treatment response of the 725 patients. For instance the absolute chemotherapy benefit in Oncotype Dx Colon Cancer low risk and high risk groups are 3% and 6%, respectivelly [43].
The prognostic classification provided by these signatures is valuable, however the contribution of these signatures to clinical decision making is limited [14]. Di Narzo et al. tested 4 different prognostic gene signatures including Coloprint and Oncotype Dx in an independent cohort of 688 stage 2-3 patients, and although the results indicated a statistically significant association with OS or RFS for all 4 tests in univariate models, they contributed little to risk assessment done with already used parameters as T-stage, N-stage, and MSI [44].
A comprehensive evaluation of gene expression based tests by AHRQ (Agency for Healthcare Research and Quality) concludes that, most of the prognostic/diagnostic tests available in the literature lack multivariate analysis (MVA) and thus analysis of independence from confounding factors [45]. Therefore the value these tests add on top of evaluations done with classical clinical parameters/methods is unclear. In addition to this, most tests consider only one type of clinical outcome, however AHRQ strongly recommends that prognostic tests should be tested with multiple survival parameters including overall survival, disease-free survival, cancer-specific survival etc. [45]. In order to overcome identification of cohort-specific biomarkers, AHRQ states that evaluation of prognostic tests in multiple study cohorts is crucial [45]. Another important deficiency emphasized in this report was the assessment of treatment response prediction resulting in significant and valid changes in treatment decision [45].
8 As a consequence of these, there is an urgent need for studies regarding prognostic biomarkers in cancer with the requirements of AHRQ fulfilled. Therefore we included MVA, evaluated multiple survival measures in multiple independent study cohorts and also worked on possible predictive value of our prognostic indicator using publically available drug cytotoxicity databases. Our novel prognostic classification was associated with cancer-specific, overall and disease free survival significantly in multiple microarray based cohorts and was independent of all available confounding factors, but most importantly from stage. We validated our in silico findings ex vivo in fresh frozen tumors of an independent cohort. We also demonstrated that our prognostic classification has a predictive role for sensitivity to a dual PI3K/mTOR inhibitor.
1.4. In silico discovery of two novel prognostic genes for colon cancer
Risk assessment in especially stage 2 colon cancer is highly important for decision making to either offer chemotherapy after surgery or not, however this process has not been standardized in clinics [11]. Therefore there is an urgent need for a standardized method of risk assessment in colon cancer. Two novel mRNA based biomarkers were previously discovered in our lab for this purpose. To identify novel mRNA based biomarkers that can prognosticate colon cancer patients based on the variance in their gene expression levels; we used two microarray datasets, GSE17536 and GSE17537, with available survival data as discovery cohorts. Median survival times for patients within the GSE17536 and GSE17537 cohorts were 42.2 (0.9-142.6) and 41.7 (0.4-70.5) months respectively. Clinicopathologic characteristics of these patients are summarized in (APPENDIX M and Table 4.1). We used SSAT (Semi-supervised survival analysis) tool which is developed by Murat İşbilen (see Methods). SSAT algorithm was run for microarray dataset GSE17536 which resulted in 400 genes with significant association with cancer specific survival. Similarly, 269 genes were significantly associated with survival in GSE17537 dataset, and 64 of these genes were common in both datasets with hazard ratios in the same direction and shared the same threshold value. Therefore these 64 genes were analyzed further.
According to the sample sizes of GSE17536 and GSE17537 datasets, weighted averages of the two p values were calculated with a weight of 78% for GSE17536 and 22% for GSE17537 for each gene. The most significant top 20 genes (Table 1.2) were further used in Multivariate Cox Regression analysis (MVA) including stage as the confounding factor with the GSE17536 dataset (APPENDIX N).
9
Table 1.2: Genes with strongest survival associations by SSAT
Gene NCBI
gene ID Rank ADAM12 (ADAM metallopeptidase domain 12) 8038 1
SFRP2 (secreted frizzled-related protein 2) 6423 2
ULBP2 (UL16 binding protein 2 ) 80328 3
KAL1 (Kallmann syndrome 1 sequence) 3730 4
SEMA5A
(sema domain, seven thrombospondin repeats (type 1 and type 1-like), transmembrane domain (TM) and short cytoplasmic domain, (semaphorin) 5A)
9037 5
PXDN (peroxidasin homolog (Drosophila)) 7837 6
PCDH7 (protocadherin 7) 5099 7
CTGF (connective tissue growth factor) 1490 8
PRKD1 (protein kinase D1) 5587 9
COL11A1 (collagen, type XI, alpha 1) 1301 10
EBF1 (early B-cell factor 1) 1879 11
SCFD1 (sec1 family domain containing 1) 23256 12
SPP1 (secreted phosphoprotein 1) 6696 13
PIM1 (Pim-1 proto-oncogene, serine/threonine kinase) 5292 14
HTRA1 (HtrA serine peptidase 1) 5654 15
SPON1 (spondin 1, extracellular matrix protein) 10418 16
CRYAB (crystallin, alpha B) 1410 17
FABP4 (fatty acid binding protein 4, adipocyte) 2167 18
CLDN11 (claudin 11) 5010 19
10 Out of 20 genes, ULBP2, SEMA5A and PCDH7 genes were found as stage independent prognostic factors (APPENDIX N). Next these genes were used in MVA using the GSE17537 dataset which showed that ULBP2 and SEMA5A genes were independent prognostic factors of cancer specific survival for both datasets analyzed (APPENDIX N). Kaplan Meier plots indicated that ULBP2 and SEMA5A were associated significantly with shorter and longer cancer specific survival, respectively when all stages were included in the analysis (Figure 1.2 and Figure 1.3).
These data generated a basis for my studies and I ex vivo validated ULBP2 and SEMA5A in primary colon tumor tissues and performed further in silico analysis for the identification of best stratification method with these two genes and understanding biological differences among the prognostic groups.
11
Figure 1.2: Survival graphs of colon cancer patients stratified based on either ULBP2 or SEMA5A gene expression I (GSE17536). Kaplan-Meier analyses (in silico) comparing “high”
and “low” expression groups as defined by SSAT cut-off values for ULBP2 (A) and SEMA5A (B), which were 4 and 6, respectively. Log-rank p values are indicated. Cancer specific survival is in months.
Figure 1.3: Survival graphs of colon cancer patients stratified based on either ULBP2 or SEMA5A gene expression II (GSE17537). Kaplan-Meier analyses (in silico) comparing “high”
and “low” expression groups as defined by SSAT cut-off values for ULBP2 (A) and SEMA5A (B), which were 4 and 6, respectively. Log-rank p values are indicated. Cancer specific survival is in months. n=13 n=36 n=37 n=12 n=127 n=50 n=50 n=127 n=143 n=34 n=13
12
1.5. ULBP2 and SEMA5A
Semaphorins were identified as axon guidance molecules contributing to regulation of neural connections [46]. Type 5 semaphorins including SEMA5A, are transmembrane proteins and are present in invertebrates and vertebrates [47]. They have unique thrombospondin type-1 (TSP-1) repeats in addition to the common sema domain in the extracellular region [48]. Plexin B3 is a known receptor for SEMA5A [49]. Semaphorins are involved in various cellular processes like tumor suppression, apoptosis and migration [50]. SEMA5A has been linked with invasion and migration of cancerous cells previously. SEMA5A transfection to pancreatic cancer cell lines resulted in higher cell invasion in vitro and injection of those cells to nude mice enhanced tumorigenicity and tumor growth in vivo [51]. Promotion of in vitro migration and invasion by SEMA5A has been also shown in gastric cancer cell lines [52]. In contrast, SEMA5A impedes motility of human glioma cells through its receptor plexin 3B [53], suggesting its functions differ based on the tissue that is analyzed. In terms of clinical outcome, up-regulation of SEMA5A has been associated with good prognosis in NSCLC in non-smoking women [54]. Other proteins in the semaphorin family have also been associated with good or bad clinical outcome [55]. SEMA3A up-regulation has been found to be significantly linked to good prognosis in NSCLC [56], tongue cancer [57], but with shorter survival in pancreatic cancer [58]. High expression of SEMA4D has been associated with poor clinical outcome in cervical cancer [59], and SEMA3G up-regulation was associated with better clinical outcome in glial tumors [60]; cumulatively suggesting that these molecules affect clinical outcome in a somewhat tissue-dependent fashion, similar to their molecular effects. In our studies, we found that higher expression of SEMA5A was associated with longer cancer specific, overall and disease free survival.
Accumulating studies showed that ULBP2 protein expression and secretion has been associated with immune response, via blocking natural killer cell mediated cytolysis. Natural killer (NK) cells target tumor cells and are thought to be involved in host defense against malignancy [61]. NKG2D receptors found on NK cells and cytotoxic T cells interact with their ligands like MICA and MICB which are members of MHC class 1 family and also UL16 binding proteins ULBP 1-6 molecules. MICA and MICB have restricted expression in normal tissue whereas they are highly expressed on tumor cells of lung, breast, kidney, ovary, prostate, and colon [62]. ULBP glycoproteins are highly expressed in transformed or stressed cells. They are shown to be linked to cellular membrane with or without a GPI (glycosylphosphatidylinositol) anchor and provide interaction with NK cells inducing cytokine and chemokine release [63,64].
13 This interaction has been shown to promote perforin bridge mediated delivery of cytotoxic proteases to tumor cell which in turn causes cell death [65].
ULBP proteins are highly expressed in colon and stomach tumors when compared to corresponding normal tissue [63]. Such cell surface expression of ULBPs was also correlated with the susceptibility of cells to NK cell mediated cell lysis [66]. Therefore ULBPs has been thought to be involved in tumor immunity in various cancer types which is supported also by defective tumor immunosurveilance in NKG2D deficient mice in a prostate cancer model [67]. GPI-anchored ULBP2 has been found to be removed from cell surface via metaloproteinases which reduced NK mediated cell lysis [68]. Therefore ULBP2 was considered a major player in tumor immunity and was studied as a prognostic marker in ovarian cancer where high expression of ULBP2 is found to be an indicator of poor prognosis [69,70].
ULBP2 was proposed as a serum biomarker for determining the prognosis and diagnosis of several other cancer types. A comprehensive analysis of 200 patients‟ sera showed that soluble ULBP2 is related to poor prognosis in melanoma [71]. ULBP2 has been proposed as an early screening serum biomarker for pancreatic cancer (PC) which was even superior to CA 19-9, a clinically used serum biomarker for PC, in terms of discriminating early stage PC patients from healthy controls [72]. Multivariate analysis showed that ULBP2 serum level is a prognostic marker for non-small cell lung cancer (NSCLC) and it is a diagnostic marker for squamous cell carcinoma patients [73]. In leukemia, serum ULBP2 was found to be an independent indicator of treatment free survival [74]. In order to utilize these data clinically; a recent study showed that a fusion protein combining human ULBP2 and an antibody derived chain against tumor carcino-embryonic antigen (CEA) has been found to bring NK cells and tumor cells together and induce NK mediated cell death in vitro and show anti-tumor activity in
vivo [75]. Not in tumor cells but in colorectal cancer associated fibroblasts, ULBP2 has been
included in a 5 –gene classifier that can predict relapse as determined by RT-PCR [76]. Our studies revealed that high expression of ULBP2 in primary colon tumors is associated with shorter cancer specific, overall and disease free survival.
14
1.7. Gastric cancer statistics
Gastric cancer is the fifth cancer type with the worst prognosis [6]. 5 year survival expectancy of gastric cancer patients in developed countries is 29%. The incidence in Turkey is 16.3 for men, 8.8 for women in 100.000, thus the 4th and 3rd most common cancer type, respectively [77]. Although surgical resection is considered curative, the majority of the patients are diagnosed at the later stages of the disease when the cancer has invaded other tissues, which hampers the opportunity of curative resection resulting in poor prognosis [78]. The overall survival could be only increased to 35 months with the conventional chemoradiotherapy when compared to the placebo arm with 27 months of overall survival in 559 patients with primaries ≥ T3 and/or node-positive gastric cancer [79]. Both predictive and prognostic biomarkers may contribute to individualized treatment of gastric cancer patients. In addition new targeted treatment strategies are necessary to improve the clinical outcome in gastric cancer [80].
1.8. Gastric cancer heterogeneity
Gastric cancer is a highly heterogeneous disease with molecular aberrations and changes at DNA, RNA and protein levels [81]. Intestinal type and diffuse type gastric cancers constitute the two major histological classes, the so called Lauren classification. In 2010; WHO (World Health Organization) defined four major histological classes which are papillary, tubular, mucinous and poorly cohesive (including signet ring cell carcinoma), and uncommon histologic variants [82]. While the diffuse type gastric cancer is known to be driven mostly by intrinsic factors (genetic abnormalities), the intestinal type is more related to extrinsic factors such as life style, diet and Helicobacter Pylori infection [82] which is an important extrinsic promoter of gastric cancer due to long-term inflammation and induction of change in gene expression [83].
The familial diffuse type cancers are also distinguished by EMT-like features of cells since they harbor germ-line mutations of CDH1 (E-cadherin) gene which codes for an adherence junction protein. Thus the resulting downregulation of this protein leads to dissemination of tumor cells leading to a more mesenchymal phenotype [84]. CDH1 gene alterations include large deletions, point mutations and frameshift mutations, in 46% of high -risk families [85]. Reduction in the protein level of CDH1 can be also caused by CpG hypermethylation or transcriptional repression by SNAIL [84]. Comparison of gene expression between diffuse and intestinal type cancers revealed that the ratio of only two genes, CDH1 and CDH2, is sufficient to distinguish these two sub-types- high CDH1/CDH2 ratio demonstrates a
15 diffuse phenotype, and diffuse type tumors have highly dominant mesenchymal features and have a worse prognostic profile [86].
Although gastric tumor biology is better understood in recent decades, there is still no treatment protocol for groups of patients with molecularly distinct tumors. Therefore understanding the molecular characteristics of gastric cancer and identification of prognostic and predictive biomarkers are critical for improved clinical outcome [87]. In this thesis, I identified molecular and prognostic sub-groups among gastric tumors with apparent differences in the biology revealing involvement of ECM, EMT and proliferation/cell cycle. In addition to that, I found that the histologically classified diffuse and intestinal type tumors can be further sub-classified into two groups with highly distinct prognostic profiles.
1.9. Gastric cancer biomarkers
There are a number of prognostic and predictive biomarkers identified for gastric cancer. A receptor tyrosine kinase, MET, which is activated by scatter factor (SF) or hepatocyte growth factor [88] that induces activation of PI3K-AKT and RAS-MAPK pathways, is overexpressed and amplified in 50% and around 20% of gastric cancer tumors, respectively [89,90]. The overexpression and amplification of MET is shown to be associated with worse survival and liver metastasis in gastric cancer [89,91].
Overexpression of HER family members HER2 and EGFR are observed in 23-26% and 27% of gastric cancers, respectively [92-94]. The transformation from low-grade to high-grade carcinoma was correlated with increasing HER2 expression [95] and was also a biomarker of treatment benefit for trastuzumab, the only targeted agent approved for gastric cancer [96,97]. Amplification of EGFR has been recorded in 5% of patients and its overexpression is associated with higher grade, higher stage and unfavorable prognosis [94,98].
Mutations and amplification in PI3K have been recorded in 7% and 67% of gastric cancer patients [99] and cause frequent activation of PI3K/mTOR pathway [100]. Deregulation in this pathway by activated mTOR has been detected in 51% of gastric cancer patients and was associated with lymph node metastasis, shorter disease-free and overall survival [101,102]. However, a phase 3 study of the mTOR inhibitor, everolimus, including 656 patients revealed that treatment did not result in a significant overall survival benefit when compared to placebo, therefore suggesting no predictive role for mTOR [103].
16 Several studies have aimed the identification of prognostic biomarkers in gastric cancer, In the majority of these, however, the biomarkers were not investigated in individual histological subtypes of gastric cancer (intestinal and diffuse) [104-107] or have been found as prognostic in only one subtype [108,109]. Therefore in this thesis, I define a set of prognostic biomarkers which can divide prognostic subgroups both in intestinal and diffuse type gastric cancer.
My studies in colon and gastric cancers resulted in novel biomarkers which could be used for molecular sub-grouping, prognosis and prediction of drug sensitivity. In silico analysis with tumors and cancer cell lines of both cancer types revealed EMT as a major player in prognosis, drug sensitivity and molecular heterogeneity; therefore I concentrated on studying the prediction of drug sensitivity with regard to EMT status of cancer cells.
17
1.10. EMT and cancer
Epithelial-mesenchymal transition (EMT) describes a biological process by which epithelial cells lose their attachments to the neighboring cells and the basement membrane causing loss of their cell polarity by transcriptional, proteomic, epigenetic and biochemical changes that leads to enhanced cell motility, invasiveness and resistance to apoptosis. Upon degradation of basement membrane, newly mesenchymal cells gain the ability to migrate away from the epithelial layer [110]. This biological process is well studied for its role in embryonic development and is also involved in organ fibrosis in adult tissues [111]. Lately, accumulating evidence support the reinitiation of EMT during malignant transformation and metastasis. EMT, supported by the tumor microenvironment, allows cancer cells to metastasize [112].
The process of invasion and metastasis via EMT, involves reduction of proliferative activity, activation of anti-apoptotic processes, changes in cellular features from epithelial to mesenchymal, decreased cell-cell attachment, upregulation of adhesion molecules required for cell motility and degradation of ECM [113].
Accumulating evidence reveals a relationship of EMT also with stem like properties and with drug resistance [114]. Snail, one of the transcription factors that drives EMT process, has been shown to attenuate cell cycle, and cause drug resistance via withdrawal of survival factors [115]. Another study reported that Snail and Slug have been involved in direct transcriptional repression of factors which have a role in apoptosis thus providing resistance to DNA damage inducers [116]. Overexpression of these EMT transcription factors also upregulate ABC transporters enhancing multi-drug resistance causing 10 fold higher resistance to doxorubicin in breast cancer cells [117]. Another data showed that induction of EMT via downregulation E-cadherin resulted in resistance to paclitaxel and doxorubicin in breast cancer cells [118]. In my data, cancer cells exhibiting a mesenchymal gene expression profile showed a higher resistance to EGFR inhibitors when analyzed as a pool of all cancer types and cancer specifically in multiple independent drug cytotoxicity databases.
18
1.10.1. E-cadherin and Vimentin as epithelial and mesenchymal markers
The protein coded by the E-cadherin (CDH1) gene, located on chromosome 16, attaches to the cadherins of adjacent cells generating a link to the intercellular cytoskeleton of epithelial cells. α-catenin links actin filaments within the cells to β-catenin which interacts with the intracellular domain of CDH1 supporting cell polarity. In addition E-cadherin is involved in differentiation, migration and behaves as a tumor suppressor gene [119,120]. In carcinoma cells, the downregulation, complete shut-down, or inactivation of E-cadherin has been observed resulting from mechanisms like mutations, promoter methylation,or transcriptional repressors [121,122]. Loss of the cadherin-cadherin cytoskeleton is associated with transformation of benign lesions to more aggressive metastatic tumors [121].
Vimentin (VIM) is a major marker of EMT. It is a type III intermediate filament which is expressed in various tissues in the human body including endothelial cells, hematopoietic cells, glial cells and fibroblasts [123,124]. Vimentin forms homopolymers and heteropolymers with other intermediate filaments forming a stable structure via presence of coiled-coiled alpha helical domains [125], playing a role in cytoarchitecture and tissue integrity [126]. Vimentin connects the nucleus to the cellular membrane and plays a major role in vimentin-associated matrix adhesions that are dynamically involved in migration [127]. Vimentin deficiency causes impaired mechanical stability, migration and contractile capacity [128]. Increased expression of VIM is strongly correlated with invasive and metastatic behaviour of tumors in many cancer types and therefore has role in tumor progression [129-132].
Lately, the EMT status of cancer cells has been evaluated in terms of their expression of several epithelial and mesenchymal markers or generating complex scoring algorithms based on EMT gene expression [1]. I developed a novel and simpler scoring method, using E-cadherin and Vimentin mRNA expression levels, for assessment of EMT status in various cancer types that is almost perfectly correlated with more complex scoring algorithms. I also identified novel compounds from the NCI60 database which selectivelly target epithelial and mesenchymal cells in all cancer types analyzed. I found out that EMT is a biomarker of sensitivity to EGFR targeted agents in vitro. This could be useful especially for metastatic colon cancer patients with wild type KRAS who are candidates for anti-EGFR therapy, since a large clinical trial indicated no benefit of cetuximab addition to oxaliplatin plus 5-FU based therapy for those patients in terms of overall and progression-free survival [133]. My data showed that a sub-group of those patients with epithelial type tumor may benefit from EGFR inhibitor, and I could show this to be the case regardless of the cancer type in vitro.
19
CHAPTER 2
2.
AIM
The prediction of prognosis and risk assessment in colon cancer has not yet been standardized in clinical practice especially for stage 2 disease where this is very critical. Considering the hazardous side effects of chemoradiotherapy and very little survival benefit of FU based treatment, predicting a sub-group of patients with high risk of progression as candidates for adjuvant chemotherapy after surgery is of utmost importance. For this purpose, in order to stratify colon cancer patients according to prognosis independent of clinical confounding factors as stage, grade, lymphovascular invasion, age, gender etc., two novel mRNA biomarkers, ULBP2 and SEMA5A were discovered previously in our lab. My first aim was to ex vivo validate these biomarkers and to identify the best stratification method for the prognostic testing. Together with my colleagues we identified and validated novel prognostic markers and generated a combined 3-class prognostic signature “SU-GIB”. My second goal was to resolve the underlying biology of SU-GIB signature; and the data revealed an inflammatory and more mesenchymal gene expression in patients with poor prognosis, and a higher EGFR phosphorylation with higher epithelial gene expression in patients with good prognosis.
Although gastric cancer is well known for its heterogeneity, no standardized treatment strategy has been developed for molecularly defined patient groups. Therefore I next aimed to define prognostic and molecularly distinct biological sub-groups for gastric cancer and to reveal the biological differences between molecular and prognostic distinctions among defined groups. I found a major involvement of EMT, ECM related cellular components; and cell cycle and proliferation related processes to two distinct gastric cancer subgroups.
Since I observed a major role for EMT in prognosis and molecular heterogeneity of two gastrointestinal cancer types; we aimed to identify compounds which have selective cytotoxic/cytostatic effect on either epithelial and mesenchymal cells. For this purpose we used publically available drug cytotoxicity databases and found that EGFR inhibitors are cancer-independent blockers of cell growth for cancer cells with an epithelial phenotype. Hence we then aimed to identify other biomarkers of sensitivity to EGFR inhibitors based on proteomic, mutational and high-throughput gene expression data and found two protein biomarkers.
20
CHAPTER 3
3.
MATERIALS AND METHODS
3.1. MATERIALS
3.1.1. General laboratory reagents
Chemicals such as ethanol, isopropanol and chloroform were purchased from SIGMA-ALDRICH (St. Louis, MO, USA). Nuclease Free Water and RNAase Zap were bought from Ambion (Carlsbad, CA, USA) and DMSO (Dimethyl Sulfoxide) was purchased from AppliChem (Darmstadt, Germany).
Table 3.1: General laboratory reagents
Reagent Company
DNA-freeTM Kit Invitrogen (Carlsbad, CA, USA) QubitTM RNA BR Assay Kit Invitrogen (Carlsbad, CA, USA)
Agilent RNA 600 Nano Kit Agilent technologies (Santa Clara, CA, USA)
RevertAid First Strand cDNA Synthesis Kit Thermo Scientific (Waltham, MA, USA) OneTaq Quick-Load 2X Master Mix with Standard
Buffer New England Biolabs (Ipswich, MA, USA)
Taqman Universal PCR Master Mix Applied Biosystems (Carlsbad, CA, USA) Taqman Gene Expression Assays Applied Biosystems (Carlsbad, CA, USA)
Tri-reagent® Ambion (Carlsbad, CA, USA)
21
3.1.2. General Lab Equipment
Power supply and Gel Electrophoresis tank were purchased from Hoefer Inc (Hollison, MA, USA). In order to quantify and measure the purity of RNA samples, Nanodrop (Thermo Scientific, MA, USA) was used. Qubit Fluorometer (Invitrogen, Carlsbad, CA, USA) was used to double-check the RNA quantity. Microplate Spectrophotometer µQuant (Biotek, VT, USA) was used for luminescence reading while performing mycoplasma test and measuring cell growth inhibition.
3.1.3. Cell Culture Reagents Table 3.2: Cell Culture Reagents
Reagent Company
Fetal Bovine Serum Biowest (Nuaille, France)
Rosswell Park Memorial Institute Medium (RPMI) GIBCO (Carlsbad, CA, USA) Dulbecco`s Modified Eagle Medium (DMEM) Lonza (Basel, Switzerland) Eagle`s Minimum Essential Medium (EMEM) Lonza (Basel, Switzerland)
Tripsin-EDTA SIGMA-ALDRICH (St. Louis, MO, USA)
L-glutamine Hyclone (Rockford, USA)
Penicillin - Streptomycin Hyclone (Rockford, USA) Cell Titer Glo® Luminescent Cell Viability Assay Promega (Fitchburg, Wisconsin, USA)
MycoAlertTM Mycoplasma Detection Kit Lonza (Basel, Switzerland)
3.1.4. General lab solutions
50X Tris-Acetate-EDTA (TAE)
For 1 L of 50X TAE, 242 g of Tris base, 37.2 g of Tritiplex III (EDTA) and 57.1 ml of glacial acetic acid were dissolved in ddH2O.
Ethidium Bromide
22
3.1.5. Cell Culture Solutions
10x Phosphate Buffered Saline
14.4 g of Na2HPO4.7H2O, 80 g NaCl, 2 g KCl, 2.4 g KH2PO4 were dissolved in 800 ml of ddH2O.
After adjusting the pH to 7.4, the volume is filled to 1 L. 1X solution was prepared via adding 450 ml of ddH2O to 50 ml of 10 X PBS solution. 1X PBS was autoclaved and filtered before use
in cell culture.
Complete Media
500 ml of RPMI, DMEM and EMEM media all were supplemented with 50 ml of Fetal Bovine Serum, 5 ml of L-Glutamine and 5 ml of Penicillin-Streptomycin constituting approximately 10%, 1% and 1% of the final media, respectively.
Freezing Media
90% DMSO and 10% FBS solution was prepared as freezing media.
3.1.6. Primers and probes
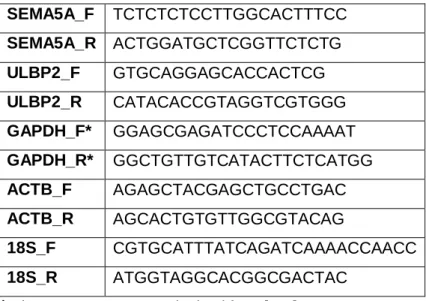
Custom designed Taqman primer probes were used for quantification of ULBP2 in frozen tissues, (Hs00607609_mH). GAPDH, ACTB were used as reference genes (4352934E, 4352935E). Primers used for SYBR green experiments are listed below. GAPDH, ACTB and 18S were used as reference genes for SYBR green based qPCR experiments.
Table 3.3: Primers SEMA5A_F TCTCTCTCCTTGGCACTTTCC SEMA5A_R ACTGGATGCTCGGTTCTCTG ULBP2_F GTGCAGGAGCACCACTCG ULBP2_R CATACACCGTAGGTCGTGGG GAPDH_F* GGAGCGAGATCCCTCCAAAAT GAPDH_R* GGCTGTTGTCATACTTCTCATGG ACTB_F AGAGCTACGAGCTGCCTGAC ACTB_R AGCACTGTGTTGGCGTACAG 18S_F CGTGCATTTATCAGATCAAAACCAACC 18S_R ATGGTAGGCACGGCGACTAC