Bulgarian Journal of Agricultural Science, 17 (No 2) 2011, 246-257 Agricultural Academy
A study on determinAtion of functionAl food consumption
hAbits And AwAreness of consumers in turkey
I. S. DOGAN1, O. YIlDIz2, E. EYDurAN3 and S. KOSE1
1 Department of Food Engineering, Faculty of Agriculture, University of Yuzuncu Yil, 65080,
Van, Turkey
2 Department of Food Engineering, Faculty of Engineering, University of Igdir, Igdir, Turkey
3 Department of Animal Science, Faculty of Agriculture, University of Yuzuncu Yil, 65080, Van, Turkey
Abstract
DOGAN, I. S., O. YIlDIz, E. EYDurANand S. KOSE, 2011. A study on determination of functional food consumption habits and awareness of consumers in Turkey. Bulg. J. Agric. Sci., 17: 246-257
The survey study was to determine the status of knowledge about functional foods, the factors influencing consumer preferences in the purchase and their expectations in Turkey. A total of 389 persons, 288 men and 101 women ranging from 10 to 70 ages were participated in the study. Participants’ level of awareness about functional foods was found to be approximately 40%. In general, it was determined that these foods were consumed little by almost half (51.34%) of those participated to the survey. It was also found that women and especially participants ranging from 20 to 40 years-old consumed more functional foods than the rest of participants. As a result, it was concluded that education, income level, product price, compliance with religious sensitivities, the presence of artificial food additives and genetic modification were to be effective on functional food choice.
Key words: functional food, awareness of consumers, survey, Turkey
introduction
A food can be described as functional food if it satisfactorily improves our health beyond nutri-tional necessity. These improvements include an improved state of health, a reduction of risk of any type of disease and enhanced physical and mental well-being of consumers (Menrad, 2003).
Functional foods must be regular food and also demonstrate their effects when consumed at the level of daily intake. They are not a pill or a capsule, but in the form of the normal food pattern
(Diplock et al., 1999; IlSI Europe, 2002). Health is one of the frequently mentioned driv-ing forces for conscious consumers. Consumer awareness of the relationship between diet and health has increased considerably in recent years, based on recent studies that a healthy diet can con-tribute to reduced risk of common diseases such as coronary heart problems, diabetes and cancer (Blandon et al., 2007).
Consumer acceptance of functional products has motivated the development of functional food sectors. The functional foods market is growing
worldwide, new products are being launched continuously and competition is becoming more intense (Menrad, 2003). For example, 42% of Americans were interested in regularly buying foods that may help prevent disease as reported by Childs and Poryzees (1998). This ratio is increased to 52% in 2003 (De Jong et al., 2003). These find-ings clearly indicate that there is a positive trend in the development of functional foods.
Demographic variables such as age, gender and education have influences on choosing behavior of food and acceptance of functional foods. The carrier and the ingredients of functional foods and natural health products are also main issues influencing consumer suitability. Dairy products, cereal products and non-alcoholic beverages are currently the most frequent carriers of functional ingredients. The functional ingredients most commonly used in food products are antioxidants, lycopene, omega-3 fatty acids, probiotics and isoflavones. Of these, calcium and omega-3 fatty acids have the highest rate of consumption. The most usually consumed natural health products are vitamins, Echinacea, herbal medicines and glucosamine (Blandon et al., 2007).
To survive the competition, a functional food product has to be bought repeatedly, and therefore it has to be developed considering consumer’s desires and needs. Therefore, consumer research is crucial in the development of functional foods (Ares and Gambaro, 2007). Bech-larsen et al. (2001) reported that consumers can only be ex-pected to consider substituting conventional with functional foods if the latter are perceived as comparatively healthy. Consumers’ perceptions of the healthiness of the products, processes and enrichments involved in the production of func-tional foods are crucial in determining consum-ers’ acceptance of this type of foods (Ares and Gambaro, 2007).
In this context, a substantial literature review and analysis of consumer attitudes and preferences towards functional foods and natural health products has been carried out to inform industry
and policy decision-makers about market trends and consumer preferences, which can provide useful information in the development of market strategies and policies (Blandon et al., 2007).
Therefore, food choices are altered by mainly demographic background variables and also im-portant for functional food product development. The aims of the study were to investigate con-sumer consciousness in Turkey towards functional foods, what kinds of foods they choose, and the acceptance and willingness to use functional foods among Turks.
materials and methods
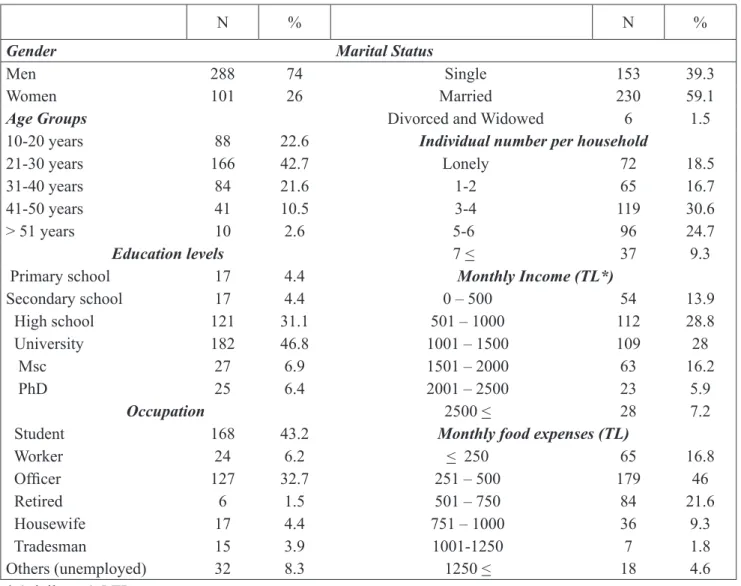
SubjectsThe survey on choice of functional foods was carried out on 389 people in Turkey. The data were collected from a total of 389 consumers, who were selected randomly from shopping areas, public places, and conferences. The survey data were composed of 288 males (74%) and 101 females (26%), ranging in age from 10 to 70 years. Table 1 presents the characteristics of the participants by gender, age group, education status, marital status, occupation, monthly income, individual number per household and monthly food consumptions.
methods
The data obtained from the survey on the functional food prefererances were analyzed us-ing statistics such as chi-square and likelihood ratio Chi square (known also as G statistic). The notation of Chi-Square (1) and likelihood ratio Chi-Square statistics (2) can be written as follows (Eyduran, 2008):
(1) (2)
Where, f, observed frequency and fi ,expected frequency.
(
)
∑
− = i i f f f 2 2 c∑
= i f f f G 2 .lnresults and discussion
When improving income levels, participants increased the percentage food expenses, which means an association between income level and food expenses was significant (P<0.001).
Participants’ education level increased with rising income level (P<0.001) as seen from Table 2. That is, a relationship between education level and income level of participants was significant (P<0.001). An association between gender and
income level of participants was also found to be significant (P<0.001).
Table 3 presents consumption rates (%) and fre-quencies of various functional food types concern-ing all participants in survey on functional foods. None of the four functional foods tested have been used by approximately half of people (51.34 %) who were participated to the survey.
Functional Soybean Products
Consumption proportions (%) and frequencies
table 1
details on all of the participants in survey
N % N %
Gender Marital Status
Men 288 74 Single 153 39.3
Women 101 26 Married 230 59.1
Age Groups Divorced and Widowed 6 1.5
10-20 years 88 22.6 Individual number per household
21-30 years 166 42.7 lonely 72 18.5
31-40 years 84 21.6 1-2 65 16.7
41-50 years 41 10.5 3-4 119 30.6
> 51 years 10 2.6 5-6 96 24.7
Education levels 7 < 37 9.3 Primary school 17 4.4 Monthly Income (TL*)
Secondary school 17 4.4 0 – 500 54 13.9 High school 121 31.1 501 – 1000 112 28.8 university 182 46.8 1001 – 1500 109 28 Msc 27 6.9 1501 – 2000 63 16.2 PhD 25 6.4 2001 – 2500 23 5.9 Occupation 2500 < 28 7.2
Student 168 43.2 Monthly food expenses (TL)
Worker 24 6.2 < 250 65 16.8 Officer 127 32.7 251 – 500 179 46 retired 6 1.5 501 – 750 84 21.6 Housewife 17 4.4 751 – 1000 36 9.3 Tradesman 15 3.9 1001-1250 7 1.8 Others (unemployed) 32 8.3 1250 < 18 4.6 * 1 dollar = 1.5 Tl
table 2
participants’ demographic changes
X2 G
Gender *
Education level 19.865** 20.908** Gender * Income level 24.027*** 22.958*** Education level*
Income level 87.141*** 88.856*** Income level *
Food expense 172.621*** 144.504***
approximately as 42% and 40 %, respectively. As shown in Table 4, no significant relationships between soybean consumption with gender and age groups of participants were found. Participants with good education consumed soybean mince more than others (P<0.01), but flaked soybean meat less than the others (P<0.01). We arrived at the conclusion that the participants with low edu-cation level could not discriminate flaked soybean meat from normal meat. No significant relationship between soybean meatballs mix consumption and education level was determined (P>0.05).
table 3
consumption rates (%) and frequencies of different functional food types
Functional food type Daily Weekly Monthly Yearly None Soybean Products 4.37 20.3 20.8 8.74 45.8 Herbal Teas 11.3 15.6 18.76 12.4 42.41 Cereal Products 5.65 13.11 14.65 9.51 57.07 Dairy Products 7.08 13.01 13.73 8.1 60.06 Column Average 7.1 15.5 16.99 9.69 51.34 table 4
effects of demographic changes on the frequency of soybean products consumption
X2 G
Gender * Flaked soybean 3.452ns 3.598 ns Gender * Soybean mince 0.990 ns 1.042 ns Gender * Soybean meatball price 1.556 ns 1.642 ns Education level * Flaked soybean 39.727** 47.134*** Education level * Soybean mince 42.675** 50.132***
of the participants to soybean products were found to be 4.37 % for daily, 20.30% for weekly, 20.80% for monthly, 8.74% for yearly and 45.80 % for none, respectively. In Turkish markets, soybean products have various forms, namely; soybean flaked meat, soybean mince, and soybean meat-balls mix. Flaked soybean meat was consumed weekly by 43% of the participants. Proportions of participants who monthly consume soybean mince, and soybean meatballs mix were calculated
Functional Herbal Teas
As seen from Table 2, herbal tea products were consumed by 57.59 % of all participates in survey. Consumption proportions (%) and frequencies of the participants to these products were estimated as 11.30 % for daily, 15.60 % % for weekly, 18.76 for monthly, 12.4% for yearly and 42.41 % for none, respectively. Herbal teas which are submit-ted commonly to consumption in Turkish markets are linden tea, sage tea, green tea, winter tea, and
rosehip teas. Corresponding monthly consumption proportions of these teas were found as 40.1%, 40%, 28%, 29% and 36%, respectively.
While woman consume linden tea, sage tea and green tea more often, no correlation is found between gender and consumption of winter and rosehip teas (P<0.05). Except for rosehip tea, no statistical correlation between participant’s age and consumption of herbal teas is found. rosehip tea is commonly consumed by people less than 40. The more education levels of participants increase, the more they consume linden tea, sage tea, green tea and rosehip tea but the less they consume winter tea (P<0.05). Except for winter tea, the relationship between participant’s occupation and consump-tion of herbal teas is insignificant. Winter tea is consumed more commonly by retirees (P<0.05). No statistically significant correlation is found be-tween income level and consumption of functional herbal teas (P<0.05).
Functional Cereal Products
42.93% of participants in the survey consumed functional cereal foods. Consumption proportions (%) and frequencies of the participants to these products were determined as 5.65 % for daily,
13.11 % for weekly, 14.65% for monthly, 9.51 % for yearly and 57.07 % for none, respectively (Table 2). Functional cereal products which were found commonly in Turkey markets are oaten bread, oat bran including biscuits, fibre rich crack-er, low calorie pretzel, low calorie cake, granola and fibre rich macaroni respectively. Consumption ratios of fibre rich bread of those who participated to survey was found to be totally 83.33%; namely, 29% for daily, 31.1% for weekly, and 23.23% for monthly, respectively. Daily, monthly, and yearly consumption ratios of all functional cereal products ranged 7-29 %, 25-32%, and 23-43%, re-spectively. In a study conducted in some European union countries, it is stated that people more com-monly choose to use whole meal bread from the functional bakery products (Dean et al., 2007).
Women are consuming all of functional bakery products more than man. From the entire woman took part in the survey, 50% declared to consume whole grain bread while 35% consume oaten biscuits at least once a week. No significant cor-relation between bakery products consumption and participant’s age and occupation is found (P>0.05). While consumption of oaten / wheaten biscuit in-creases statistically as the education level inin-creases
table 5
effects of demographic changes on the frequency of functional herbal tea consumption
X2 G
Gender * linden tea 14.803** 14.786**
Gender * Sage tea 9.2* 0.062ns
Gender * Green tea 15.369** 14.661** Gender * Winter tea 0.632 ns 0.656 ns Gender * rosehip tea 2.695 ns 2.747 ns
Age * rosehip tea 38.593** 38.757**
Education level * linden tea 38.335** 41.649** Education level * Sage tae 50.868*** 52.843*** Education level* Green tea 39.671** 43.383*** Education level * Winter tea 31.705* 27.156ns Education level * rosehip tea 30.693* 33.558*
table 6
the affect of demographic changes on the consumption of functional bakery products
X2 G
Gender * Wholemeal / rye bread 14.882** 15.488** Gender * Oaten / wholemeal biscuit 14.566** 13.168* Gender * Wholegrain crackers 14.495** 13.637** Gender * light crackers 16.996** 15.489** Gender * light cake 3.402ns 2.343ns Gender * Breakfast cereal 19.506*** 17.603*** Education level * Oat biscuits with wholegrain 33.584* 39.337** Income level * Wholegrain / rye bread 44.488*** 45.773*** Income level * Oat biscuits with wholegrain 32.497* 33.121*
(P<0.05), the relationship between consumption of other bakery products and participants age and occupation is insignificant (P>0.05). The more participant’s income level increase, the more does the consumption of wheaten / rye bread and oaten/ wheaten biscuit (P<0.05), additionally, the change in the consumption of other bakery products is found to be insignificant (P>0.05) (Table 6).
Functional Dairy Products
It clearly demonstrated in Table 2 that of all participants, 39.94% consumed functional dairy products. Consumption proportions (%) and fre-quencies of the participants to these dairy products were calculated as 7.08% for all daily, 13.01% for weekly, 13.73% for monthly, 8.10 % for yearly and 51.34% for none, respectively. Functional dairy products in Turkish markets are low calorie (light) milk, cheese and yogurt, lactose free milk, contain-ing omega-3, prebiotic and prebiotic milk, addcontain-ing calcium and vitamin A,D,E milk, prebiotic yogurt and kephir (fermented milk drink) respectively.
Although woman consume all functional milk and dairy products except for lactose free milk more than man, no statistical difference is found between gender and consumption of those prod-ucts. Significant correlation is found between consumption of prebiotic milk, Ca and vitamin
added milk, light yogurt and kephir and the age of the participants (P<0.05). These products are commonly consumed by young (21-31 ages) people. In another study conducted, it is found out that woman are choosing the yogurt which in-clude more functional components, and the young people (18-29 ages) and women display more positive behaviour in consuming functional prod-ucts (Ares & Ga’mbaro, 2007). While significant relationship between participant’s education level and consumption of Ca and vitamin added milk and light yogurt is found (P<0.05), no explain-able relationship is found between consumption of other functional dairy products and education level. By the increase in education level, while the consumption of Ca and vitamin added milk has decreased, consumption of light yogurt has increased. A significant relationship is found only between occupation and income level of partici-pants and consumption of prebiotic milk and light yogurt (P<0.05). It is found out that retirees and housewives consume prebiotic milk, and craftsman and housewives consume light yogurt more often. This condition may be caused by these people having limited physical activity.
On the other hand, enhancement in income level has increased the consumption frequency of these two products (Table 7).
table 7
the effect of demographic changes on consumption of functional dairy products
X2 G
Gender * light milk 6.634ns 6.482 ns Gender * lactose-free milk 3.707 ns 4.051 ns Gender * Omega-3 including milk 4.379 ns 4.797 ns Gender * Prebiotic milk 8.799 ns 9.007 ns Gender * Prebiotic milk 5.214 ns 4.421ns Gender * Ca and vitamins added milk 2.509 ns 2.762 ns Gender * light yogurt 5.928ns 5.852ns Gender * Prebiotic yogurt 8.997ns 8.438ns Gender * Prebiotic yoghurt drink 4.733 ns 5.068 ns Gender * light cheese 5.467 ns 5.386 ns Gender * Kephir 6.734 ns 6.381 ns
Age * Prebiotic milk 37.338** 36.205**
Age * Ca and vitamin added dairy products 39.687** 43.362**
Age * light yogurt 34.781* 43.290**
Age * Kephir 32.548* 30.996*
Education level * Ca and vitamin added milk 35.997** 44.100*** Education level * light yogurt 45.773*** 55.400*** Occupation * Prebiotic milk 52.424* 44.985* Occupation * light yogurt 44.497* 51.675* Income level * Prebiotic milk 32.613* 35.247* Income level * light yogurt 36.181* 38.340**
Determination of Acknowledgement Level In order to figure out the acknowledgement level of participants in the survey, some sorts of questions are asked. The first question directed to the consumers is composed of six options and four of these options identify functional food in at least from one way. 47.2% of participants knew at least one of the true options without marking any false option. On the other hand, the number of partici-pants to mark the false definition is so few, which is 4.4%. The difference in education levels of the participants is found to be insignificant in terms of the answers given to this question.
In the second question directed to the partici-pants, expressions such as functional food,
pre-biotic, propre-biotic, lactose, omega 3, calcium and their definitions are given in a table at random arrangement. Participants were asked to match the expressions with definitions. The percentages of true matching functional food, probiotic, prebiotic, lactose, omega 3 and calcium is found to be 49.6, 30.3, 47.8, 25.7, 39.1 and 40.1 respectively. The average of these values is 38.76%. As it is seen in Table 7, the percentages concerning true matching in five expressions, the woman’s and participant’s between 21-40 ages is found to be statistically significant (P<0.01). As the education level and income level of participants improve, generally the true matching percentages increases and sta-tistically significant relationship is found between
table 8
the affects of demographic changes on consciousness level concerning functional foods
X2 G
Education level* Place of purchase 77.760*** 79.491*** Income * Place of purchase 58.122*** 60.970*** Gender * Definition of functional food matching 15.782*** 15.155*** Gender * Matching probiotic definition 8.633** 8.938** Gender * Lactose definition matching 15.663*** 16.347*** Gender * Matching prebiotic definition 11.198** 11.490** Gender * Omega-3 to match description 14.470*** 14.436*** Gender * Calcium definition matching 12.550** 12.823** Age * Definition of functional food matching 28.667*** 30.561*** Age * Probiotic definition matching 28.666*** 31.768*** Age * Lactose definition matching 35.985*** 36.324*** Age * Prebiotic definition matching 22.721** 25.193** Age * Definition of omega-3 matching 32.708*** 35.016*** Age * Calcium definition matching 29.674*** 32.054*** Education level * Correct identification of functional food 36.031*** 36.331*** Education level * Correct identification of probiotic 31.039*** 30.502*** Education level * Correct identification of lactose 54.777*** 59.435*** Education level * Correct identification of prebiotic 30.532*** 30.823*** Education level * Correct identification of omega-3 57.883*** 64.962*** Education level * Correct identification of calcium 58.991*** 64.842*** Income level * Correct identification of functional food 20.076* 20.696* Income level * Correct identification of probiotic 23.632** 23.932** Income level * Correct identification of lactose 23.819** 23.977** Income level * Correct identification of prebiotic 16.426ns 16.413ns Income level * Correct identification of omega-3 33.315*** 32.824*** Income level * Correct identification of calcium 20.230* 20.030* Gender * Cereal product consumption purpose 19.812*** 20.172*** Education level * Herbal tea consumption purpose 24.919** 24.566** Education level * Cereal product consumption purpose 20.496* 21.519* Profession * Herbal tea consumption purpose 25.739* 27.076* Income level * Herbal tea consumption purpose 24.559** 27.921** Income level * Dairy products consumption purpose 18.588* 19.089*
them (P<0.05).
table 9
participant’s expectations from functional food and importance level
Effect of functional food importantVery importantSome unimportant
Health effects 81.38 6.46 12.12
Mood impact 69.95 11.82 18.27
Weight control 68.39 15.06 15.53
The presence of Artificial Additives 75.66 9.2 15.16 Suitability and familiarity 77.83 10.7 11.46
Price 81.13 7.43 11.4
and they are asked to tell the reason why they con-sume the aforementioned functional food groups (herbal teas, milk and dairy products, soybean products, bakery products and margarine).
Functional herbal teas in our country are gen-erally used for; cold, being helpful in digestion, they do not include cholesterol, and decrease bad cholesterol level. An important amount of the par-ticipants (68.8%) have marked at least one of these options. The relationship between education level, income level (P<0.01) and occupation (P<0.05) of the participants and knowing the consumption rea-son of those herbal teas is found to be significant. While the most of the correct answers are given by secondary school graduates and craftsman, the unemployed and retirees gave the least correct an-swers. The more income level increases, the more true the answer given becomes.
Functional milk and dairy products are gener-ally produced by adding calcium, prebiotic and probiotic ingredients. 38.8% of the participants in the survey stated that they choose to use func-tional milk and dairy products for it includes such ingredients. By the increase in income levels of the participants, the true purpose of consumption has increased.
Higher amounts of protein content and being free of cholesterol attract the attention of vegetar-ians and the others. Only 20.1% of the participants have marked one of these soybean products such as soybean meat, minced soybean etc. The
con-sumption of higher amounts of soybean products may be because they have been compared with meat products or consumers want to taste a new product.
Bakery products generally include high amo-unts of fibre (bran) and β-glucan. 45.8% of the participants point out that they choose to consumes bakery products for they include these compo-nents. The relationship between consumption of these products and level of education is found to be significant (P<0.05).
Margarine industry is putting forward this prod-uct by adding functional additives such as folic acid, omega fatty acids and vitamins to especially margarine for breakfast. Besides, in their adver-tisements, they lay stress on the point that their products do not include trans-fatty acids. Only 30.3% of the participants have marked at least one of these components affect their preferences. Within the framework of this survey, as we have a look at the consciousness level, the aver-age is seen to be 39.96%. While woman know the consumption reasons of bakery products very well (P<0.001), no significant relationship is found between true answers for other functional groups and the gender of the participants (P>0.05). A considerable significance is found between the age and food expenditures of the participants and the correct answers given to this question (P>0.05).
As it is understood from the answers given to these three questions which are for determining the
table 10
effects of demographic changes on purchasing functional food and expectations from these foods
X2 G
Gender * No additives 10.554** 11.662**
Gender * Consist of natural ingredients 2.202ns 2.300ns Gender * Having low-calorie 12.196** 13.004** Gender * Product price 12.154** 15.317** Age * No artificial additives 27.143* 21.971ns Age * Consist of natural components 33.531** 34.899** Age * Compliance with religious sensitivities 6.131ns 6.136ns Age * The same as or similar to traditional products features 26.283* 23.821ns Age * The appropriate ingredients in the correct amount 28.835* 27.371* Age * No genetically modified components 29.378* 29.094* Education level * Positive effect on the immune system 41.565*** 43.397*** Education level * Contribution to mental power 34.506** 35.270** Education level* Protection against cholesterol, coronary heart
problems, cancer 41.653*** 41.718***
Education level * Contribution to coping with the stress 34.993** 34.487** Education level * No additives 52.590*** 54.024*** Education level * Consist of natural components 28.666* 27.334* Education level * Compliance with religious sensitivities 13.435ns 15.498ns Education level * Presence of ingredients written on the label 39.608*** 40.424*** Education level * No genetically modified components 28.791* 29.895* Occupation * Positive effect on the immune system 45.089** 49.072*** Occupation * Contribution to coping with the stress 39.720** 36.347* Occupation * No artificial additives 35.342* 39.110*
consciousness level, the consciousness level of the participants about functional food is approximately 40%. Participants are asked where it is possible for them to get functional food. In our country, functional food is generally sold in supermarkets and herbalists. The majority of the participants (75.1%) know where to supply these special foods. As the level of education and income improves, so does the percentages of supplying functional food from supermarkets (P<0.05)
Factors Affecting in Purchasing Functional Food
We have tried to determine which factors are effective for a consumer to buy a functional food in our country and what are the expectations from the food (Table 8). At the same time, the effects of demographic changes on buying a functional food and expectations from this food is determined (Table 9).
consider that functional food is effective for health (Table 8). In a study carried out by Ares and Ga’mbaro (2007) at uruguay pointed out that uruguayan people expecting health from different functional food which is very important. A similar expression was used for Belgians (Wim Verbeke, 2006). The expectations of the participants from functional food in terms of health is its; having positive effects on mental impact (83.4%), be-ing helpful in digestion (84.3%) and protective against cholesterol, cardiovascular diseases, cancer and such (79.7%). No difference is found between participant’s gender and their health ex-pectations from functional foods (P>0.05). While the education level of the participants improves, their expectations such as contribution to immune system by functional food, to mental development and protection against cholesterol, cardiovascular disease, cancer etc. increases considerably high (P<0.01). The relationship between occupational clusters and health expectations is found to be significant (P<0.05). As we compared with other groups, health expectations like contribution to immune system in workers and the unemployed is considerably low. No significant relationship is found between increase in income level of partici-pants and aforementioned expectations concerning health from functional foods (P>0.05).
Nowadays, especially in developed countries, one of the most important health problems is stress. Majority of the participants (79.5%) expect func-tional food to get over this problem they have. On the other hand, expectations such as delighting fea-ture by substantial amount of participant (59.7%) are thought-provoking in terms of consciousness. Although the health expectation is proportionally high in young participants in general, the rela-tionship between gender, income level and age of participants in the survey and these expectations is found not to be significant (P>0.05). As the educa-tion level of the participants increase, their health expectation of getting over stress by functional food substantially increases (P<0.01). A statisti-cally significant difference has observed between
occupational groups and expectations from func-tional food for getting over stress (P<0.05). While all craftsmen have this expectation, 62.5% of the workers consider this insignificant.
In the recent times, doubts about food additives and especially their usage doses have increased. 82.8% of the participants do not want artificial additives in functional food. Woman and young participants (age<40) are more sensitive about this issue (P<0.05). The more education levels of participants increase, so does this sensitivity (P<0.001). Additionally, increase in education level increases the demand to natural components (P<0.05). 92.8% of the participants who are be-tween 21-30 want these foods to be composed of natural components. Within this group, workers and the unemployed ones pay the least attention to the existence of these artificial additives in foods (P<0.05). Regardless of their income levels, all participants do not want artificial additives in functional foods.
As it is well-known, there are strong ties be-tween many chronic ailments and obesity. Even though this is not a problem in our country as it is in developed countries, people are aware of this problem. Thus, one of the things they expect (66.1%) from functional food is to include lesser calories. While all age groups expect functional foods to include lesser calories, the expectation of woman is far more than other’s (P<0.05). No significant relationship is found between income levels of the participants and functional food to include lesser calories (P>0.05).
We think that product prices have grate effects on the demand towards functional foods in our country. regardless of education level or income level, 80% of the participants pointed out that, functional food to be expensive effects purchasing them. The wish of woman about functional food not to be expensive is found to be statistically significant (P<0.05). The relationship between income level and product prices to have effects on purchasing is found to be insignificant (P<0.05). Functional food to be; in the same or similar
taste with traditional food, prepared agreeable to religion, not including genetically modified com-ponents and all its ingredients to be written down completely is considered to be highly significant by the majority (75%, 76.8%, 67.9% and 78.7% respectively) of the participants. regardless of age, occupation, income level and education level, participants want the products to be agreeable to religion (P>0.05). Ingredient of the functional foods to be written down accurately on the pack-age and their not including genetically modified ingredients is something mostly wanted by young and participants with higher levels of education (P<0.05). But, in terms of these questions, the dif-ference between work clusters and income levels is statistically insignificant (P>0.05). For this reason, functional food producers should take this issue very serious in times of food development.
conclusion
Desired levels of understanding about func-tional food have not reached in our country.
rather than treating diseases, the protective functional foods should be introduced on the market. Functional food producers related civil or governmental institutions should make more studies to increase awareness’ of public. It should be kept in mind that these efforts will reduce treat-ment expenditures; therefore will also contribute to the economy of the country.
The level of consciousness and the desir-ability of choosing these products affected by some factors such as; demographic changes like gender, age, education and income level, and the price, compliance with religious sensitivities, the presence of genetically modified components or artificial additives. For this reason, functional food producers should take these factors into con-sideration before they launch out the production of functional food. In order to get more knowl-edge about Turkish consumers, more studies are required. Because of emotional peculiarities of Turkish society, especially the effects of visual and sensorial materials used in functional food adver-tisements on purchasing of the product should be also investigated.
references
Ares, G., and A. Ga’mbaro, 2007. Influence of gender,
age and motives underlying food choice on perceived healthiness and willingness to try functional foods. Ap-petite, 49: 148–158.
bech-larsen , t., k. G. Grunert and J. poulsen, 2001.
The acceptance of functional foods in Denmark, Finland and the united States: A study of consumers’ conjoint evaluations of the qualities of functional foods and per-ceptions of general health factors. MAPP Working Papers 73, university of Aarhus, Aarhus School of Business, The MAPP Centre.
Blandon, J., J. Cranfield and S. Henson, 2007. Functional
Food and Natural Health Product Issues: The Canadian and International Context. International Food Economy research Group. Department of Food, Agricultural and resource Economics Guelph, Ontario, Canada.
childs, n. m. and G. h. poryzees, 1998. Foods that help
prevent disease: consumer attitudes and public policy implications. British Food Journal, 9: 419-426.
de Jong, n., m. c. ocke, h. A. c. branderhorst and r. friele, 2003. Demographic and lifestyle characteristics
of functional food consumers and dietary supplement users. British Journal of Nutrition, 89: 273.281.
dean, m, r. shepherd, A. Arvola, m. Vassallo, m. win-kelmann, e. claupein, l. la¨hteenmaki, m. m. raats, and A. saba, 2007. Consumer perceptions of healthy
cereal products and production methods. Journal of Cereal Science, 46: 188–196.
diplock, A. t., p. J. Aggett, m. Ashwell, f. bornet, e. b. fern, and m. b. robertfroid, 1999. Scientific concepts
of functional foods in Europe: consensus document. Brit-ish Journal of Nutrition, 81 (4): 1–27.
eyduran, e., 2008. usage of penalized maximum likelihood
estimation method in medical research: An alternative to maximum likelihood estimation method. Journal of Research in Medical Sciences, 13 (6): 325-330.
ilsi europe., 2002. Concepts of functional foods. IlSI
Europe Concise Monograph Series, Belgium.
menrad, k., 2003. Market and marketing of functional food
in Europe. Journal of Food Engineering, 56: 181–188.
Verbeke, w., 2006. Functional foods: Consumer willingness
to compromise on taste for health? Food Quality and Preference, 17: 126–131.